. 2021 May 4;12(3):e00167-21.
doi: 10.1128/mBio.00167-21.

Human Cytomegalovirus Uses a Host Stress Response To Balance the Elongation of Saturated/Monounsaturated and Polyunsaturated Very-Long-Chain Fatty Acids

Affiliations

Human Cytomegalovirus Uses a Host Stress Response To Balance the Elongation of Saturated/Monounsaturated and Polyunsaturated Very-Long-Chain Fatty Acids

Yuecheng Xi et al. mBio. .

Abstract

Stress and virus infection regulate lipid metabolism. Human cytomegalovirus (HCMV) infection induces fatty acid (FA) elongation and increases the abundance of lipids with very-long-chain FA (VLCFA) tails. While reprogramming of metabolism can be stress related, the role of stress in HCMV reprogramming of lipid metabolism is poorly understood. In this study, we engineered cells to knock out protein kinase R (PKR)-like endoplasmic reticulum kinase (PERK) in the ER stress pathway and measured lipid changes using lipidomics to determine if PERK is needed for lipid changes associated with HCMV infection. In HCMV-infected cells, PERK promotes increases in the levels of phospholipids with saturated FA (SFA) and monounsaturated FA (MUFA) VLCFA tails. Further, PERK enhances FA elongase 7 (ELOVL7) protein levels, which elongates SFA and MUFA VLCFAs. Additionally, we found that increases in the elongation of polyunsaturated fatty acids (PUFAs) associated with HCMV infection were independent of PERK and that lipids with PUFA tails accumulated in HCMV-infected PERK knockout cells. Additionally, the protein levels of ELOVL5, which elongates PUFAs, are increased by HCMV infection through a PERK-independent mechanism. These observations show that PERK differentially regulates ELOVL7 and ELOVL5, creating a balance between the synthesis of lipids with SFA/MUFA tails and PUFA tails. Additionally, we found that PERK was necessary for virus replication and the infectivity of released viral progeny. Overall, our findings indicate that PERK-and, more broadly, ER stress-may be necessary for the membrane biogenesis needed to generate infectious HCMV virions.IMPORTANCE HCMV is a common herpesvirus that establishes lifelong persistent infections. While infection is asymptomatic in most people, HCMV causes life-threatening illnesses in immunocompromised people, including transplant recipients and cancer patients. Additionally, HCMV infection is a leading cause of congenital disabilities. HCMV replication relies on lipid synthesis. Here, we demonstrated that the ER stress mediator PERK controls FA elongation and the cellular abundance of several types of lipids following HCMV infection. Specifically, PERK promotes FA elongase 7 synthesis and phospholipids with saturated/monounsaturated very-long-chain FA tails. Overall, our study shows that PERK is an essential host factor that supports HCMV replication and promotes lipidome changes caused by HCMV infection.

Keywords: ER stress; PERK; fatty acid elongases; herpesviruses; human cytomegalovirus; lipidomics; lipids; very-long-chain fatty acids.


Figures

FIG 1
FIG 1
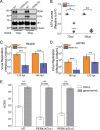
HCMV infection upregulates PERK and ATF4 protein levels. (A) Western blot analysis of PERK and ATF4 protein levels in uninfected and HCMV TB40/E-infected fibroblast cells at a multiplicity of infection (MOI) of 1 infectious unit per cell. Numbers at the left are molecular masses (in kilodaltons). (B, C) Quantification of PERK and ATF4 protein levels following normalization to the actin level. The value for PERK or ATF4 at each time point is shown relative to the level in uninfected cells at the same time point. A dashed line represents the level in uninfected cells, and each data point from three independent experiments is shown with the mean represented as a bar. *, P < 0.05; **, P < 0.01; paired-sample t test. n = 3.
FIG 2
FIG 2
PERK enhances HCMV replication. (A) Western analysis of PERK and ATF4 protein levels in PERK-KO-c1 and NT cells infected at an MOI of 1. (B) Quantification of ATF4 protein levels following normalization to tubulin protein levels. The value for ATF4 is shown relative to the level in TB40/E-infected NT cells. Each data point from three independent experiments is shown, with the mean represented as a bar. (C) PERK-KO-c1 and NT cells were infected with TB40/E at an MOI of 1. The number of infectious intracellular and extracellular viruses was measured at 120 hpi and 144 hpi by determining the TCID50. (D) The release of infectious virus particles was assayed by infecting PERK-KO-c1 and NT cells with AD169 at an MOI of 1. At 96 hpi and 120 hpi, infectious extracellular virus released into the growth medium was measured by determining the TCID50. (E) Virus yields in cell-free supernatants were determined at 144 hpi following an infection at an MOI of 3 (white bars). In the same supernatants, the number of genome-containing particles released by cells was measured by qPCR (gray bars). The genome-to-infectious unit (IU) ratio was determined, and the values are listed above the bars. *, P < 0.05; **, P < 0.01; ***, P < 0.001. (B) One-sample t test. (C to E) Two-sample t test. n = 3.
FIG 3
FIG 3
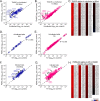
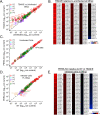
HCMV infection elevates diglycerides (DGs) and triglycerides (TGs), which are further increased by the loss of PERK. (A) Relative levels of DGs in TB40/E-infected cells and uninfected cells at 96 hpi. Sodiated and ammoniated adducts of DGs were measured by liquid chromatography high-resolution tandem mass spectrometry (LC-MS/MS) using electrospray ionization (ESI) following normalization by cell number. Each dot in the plot represents the level of an adduct form of a DG lipid in TB40/E-infected cells relative to its level in uninfected cells. The dashed line represents a relative level of 1 (i.e., the level in infected cells is equal to the level in uninfected cells). (B) Relative levels of TGs in TB40/E-infected cells and uninfected cells at 96 hpi. TG data were analyzed and visualized using the same methods described for panel A. (C) Changes in the relative levels of DGs and TGs in cells were quantified by averaging the relative levels of the sodiated and ammoniated adducts if both were measured. The averaged relative fold changes were log transformed and are visualized as a heatmap. (D, E) Relative levels of DGs and TGs in uninfected PERK-KO and NT cells. (F to H) Relative levels of DGs and TGs in TB40/E-infected PERK-KO and NT cells at 96 hpi. DGs and TGs were analyzed and visualized as described for panels A to C. All cells were infected at MOI of 3. n = 3.
FIG 4
FIG 4
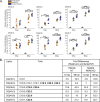
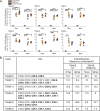
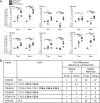
HCMV infection elevates DG lipids with long-chain and very-long-chain polyunsaturated fatty acid tails. (A) Levels of DGs that were most prominently changed in TB40/E-infected cells relative (rel.) to those in uninfected cells at 96 hpi. These are the top six elevated DGs shown in the heatmap of Fig. 3C. Three independent experiments were performed, each with duplicated samples, for a total of six data points. Each data point is graphed relative to the levels observed in uninfected NT cells on a log2 scale. For comparison, the relative levels at 72 hpi are also shown. *, P < 0.5; **, P < 0.01; ***, P < 0.001. One-way ANOVA, Tukey’s test. (B) The fatty acid tails for DGs shown in panel A were identified by LC-MS/MS. Long-chain fatty acids (LCFAs) contain 13 to 21 carbons, and very-long-chain fatty acids (VLCFAs) contain 22 carbons or more. LCFAs and VLCFAs that are polyunsaturated fatty acids (PUFAs), i.e., have two or more double bonds, are in bold text. The table contains the average fold changes in abundance of the lipids in TB40/E-infected NT and PERK-KO cells relative to their levels in uninfected NT cells. n = 6.
FIG 5
FIG 5
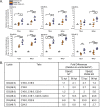
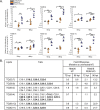
Loss of PERK leads to an accumulation of DGs in HCMV-infected cells. (A) Levels of DGs that were most prominently changed in TB40/E-infected PERK-KO cells relative to levels in infected NT cells at 96 hpi. These represent the top six elevated DGs shown in the heatmap of Fig. 3H. Each data point represents a sample from three independent experiments and is graphed relative to the levels observed in uninfected NT cells on a log2 scale. For comparison, the relative levels at 72 hpi are also shown. *, P < 0.5; **, P < 0.01; ***, P < 0.001. One-way ANOVA, Tukey’s test. (B) The fatty acid tails for DGs shown in panel A were identified by LC-MS/MS. The table contains the average fold changes in abundance of the lipids in TB40/E-infected NT and PERK-KO cells relative to their levels in uninfected NT cells. n = 6.
FIG 6
FIG 6
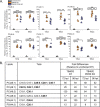
HCMV infection increases TGs, including those with saturated and monounsaturated very-long-chain fatty acid tails. (A) Levels of TGs that were most prominently changed in TB40/E-infected cells relative to their levels in uninfected cells at 96 hpi. These are the top six elevated TGs shown in the heatmap of Fig. 3C. Three independent experiments were performed, each with duplicated samples, for a total of six data points. Each data point is graphed relative to the levels observed in uninfected NT cells on a log2 scale. For comparison, the relative levels at 72 hpi are also shown. *, P < 0.5; **, P < 0.01; ***, P < 0.001. One-way ANOVA, Tukey’s test. (B) The fatty acid tails for TGs shown in panel A were identified by LC-MS/MS. Saturated fatty acids (SFAs) contain no double bond, and monounsaturated fatty acids (MUFAs) contain a single double bond in the hydrocarbon tail. VLCFAs that are also SFAs or MUFAs are in bold text. The table contains the average fold change in abundance of the lipids in TB40/E-infected NT and PERK-KO cells relative to their levels in uninfected NT cells. n = 6.
FIG 7
FIG 7
Loss of PERK leads to an accumulation of TGs, including those with PUFA tails, in HCMV-infected cells. (A) Levels of TGs that were most prominently changed in TB40/E-infected PERK-KO cells relative to their levels in infected NT cells at 96 hpi. These represent the top six elevated TGs shown in the heatmap of Fig. 3H. Each data point represents a sample from three independent experiments and is graphed relative to the levels observed in uninfected NT cells on a log2 scale. For comparison, the relative levels at 72 hpi are also shown. *, P < 0.5; **, P < 0.01; ***, P < 0.001. One-way ANOVA, Tukey’s test. (B) The fatty acid tails for TGs shown in panel A were identified by LC-MS/MS. LCFAs and VLCFAs that are PUFAs are in bold text. The table contains the average fold change in abundance of the lipids in TB40/E-infected NT and PERK-KO cells relative to their levels in uninfected NT cells. n = 6.
FIG 8
FIG 8
HCMV infection elevates phospholipids (PLs), including some reduced by the loss of PERK. (A, B) Relative levels of PLs in TB40/E-infected and uninfected cells at 96 hpi. PLs were measured by LC-MS/MS following normalization by cell number. Each dot in the plot represents the level of a PL in TB40/E-infected cells relative to its level in uninfected cells. The dashed line represents a relative level of 1 (e.g., the level in infected cells is equal to the level in uninfected cells). (C) Relative levels of PLs in uninfected PERK-KO and NT cells. (D, E) Relative levels of PLs in TB40/E-infected PERK-KO and NT cells at 96 hpi. Abbreviations: PC, phosphatidylcholine; PE, phosphatidylethanolamine; PG, phosphatidylglycerol; PI, phosphatidylinositol; and PS, phosphatidylserine. MOI = 3. n = 3.
FIG 9
FIG 9
HCMV infection elevates PLs with SFA and MUFA VLCFA tails that are in part dependent on PERK. (A) Relative abundances of PLs that were most prominently changed in TB40/E-infected cells relative to their levels in uninfected cells at 96 hpi. These are the top six elevated PLs shown in the heatmap of Fig. 8B. Three independent experiments were performed, each with duplicated samples, for a total of six data points. Each data point is graphed relative to the levels observed in uninfected NT cells on a log2 scale. For comparison, the relative levels at 72 hpi are also shown. *, P < 0.5; **, P < 0.01; ***, P < 0.001. One-way ANOVA, Tukey’s test. (B) Tail composition for PLs shown in panel A. Saturated and monounsaturated VLCFAs containing ≥22 carbons and one or fewer double bonds are in bold text. The table contains the average fold change in abundance of the lipids in TB40/E-infected NT and PERK-KO cells relative to their levels in uninfected NT cells. n = 6.
FIG 10
FIG 10
Loss of PERK leads to an accumulation of PLs with PUFA tails in HCMV-infected cells. (A) Abundances of PLs that were most prominently changed in TB40/E-infected PERK-KO cells relative to their levels in infected NT cells at 96 hpi. These are the top six elevated PLs shown in the heatmap of Fig. 8E. Each data point is graphed relative to the levels observed in uninfected NT cells on a log2 scale. For comparison, the relative levels at 72 hpi are also shown. *, P < 0.5; **, P < 0.01; ***, P < 0.001. One-way ANOVA, Tukey’s test. (B) Tail compositions for PLs shown in panel A. LCFAs and VLCFAs that are polyunsaturated are in bold text. The table contains the average fold change in abundance of the lipids in TB40/E-infected NT and PERK-KO cells relative to their levels in uninfected NT cells. ND, not determined. n = 6.
FIG 11
FIG 11
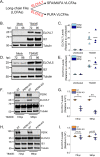
PERK enhances the protein levels of ELOVL7 but not ELOVL5. (A) Schematic showing ELOVL7 and ELOVL5 elongation of SFA/MUFA VLCFAs and PUFA VLCFAs, respectively. (B, C) Western blot analysis and protein quantification for ELOVL7 in HCMV-infected and uninfected HFF cells. ELOVL7 protein levels were normalized to tubulin. (D, E) Western blot analysis and protein quantification for ELOVL5 in HCMV-infected and uninfected HFF cells. (F, G) Western blot analysis and protein quantification for ELOVL7 in TB40/E-infected PERK-KO and NT cells. (H, I) Western blot analysis and protein quantification for ELOVL5 in TB40/E-infected PERK-KO-c1 and NT cells. *, P < 0.05; **, P < 0.01. One-sample t test. MOI of 1. n = 3.
FIG 12
FIG 12
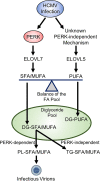
Model for PERK balancing of lipids with SFA/MUFA and PUFA tails through ELOVL7. HCMV infection increases the elongation of FAs by promoting ELOVL5 and ELOVL7. In HCMV-infected cells, PERK activity promotes ELOVL7, increasing the synthesis of SFAs and MUFAs. HCMV infection also increases ELOVL5 through an unknown PERK-independent mechanism. ELOVL5 elongates PUFAs. Both SFAs/MUFAs and PUFAs are incorporated into lipids through synthesis pathways, generating a pool of DGs with SFA/MUFA or PUFA tails. The role of DG-PUFAs in HCMV replication is currently unknown. In HCMV-infected cells, PERK further promotes lipid synthesis by directing DG-SFAs/MUFAs toward PL synthesis pathways, generating PL-SFA/MUFAs. PLs with SFA/MUFA tails are used to generate infectious virions. HCMV infection also promotes the synthesis of TG-SFA/MUFAs from DG-SFAs/MUFAs through an unknown PERK-independent mechanism. The role of TG-SFA/MUFAs in HCMV replication is currently unknown.

Similar articles

Cited by

References

    1. Preiser JC, Ichai C, Orban JC, Groeneveld AB. 2014. Metabolic response to the stress of critical illness. Br J Anaesth 113:945–954. doi:10.1093/bja/aeu187. - DOI - PubMed
    1. Rabasa C, Dickson SL. 2016. Impact of stress on metabolism and energy balance. Curr Opin Behav Sci 9:71–77. doi:10.1016/j.cobeha.2016.01.011. - DOI
    1. Han J, Kaufman RJ. 2016. The role of ER stress in lipid metabolism and lipotoxicity. J Lipid Res 57:1329–1338. doi:10.1194/jlr.R067595. - DOI - PMC - PubMed
    1. Shenk T, Alwine JC. 2014. Human cytomegalovirus: coordinating cellular stress, signaling, and metabolic pathways. Annu Rev Virol 1:355–374. doi:10.1146/annurev-virology-031413-085425. - DOI - PubMed
    1. Siddiquey MNA, Zhang H, Nguyen CC, Domma AJ, Kamil JP. 2018. The human cytomegalovirus endoplasmic reticulum-resident glycoprotein UL148 activates the unfolded protein response. J Virol 92:e00896-18. doi:10.1128/JVI.00896-18. - DOI - PMC - PubMed

Publication types

LinkOut - more resources