

A new method for exploring gene-gene and gene-environment interactions in GWAS with tree ensemble methods and SHAP values
- PMID: 33947323
- PMCID: PMC8097909
- DOI: 10.1186/s12859-021-04041-7
A new method for exploring gene-gene and gene-environment interactions in GWAS with tree ensemble methods and SHAP values
Abstract
Background: The identification of gene-gene and gene-environment interactions in genome-wide association studies is challenging due to the unknown nature of the interactions and the overwhelmingly large number of possible combinations. Parametric regression models are suitable to look for prespecified interactions. Nonparametric models such as tree ensemble models, with the ability to detect any unspecified interaction, have previously been difficult to interpret. However, with the development of methods for model explainability, it is now possible to interpret tree ensemble models efficiently and with a strong theoretical basis.
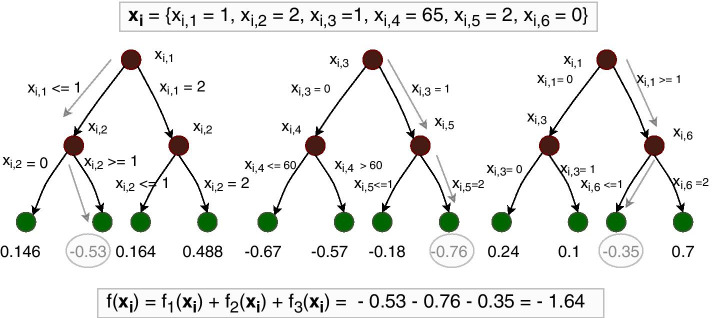
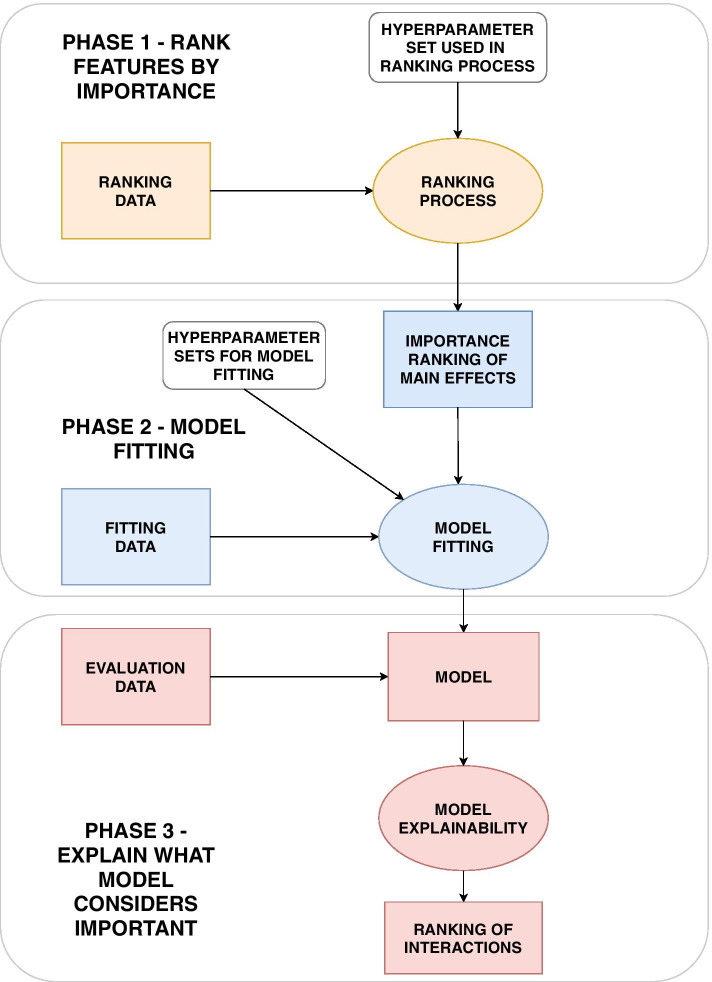
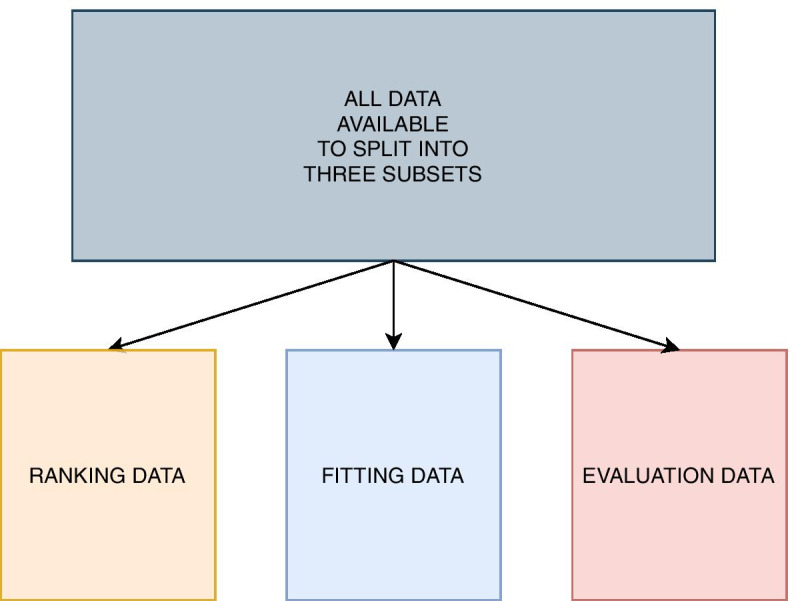
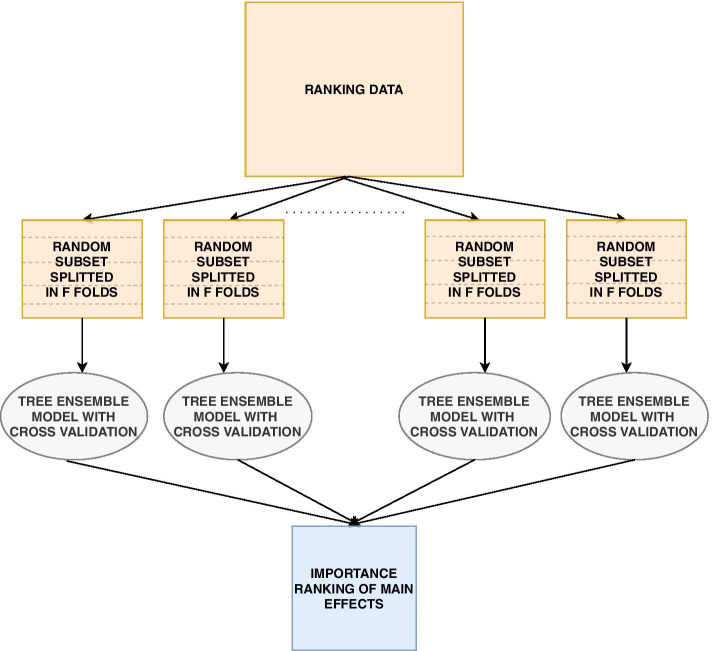
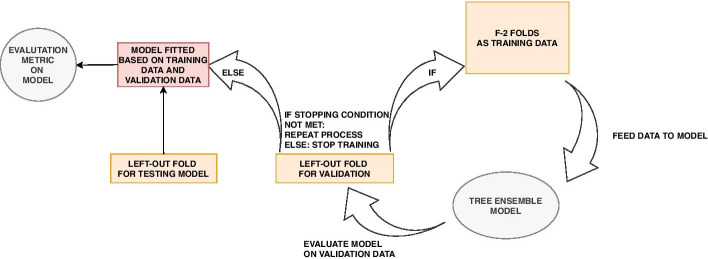
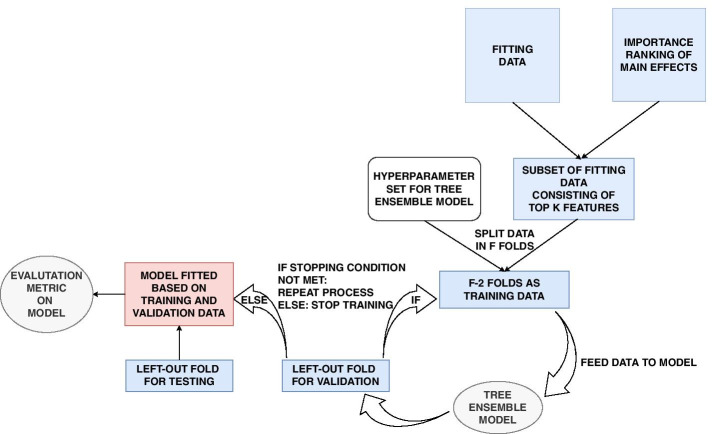
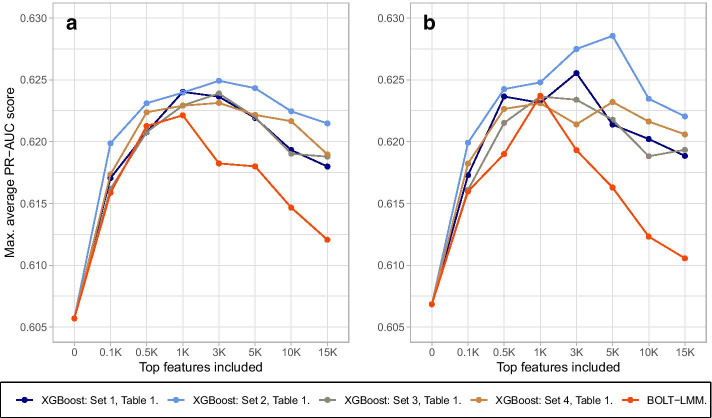
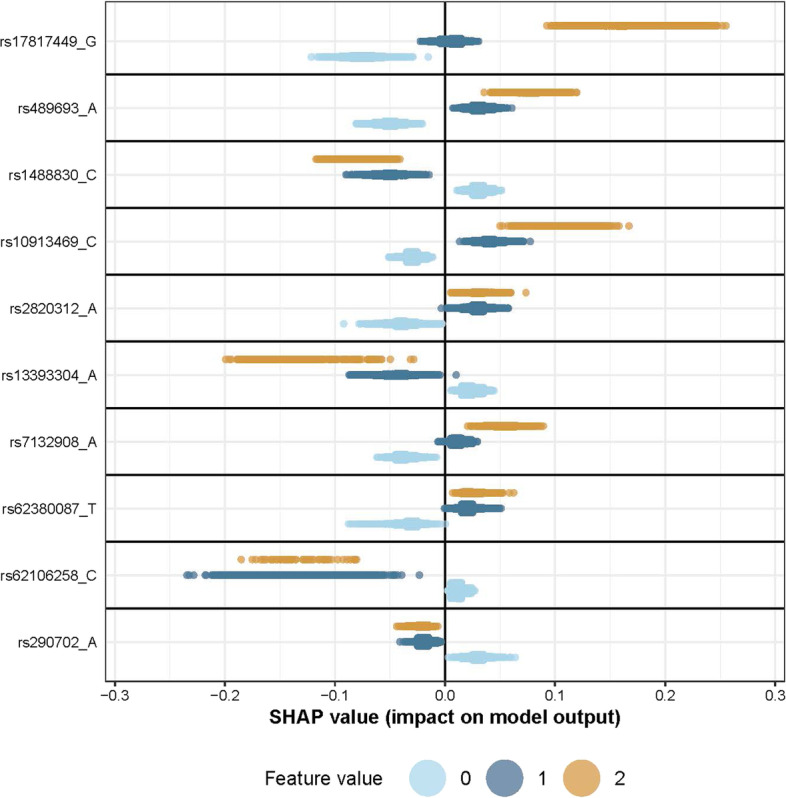
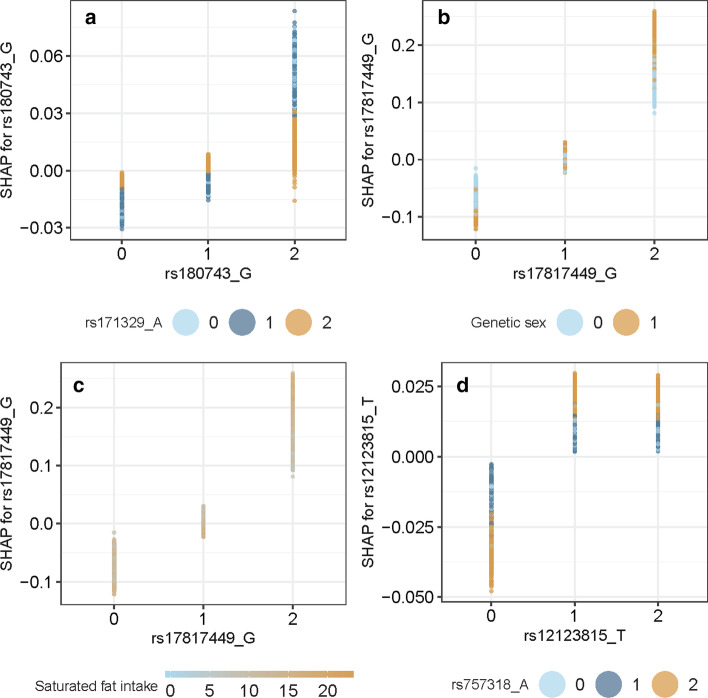
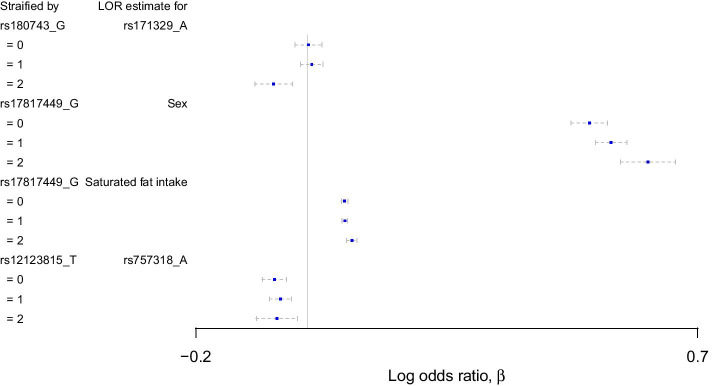
Results: We propose a tree ensemble- and SHAP-based method for identifying as well as interpreting potential gene-gene and gene-environment interactions on large-scale biobank data. A set of independent cross-validation runs are used to implicitly investigate the whole genome. We apply and evaluate the method using data from the UK Biobank with obesity as the phenotype. The results are in line with previous research on obesity as we identify top SNPs previously associated with obesity. We further demonstrate how to interpret and visualize interaction candidates.
Conclusions: The new method identifies interaction candidates otherwise not detected with parametric regression models. However, further research is needed to evaluate the uncertainties of these candidates. The method can be applied to large-scale biobanks with high-dimensional data.
Keywords: GWAS; Gene–gene and gene–environment interactions; Model explainability; SHAP; Tree ensemble models; XGBoost.
Conflict of interest statement
SINTEF DIGITAL is an institute at SINTEF. SINTEF is a non-profit research organization that provided the PhD Scholarship for first author via The Research Council of Norway. Neither The Research Council of Norway nor SINTEF DIGITAL had any role in study design, data collection and analysis, decision to publish, or preparation of the manuscript. The authors declare that they have no competing interests.
Figures
Similar articles
-
Next-generation analysis of cataracts: determining knowledge driven gene-gene interactions using biofilter, and gene-environment interactions using the Phenx Toolkit*.Pac Symp Biocomput. 2015:495-505. Pac Symp Biocomput. 2015. PMID: 25741542
-
Genome-wide association data classification and SNPs selection using two-stage quality-based Random Forests.BMC Genomics. 2015;16 Suppl 2(Suppl 2):S5. doi: 10.1186/1471-2164-16-S2-S5. Epub 2015 Jan 21. BMC Genomics. 2015. PMID: 25708662 Free PMC article.
-
Next-generation analysis of cataracts: determining knowledge driven gene-gene interactions using Biofilter, and gene-environment interactions using the PhenX Toolkit.Pac Symp Biocomput. 2013:147-58. Pac Symp Biocomput. 2013. Corrected and republished in: Pac Symp Biocomput. 2015:495-505. PMID: 23424120 Free PMC article. Corrected and republished.
-
Review of the Gene-Environment Interaction Literature in Cancer: What Do We Know?Genet Epidemiol. 2016 Jul;40(5):356-65. doi: 10.1002/gepi.21967. Epub 2016 Apr 7. Genet Epidemiol. 2016. PMID: 27061572 Free PMC article. Review.
-
Gene-Environment Interactions in Asthma: Genetic and Epigenetic Effects.Yonsei Med J. 2015 Jul;56(4):877-86. doi: 10.3349/ymj.2015.56.4.877. Yonsei Med J. 2015. PMID: 26069107 Free PMC article. Review.
Cited by
-
Human genotype-to-phenotype predictions: Boosting accuracy with nonlinear models.PLoS One. 2022 Aug 31;17(8):e0273293. doi: 10.1371/journal.pone.0273293. eCollection 2022. PLoS One. 2022. PMID: 36044406 Free PMC article.
-
Use of Artificial Intelligence for Predicting Parameters of Sustainable Concrete and Raw Ingredient Effects and Interactions.Materials (Basel). 2022 Jul 27;15(15):5207. doi: 10.3390/ma15155207. Materials (Basel). 2022. PMID: 35955144 Free PMC article.
-
Gene-gene interaction detection with deep learning.Commun Biol. 2022 Nov 12;5(1):1238. doi: 10.1038/s42003-022-04186-y. Commun Biol. 2022. PMID: 36371468 Free PMC article.
-
E-GWAS: an ensemble-like GWAS strategy that provides effective control over false positive rates without decreasing true positives.Genet Sel Evol. 2023 Jul 5;55(1):46. doi: 10.1186/s12711-023-00820-3. Genet Sel Evol. 2023. PMID: 37407918 Free PMC article.
-
Compressive Strength Evaluation of Ultra-High-Strength Concrete by Machine Learning.Materials (Basel). 2022 May 13;15(10):3523. doi: 10.3390/ma15103523. Materials (Basel). 2022. PMID: 35629548 Free PMC article.
References
-
- Maher B, Maher B, editor. Personal genomes: the case of the missing heritability [News]. Nature. 2008. - PubMed
MeSH terms
Grants and funding
LinkOut - more resources
Full Text Sources
