. 2021 Apr 30;4(1):509.
doi: 10.1038/s42003-021-02034-z.

Downregulating carnitine palmitoyl transferase 1 affects disease progression in the SOD1 G93A mouse model of ALS

Affiliations

Downregulating carnitine palmitoyl transferase 1 affects disease progression in the SOD1 G93A mouse model of ALS

Michael Sloth Trabjerg et al. Commun Biol. .

Abstract

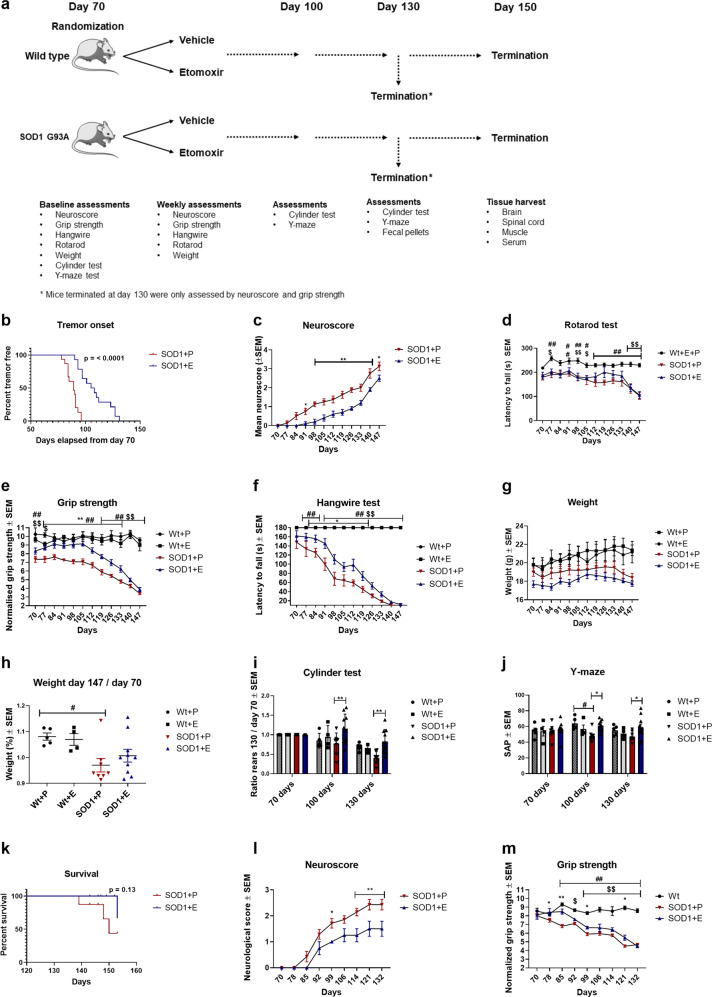
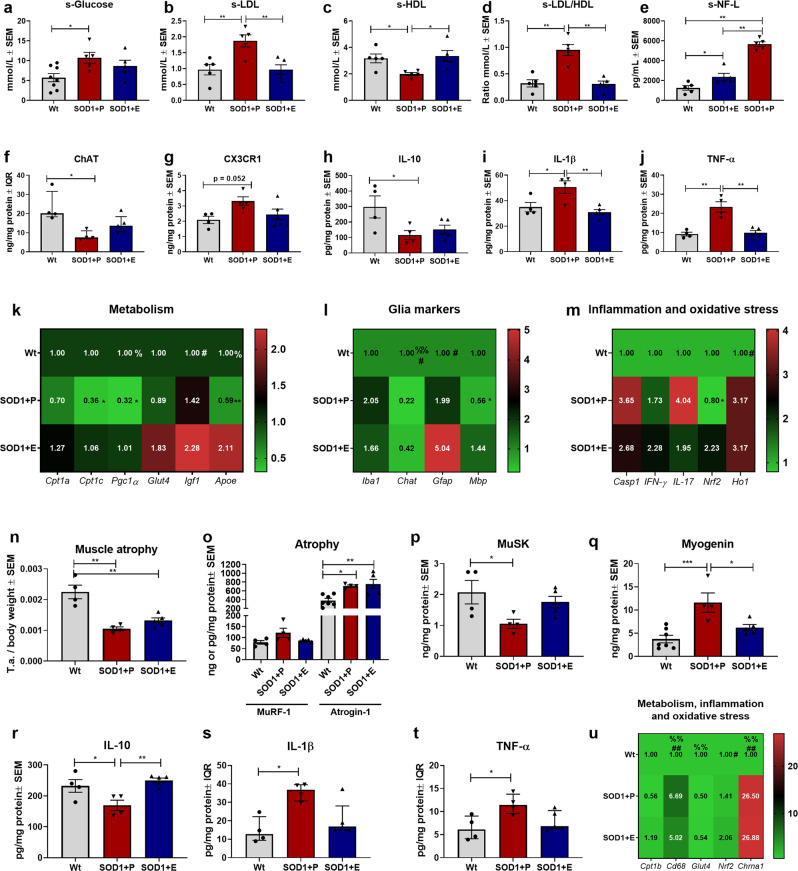
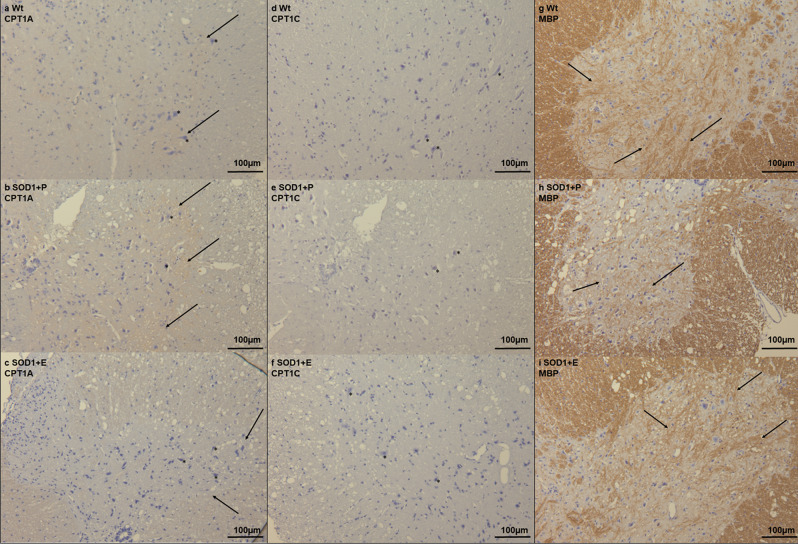
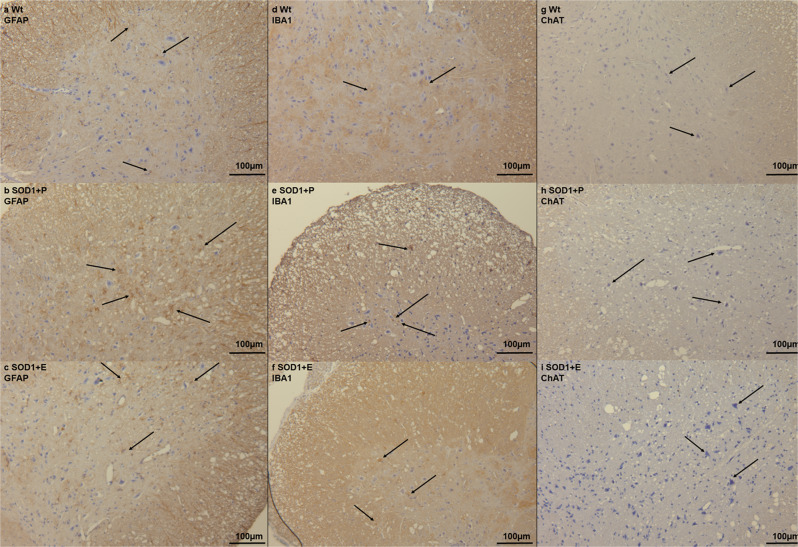
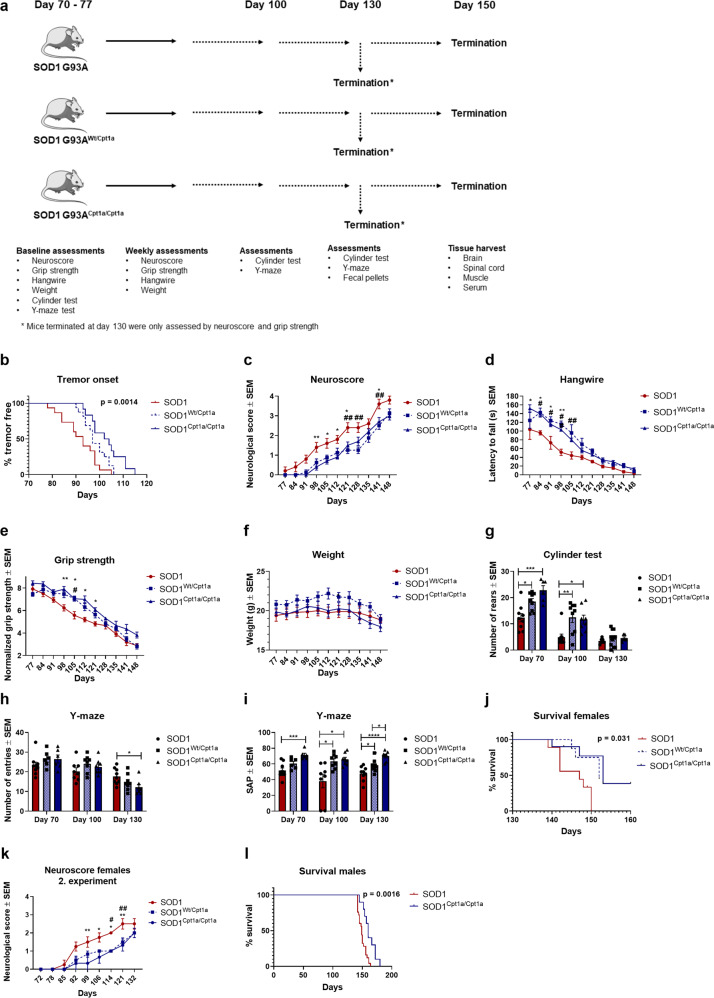
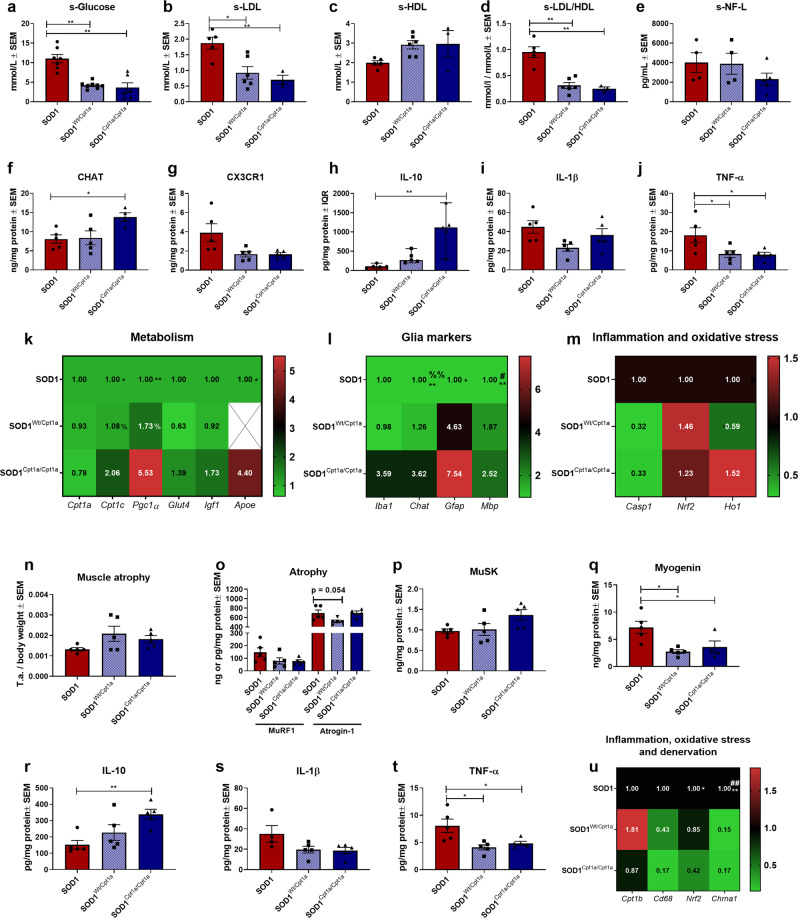
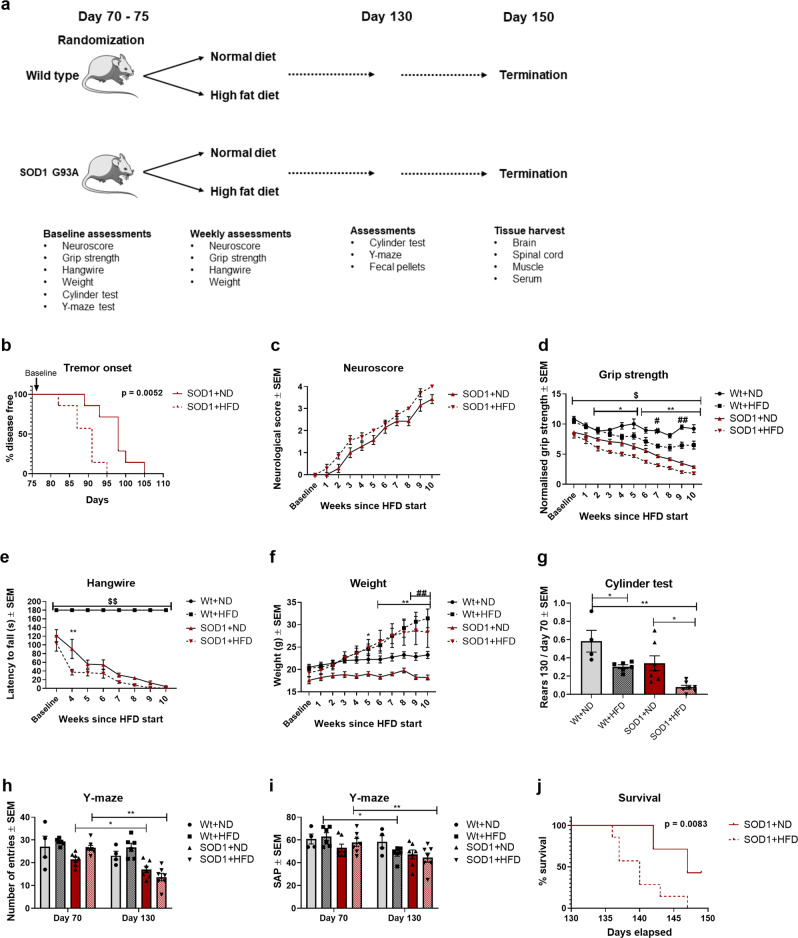
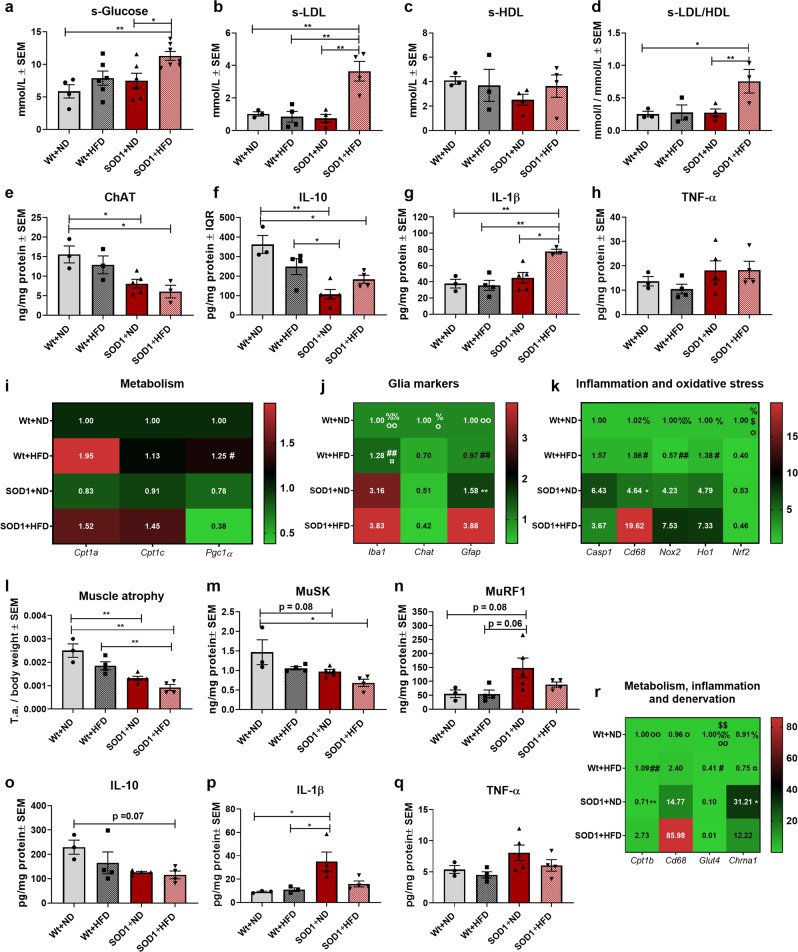
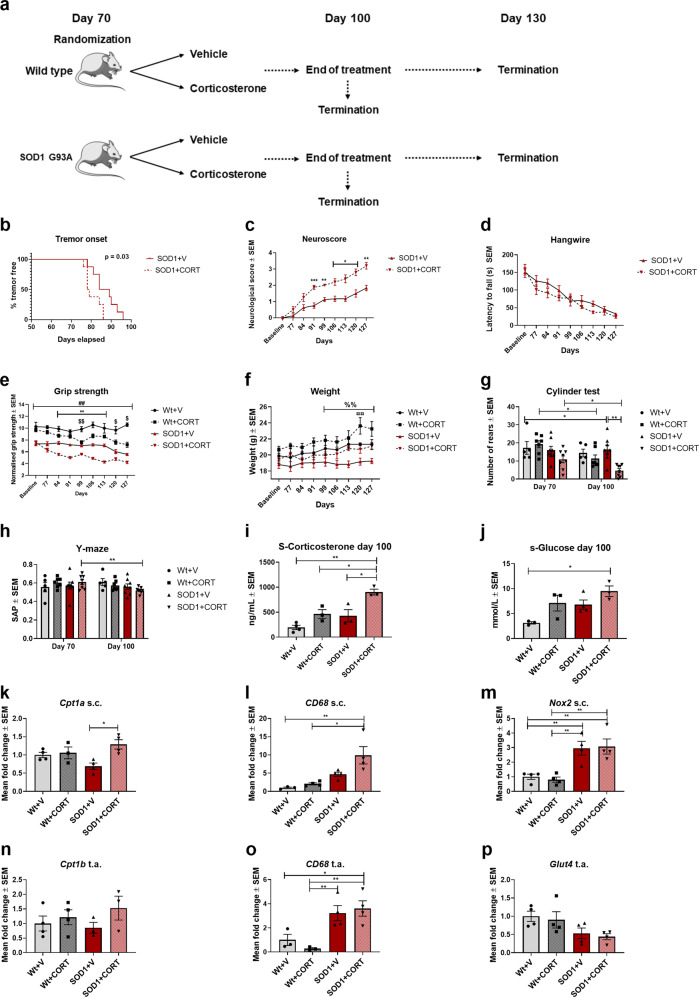
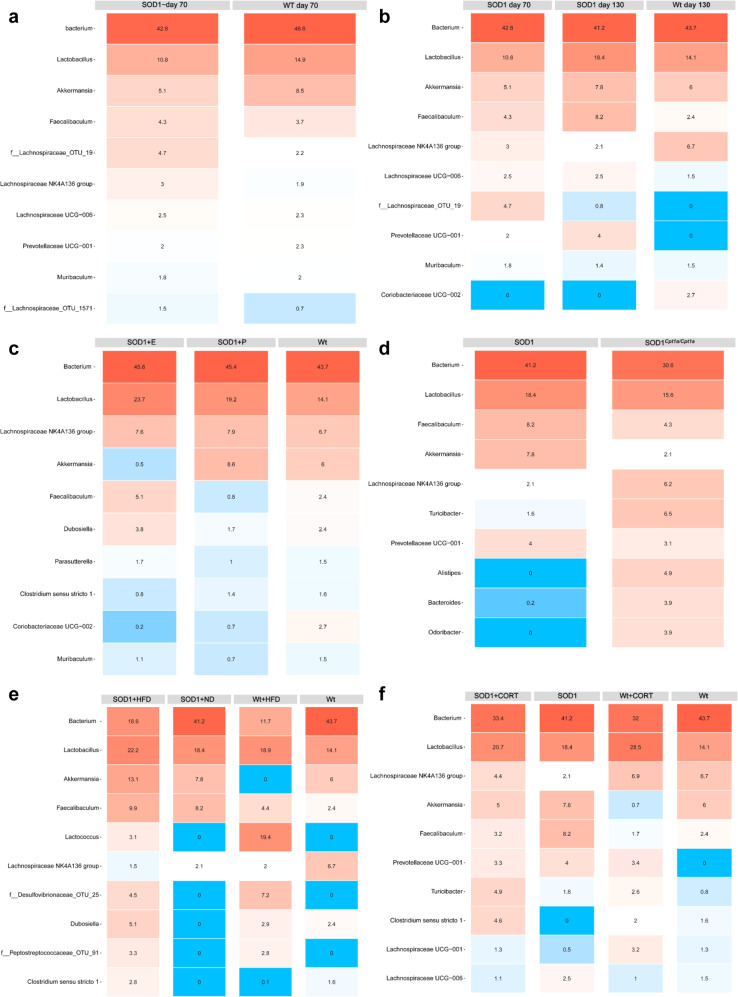
Amyotrophic lateral sclerosis (ALS) is a fatal motor neuron disease characterized by death of motor neurons. The etiology and pathogenesis remains elusive despite decades of intensive research. Herein, we report that dysregulated metabolism plays a central role in the SOD1 G93A mouse model mimicking ALS. Specifically, we report that the activity of carnitine palmitoyl transferase 1 (CPT1) lipid metabolism is associated with disease progression. Downregulation of CPT1 activity by pharmacological and genetic methods results in amelioration of disease symptoms, inflammation, oxidative stress and mitochondrial function, whereas upregulation by high-fat diet or corticosterone results in a more aggressive disease progression. Finally, we show that downregulating CPT1 shifts the gut microbiota communities towards a protective phenotype in SOD1 G93A mice. These findings reveal that metabolism, and specifically CPT1 lipid metabolism plays a central role in the SOD1 G93A mouse model and shows that CPT1 might be a therapeutic target in ALS.


Conflict of interest statement

The authors declare no competing interests.

Figures

Fig. 1
Fig. 1. Downregulating CPT1 by etomoxir ameliorate clinical symptoms and delays disease progression in the SOD1 G93A mouse model.
a Experimental setup, mice were randomized into treatment with etomoxir or placebo at approximately day 70 (baseline) and tested weekly until day. b Time point for onset of disease defined as visible tremor in hindlimbs (n = 11–15), log-rank survival analysis. c Neuroscore was assessed once a week. Mean neuroscore ± SEM (n = 8–10). d Rotarod test was performed once a week. Mean latency to fall ± SEM (n = 4–7). e Grip strength was measured once a week from day 70. Data are presented as mean normalized strength ± SEM (n = 4–10). f Hangwire test was performed once a week. Mean latency to fall of the grid ± SEM (n = 4–10). g Mean body weight expressed in grams ± SEM (n = 4–10). h Mean body weight ratio at day 147 compared to baseline ± SEM (n = 4–10), one-way ANOVA with Tukey post hoc test. i Cylinder test was performed at day 70, 100, and 130. Mean ratio rears between day 100, 130, and baseline ± SEM (n = 4–10). j Y-maze test was conducted at day 70, 100, and 130. Mean spontaneous alternation percentage ± SEM (n = 4–10). k Survival was defined as neuroscore below 4, (n = 8–10), log-rank survival analysis. If nothing else is noted, data was analyzed using repeated measure two-way ANOVA followed by Tukey post hoc test. l Mean neuroscore for SOD1 mice treated from day 70 and until day 130 ± SEM (n = 4–7). m Mean normalized grip strength for SOD1 mice treated from day 70 and until day 130 ± SEM (n = 4–7). Data are representative of three experiments. Repeated measure two-way ANOVA with Tukey post hoc test was performed if nothing else is stated. *Significant differences between SOD1 + E and SOD1 + P, #significant differences between SOD1 G93A + P and Wt, $significant differences between SOD1 + E and Wt. *p ≤ 0.05; **p ≤ 0.01; #p ≤ 0.05; ##p ≤ 0.01; $p ≤ 0.05; $$p ≤ 0.01 WT = wild-type, SOD1 = SOD1 G93A genotype, E = etomoxir, P = placebo. Mouse figure used in experimental setup figures were obtained from; https://smart.servier.com/ and used according to the Creative Commons Attribution 3.0 Unsupported License.
Fig. 2
Fig. 2. Downregulation of CPT1 activity by etomoxir potentially shifts metabolism towards glucose utilization and ameliorate disease mechanisms, including inflammation, mitochondrial dysfunction, and oxidative stress.
a Serum glucose levels. Mean mmol/L ± SEM. b Serum LDL levels. Mean mmol/L ± SEM. c Serum HDL levels. Mean mmol/L ± SEM. d Serum LDL/HDL ratio levels. Mean mmol/L ratio ± SEM. e Serum NF-L levels. Mean pg/mL ± SEM, f ChAT levels in lumbar spinal cord tissue homogenate. Median ng/mg total protein ± IQR. g CX3CR1 levels in lumbar spinal cord tissue homogenate. Mean ng/mg total protein ± SEM. h IL-10 levels in lumbar spinal cord tissue homogenate. Mean pg/mg total protein ± SEM. i IL-1β levels in lumbar spinal cord tissue homogenate. Mean pg/mg total protein ± SEM. j TNF-α levels in lumbar spinal cord tissue homogenate. Mean pg/mg total protein ± SEM. km Fold-change gene expression of metabolic, glial, inflammatory and oxidative stress genes in lumbar spinal cord tissue. Mean normalized fold-change gene expression ± SEM. n Weight of tibialis anterior muscle at termination. Weight of tissue were normalized to body weight and expressed as mean ± SEM. o MuRF1 and atrogin-1 levels in tibialis anterior tissue homogenate. Mean ng/mg total protein ± SEM. p MuSK levels in tibialis anterior tissue homogenate. Mean ng/mg total protein ± SEM. q Myogenin levels in tibialis anterior tissue homogenate. Mean ng/mg total protein ± SEM. r IL-10 levels in tibialis anterior tissue homogenate. Mean pg/mg total protein ± SEM. s IL-1β levels in tibialis anterior tissue homogenate. Mean pg/mg total protein ± SEM. t TNF-α levels in tibialis anterior tissue homogenate. Mean pg/mg total protein ± SEM. u Fold-change gene expression of metabolic, inflammatory, oxidative stress and denervation genes in tibialis anterior tissue homogenate. Mean normalized fold-change gene expression ± SEM. Serum samples and tissue were obtained at termination. All data was analyzed using one-way ANOVA followed by Tukey post hoc test or Kruskal–Wallis test followed by Dunns post hoc test. N = 5–8 for serum analysis and 3–5 for all other experiments. Data are representative of one experiment. Gene expression was normalized to β-actin and Gapdh. *Significant differences between groups in all analyses except gene expression experiments. *p ≤ 0.05; **p ≤ 0.01. Significant annotations in gene expression experiments (one sign = p ≤ 0.05, two signs = p ≤ 0.01). * = SOD1 + P vs. SOD1 + E, % = Wt+P vs. SOD1 + P, # = Wt+P vs. SOD1 + E. Wt = wildtype, SOD1 = SOD1 G93A genotype, E = etomoxir, P = placebo, SEM = standard error of mean, IQR = interquartile range, LDL = low-density lipoproteins, HDL = High-density lipoproteins, NF-L = Neurofilament light-chain, ChAT = Choline o-acetyltransferase, MuSK = Muscle skeletal receptor tyrosine-protein kinase, MuRF1 = Muscle RING-finger protein-1.
Fig. 3
Fig. 3. Immunohistochemical staining in the lumbar spinal from the SOD1 G93A etomoxir experiment.
ac CPT1A staining in lumbar spinal cord from Wt, SOD1 + P and SOD1 + E mice at day 130 indicating increased labeling in SOD1 + P mice (arrows) and pathological morphology of neurons (asterisks). df CPT1C staining in lumbar spinal cord from Wt, SOD1 + P and SOD1 + E mice at day 130 indicating no difference in the labeling in SOD1 + P mice but differences in the morphology of neurons (asterisks). gi MBP staining in lumbar spinal cord from Wt, SOD1 + P and SOD1 + E mice at day 130 indicating decreased labeling in SOD1 + P mice (arrows). All images are presented with 16x magnification. N = 2–4 animals per group. WT = wild-type, SOD1 = SOD1 G93A genotype, E = etomoxir, P = placebo.
Fig. 4
Fig. 4. Immunohistochemical staining in the lumbar spinal from the SOD1 G93A etomoxir experiment.
ac GFAP staining in lumbar spinal cord from Wt, SOD1 + P and SOD1 + E mice at day 130 indicating increased number of reactive astrocytes in the ventral horn in SOD1 + P mice (arrows) compared to Wt and SOD1 + E mice. df IBA1 staining in lumbar spinal cord from Wt, SOD1 + P and SOD1 + E mice at day 130, indicating increased labeling and infiltration of reactive microglia in the ventral horn in SOD1 + P mice (arrows) compared to SOD1 + E and Wt mice. gi ChAT staining in lumbar spinal cord from Wt, SOD1 + P and SOD1 + E mice at day 130 indicating decreased labeling in SOD1 + P mice (arrows) and pathological morphology of neurons. All images are presented with x16 magnification. N = 2–4 animals per group. WT = wild-type, SOD1 = SOD1 G93A genotype, E = etomoxir, P = placebo.
Fig. 5
Fig. 5. Genetic inhibition of CPT1A ameliorates clinical symptoms and delays disease progression in the SOD1 G93A mouse model.
a Experimental setup, mice were evaluated with behavioral tests from day 70 (baseline) and tested weekly until day 150. b Time point for onset of disease defined as visible tremor in hindlimbs, log-rank survival analysis. c Neuroscore was assessed once a week. Mean neuroscore ± SEM. d Hangwire test was performed once a week. Mean latency to fall of the grid ± SEM. e Grip strength was measured once a week from day 70. Data are presented as mean normalized strength ± SEM. f Mean body weight expressed in grams ± SEM. g Cylinder test was performed at day 70, 100, and 130. Mean rears ± SEM. One-way ANOVA with Tukey post hoc test. h Y-maze test was conducted at day 70, 100, and 130. Mean number of entries ± SEM. One-way ANOVA with Tukey post hoc test i Y-maze test was conducted at day 70, 100, and 130. Mean spontaneous alternation percentage ± SEM. One-way ANOVA with Tukey post hoc test. j Survival analysis for females, survival was defined as neuroscore below 4, log-rank test. k Mean neuroscore for SOD1 mice evaluated from day 70 and until day 132 ± SEM. l Survival analysis for females, survival was defined as neuroscore below 4, log-rank test. Animals were tested weekly from day 70 of age until day 148. N = 5–10, except for tremor onset (n = 12–16) and survival analyses (n = 8–10 for females, n = 10–25). Data are representative of two independent animal experiments for females from day 70 and until day 150 and one for day 70 and until day 132. If nothing else is noted, data was analyzed using repeated measure two-way ANOVA followed by Tukey post hoc test. *Significant differences between SOD1Cpt1a/Cpt1a and SOD1, #significant differences between SOD1Wt/Cpt1a and SOD1 in behavioral tests. *p ≤ 0.05; **p ≤ 0.01; ***p ≤ 0.001, ****p ≤ 0.0001. SOD1 = SOD1 G93A genotype, SOD1Wt/Cpt1a = SOD1 G93A mice with heterozygote Cpt1a P479L mutation, SOD1Cpt1a/Cpt1a = SOD1 G93A mice with homozygote Cpt1a P479L mutation. Mouse figure used in experimental setup figures were obtained from; https://smart.servier.com/ and used according to the Creative Commons Attribution 3.0 Unsupported License.
Fig. 6
Fig. 6. Downregulation of CPT1A activity by Cpt1a P479L mutations potentially shifts metabolism towards glucose utilization and ameliorate disease mechanisms including inflammation, mitochondrial dysfunction, and oxidative stress.
a Serum glucose levels. Mean mmol/L ± SEM. b Serum LDL levels. Mean mmol/L ± SEM. c Serum HDL levels. Mean mmol/L ± SEM. d Serum LDL/HDL ratio levels. Mean mmol/L ratio ± SEM. e Serum NF-L levels. Mean pg/mL ± SEM, f ChAT levels in lumbar spinal cord tissue homogenate. Mean ng/mg total protein ± SEM. g CX3CR1 levels in lumbar spinal cord tissue homogenate. Mean ng/mg total protein ± SEM. h IL-10 levels in lumbar spinal cord tissue homogenate. Median pg/mg total protein ± IQR. i IL-1β levels in lumbar spinal cord tissue homogenate. Mean pg/mg total protein ± SEM. j TNF-α levels in lumbar spinal cord tissue homogenate. Mean pg/mg total protein ± SEM. km Fold-change gene expression of metabolic, glial, inflammatory and oxidative stress genes in lumbar spinal cord tissue. Mean normalized fold-change gene expression ± SEM. n Weight of tibialis anterior muscle at termination. Weight of tissue were normalized to body weight and expressed as mean ± SEM. o MuRF1 and atrogin-1 levels in tibialis anterior tissue homogenate. Mean ng/mg total protein ± SEM. p MuSK levels in tibialis anterior tissue homogenate. Mean ng/mg total protein ± SEM. q Myogenin levels in tibialis anterior tissue homogenate. Mean ng/mg total protein ± SEM. r IL-10 levels in tibialis anterior tissue homogenate. Mean pg/mg total protein ± SEM. s IL-1β levels in tibialis anterior tissue homogenate. Mean pg/mg total protein ± SEM. t TNF-α levels in tibialis anterior tissue homogenate. Mean pg/mg total protein ± SEM. u Fold-change gene expression of metabolic, inflammatory, oxidative stress and denervation genes in tibialis anterior tissue homogenate. Mean normalized fold-change gene expression ± SEM. Serum samples and tissue were obtained at termination. All data was analyzed using one-way ANOVA followed by Tukey post hoc test or Kruskal–Wallis test followed by Dunns post hoc test. N = 3–8 for serum analysis and 3–5 for all other experiments. Data are representative of one experiment. Gene expression was normalized to β-actin and Gapdh. *Significant differences between groups in all analyses except gene expression experiments. *p ≤ 0.05; **p ≤ 0.01. Significant annotations in gene expression experiments (one sign = p ≤ 0.05, two signs = p ≤ 0.01). * = SOD1 vs. SOD1Cpt1a/Cpt1a, % = SOD1Wt/Cpt1a vs. SOD1Cpt1a/Cpt1a, # = SOD1 vs. SOD1Wt/Cpt1a. SOD1 = SOD1 G93A genotype, SOD1Wt/Cpt1a = SOD1 G93A mice with heterozygote Cpt1a P479L mutation, SOD1Cpt1a/Cpt1a = SOD1 G93A mice with homozygote Cpt1a P479L mutation, SEM = standard error of mean, IQR = interquartile range, LDL = low-density lipoproteins, HDL = High-density lipoproteins, NF-L = Neurofilament light-chain, ChAT = Choline o-acetyltransferase, MuSK = Muscle skeletal receptor tyrosine-protein kinase, MuRF1 = Muscle RING-finger protein-1.
Fig. 7
Fig. 7. High-fat diet accelerates disease progression in the SOD1 G93A mouse model.
a Experimental setup, mice were randomized into HFD or ND at approximately day 70 (baseline) and tested weekly until 10 weeks since baseline (day 150). b Time point for onset of disease defined as visible tremor in hindlimbs (n = 7), log-rank survival analysis. c Neuroscore was assessed once a week. Data are presented as means ± SEM (n = 7). d Hangwire test was performed once a week. Data are presented as mean latency to fall of the grid  ± SEM (n = 7). e Grip strength was measured once a week from day 70.Data are presented as means ± SEM (n = 4–7). f Mean body weight expressed in grams ± SEM (n = 4–7). g Cylinder test was performed at day 70 and day 130. Data are presented as mean ratio rears between day 130 and baseline ± SEM (n = 4–7). h Y-maze test was conducted at day 70 and day 100. Data are presented as mean entries ± SEM (n = 4–7). i Y-maze test was conducted at day 70 and day 100. Data are presented as mean spontaneous alternation percentage ± SEM (n = 4–7). j Survival was defined as neuroscore below 4, (n = 7), log-rank survival analysis. If nothing else is noted, data was analyzed using repeated measure two-way ANOVA followed by Tukey post hoc test. Data are representative of two experiments. *Significant differences between SOD1 + ND and SOD1 + HFD, $significant difference between SOD1 and Wt, #significant differences between Wt + ND and Wt + HFD in behavioral tests. *Significant differences between groups in serum analyses. *p ≤ 0.05; **p ≤ 0.01; #p ≤ 0.05; ##p ≤ 0.01, $p ≤ 0.05, $$p ≤ 0.01. Wt = wildtype, SOD1 = SOD1 G93A genotype, ND = normal diet, HFD = High-fat diet. Mouse figure used in experimental setup figures were obtained from; https://smart.servier.com/ and used according to the Creative Commons Attribution 3.0 Unsupported License.
Fig. 8
Fig. 8. 60% HFD results in exacerbation of disease mechanisms in the SOD1 G93A mouse model.
a Serum glucose levels in serum samples obtained at termination. Mean mmol/L ± SEM. b Serum LDL levels in serum samples obtained at termination. Mean mmol/L ± SEM. c Serum HDL levels in serum samples obtained at termination. Mean mmol/L ± SEM. d Serum HDL levels in serum samples obtained at termination. Mean mmol/L ± SEM. e ChAT levels in lumbar spinal cord tissue homogenate obtained at termination. Mean ng/mg total protein ± SEM. f IL-10 levels in lumbar spinal cord tissue homogenate obtained at termination. Mean pg/mg total protein ± SEM. g IL-1β levels in lumbar spinal cord tissue homogenate obtained at termination. Mean pg/mg total protein ± SEM. h TNF-α levels in lumbar spinal cord tissue homogenate obtained at termination. Mean pg/mg total protein ± SEM. ik Fold-change gene expression of metabolic, glial, inflammatory and oxidative stress genes in lumbar spinal cord tissue obtained at termination. Mean normalized fold-change gene expression ± SEM. l Weight of tibialis anterior muscle obtained at termination. Weight of tissue was normalized to body weight and expressed as mean ± SEM. m MuSK levels in tibialis anterior tissue homogenate obtained at termination. Mean ng/mg total protein ± SEM. n MuRF1 levels in tibialis anterior tissue homogenate obtained at termination. Mean ng/mg total protein ± SEM. o IL-10 levels in tibialis anterior tissue homogenate obtained at termination. Mean pg/mg total protein ± SEM. p IL-1β levels in tibialis anterior tissue homogenate obtained at termination. Mean pg/mg total protein ± SEM. q TNF-α levels in tibialis anterior tissue homogenate obtained at termination. Mean pg/mg total protein ± SEM. r Fold-change gene expression of metabolic, inflammatory and denervation genes in tibialis anterior tissue obtained at termination. Mean normalized fold-change gene expression ± SEM. All data was analyzed using two-way ANOVA followed by Tukey post hoc test. N = 4–7 for serum analysis and 3–5 for all other experiments. Data are representative of one experiment. Gene expression was normalized to β-actin and Gapdh. *Significant differences between groups in all analyses except gene expression experiments. *p ≤ 0.05; **p ≤ 0.01. Significant annotations in gene expression experiments (one = p ≤ 0.05, two = p ≤ 0.01), # = Wt+HFD vs. SOD1 + HFD, % = Wt+ND vs. SOD1 + HFD, o = Wt+ND vs. SOD1 + ND, ¤ = Wt+HFD vs. SOD1 + ND, $ = Wt+ND vs. Wt+HFD, * = SOD1 + ND vs. SOD1 + HFD Wt = wildtype, SOD1 = SOD1 G93A genotype, ND = normal diet, HFD = High-fat diet, LDL = low-density lipoproteins, HDL = High-density lipoproteins, ChAT = Choline o-acetyltransferase, MuSK = Muscle skeletal receptor tyrosine-protein kinase, MuRF1 = Muscle RING-finger protein-1.
Fig. 9
Fig. 9. Corticosterone accelerates disease progression in the SOD1 G93A mouse model.
a Experimental setup, mice were randomized into treatments at approximately day 70 and tested weekly. 3–4 mice were terminated at day 100 and the rest (3–4) were terminated at day 130. b Time point for onset of disease defined as visible tremor in hindlimbs (n = 8), log-rank survival analysis. c Neuroscore was assessed once a week. Data are presented as means ± SEM (n = 8). Mixed effect analysis with Tukey post hoc test. d Hangwire test was performed once a week. Data are presented as mean latency to fall of the grid ± SEM (n = 8). Mixed effect analysis with Tukey post hoc test. e Grip strength was measured once a week from day 70. Data are presented as means ± SEM (n = 5–8). Mixed effect analysis with Tukey post hoc test. f Mean body weight expressed in grams ± SEM (n = 5–8). Mixed effect analysis with Tukey post hoc test. g Cylinder test was performed at day 70 and day 100. Data are presented as mean rears ± SEM (n = 5–8). Repeated measure two-way ANOVA with Tukey post hoc test. h Y-maze test was conducted at day 70 and day 100. Data are presented as mean spontaneous alternation percentage ± SEM (n = 5–8). Paired t-test. i Corticosterone levels in serum obtained at day 100 was analyzed using ELISA. Data are presented as mean ng/mL (n = 3–4). Two-way ANOVA with Tukey post hoc test. j Glucose levels in serum at day 100. Data are expressed as mean mmol/L ± SEM (n = 3–4). Two-way ANOVA with Tukey post hoc test. km Cpt1a, Cd68, and Nox2 gene expression in the lumbar spinal cord from mice terminated at day 130. Data are presented at mean normalized fold-change. Expression was normalized to β-actin and Gapdh. N = 3–4. Two-way ANOVA with Tukey post hoc test. np Cpt1b, Cd68, and Glut4 gene expression in the tibialis anterior muscle from mice terminated at day 130. Data are presented at mean normalized fold-change. Expression was normalized to β-actin and Gapdh. N = 3–4. Two-way ANOVA with Tukey post hoc test. Data are representative of two animal experiments. Serum and RT-qPCR experiment was conducted once. *Significant differences between SOD1 + V and SOD1 + CORT, #significant difference between SOD1 and Wt, $significant differences between Wt + V and Wt + CORT, % significant differences between SOD1 + V and Wt-CORT in body weight analysis, ¤significant difference between Wt+CORT and SOD1 + CORT in body weight analysis. *p ≤ 0.05; **p ≤ 0.01; #p ≤ 0.05; ##p ≤ 0.01, $p ≤ 0.05, $$p ≤ 0.01, % p ≤ 0.05, %%p ≤ 0.01. WT = wildtype, SOD1 = SOD1 G93A genotype, V = Vehicle, CORT = Corticosterone. Mouse figure used in experimental setup figures were obtained from; https://smart.servier.com/ and used according to the Creative Commons Attribution 3.0 Unsupported License.
Fig. 10
Fig. 10. Modulation if CPT1 activity by etomoxir, genetic inhibition, high-fat diet, and corticosterone modulates the gut microbiota in SOD1 G93A mice.
a Heatmap illustrating the ten most abundant communities at the genus level in fecal samples from SOD1 mice and Wt mice at day 70. Values represents mean relative abundancy. b Heatmap illustrating the ten most abundant communities at the genus level in fecal samples from SOD1 mice at day 70, day 130, and Wt mice at day 130. Values represents mean relative abundancy. c Heatmap illustrating the ten most abundant communities at the genus level in fecal samples from SOD1 + P, SOD1 + E, and Wt mice at day 130. Values represents mean relative abundancy. d Heatmap illustrating the ten most abundant communities at the genus level in fecal samples from SOD1 and SOD1Cpt1a/Cpt1a mice at day 130. Values represents mean relative abundancy. e Heatmap illustrating the ten most abundant communities at the genus level in fecal samples from SOD1 + ND, SOD1 + HFD, Wt+ND, and Wt+HFD mice at day 130. Values represents mean relative abundancy. f Heatmap illustrating the ten most abundant communities at the genus level in fecal samples from SOD1, SOD1 + CORT, Wt, and Wt+CORT mice at day 130. Values represents mean relative abundancy. Fecal pellet samples were harvested at day 70 or day 130, n = 4–5. Data are representative of one 16S rRNA sequencing experiment. Wt = wildtype, SOD1 = SOD1 G93A genotype, SOD1Cpt1a/Cpt1a = SOD1 G93A mice with homozygote Cpt1a p479l mutation. E = etomoxir, P = placebo, HFD = high-fat diet, CORT = corticosterone.

Similar articles

Cited by

References

    1. Brown RH, Al-Chalabi A. Amyotrophic lateral sclerosis. N. Engl. J. Med. 2017;377:162–172. doi: 10.1056/NEJMra1603471. - DOI - PubMed
    1. Chiò A, et al. Global epidemiology of amyotrophic lateral sclerosis: a systematic review of the published literature. Neuroepidemiology. 2013;41:118–130. doi: 10.1159/000351153. - DOI - PMC - PubMed
    1. Rosen DR, et al. Mutations in Cu / Zn superoxide dismutase gene are associated. Nature. 1993;362:59–62. doi: 10.1038/362059a0. - DOI - PubMed
    1. Gurney ME, et al. Motor neuron degeneration in mice that express a human Cu,Zn superoxide dismutase mutation. Science. 1994;264:1772–1775. doi: 10.1126/science.8209258. - DOI - PubMed
    1. van Es MA, et al. Amyotrophic lateral sclerosis. Lancet. 2017;390:2084–2098. doi: 10.1016/S0140-6736(17)31287-4. - DOI - PubMed

Publication types