. 2021 Apr 29;27(7):791-804.
doi: 10.1261/rna.078747.121. Online ahead of print.

Sigma factor dependent translational activation in Bacillus subtilis

Affiliations

Sigma factor dependent translational activation in Bacillus subtilis

Dylan M McCormick et al. RNA. .

Abstract

Sigma factors are an important class of bacterial transcription factors that lend specificity to RNA polymerases by binding to distinct promoter elements for genes in their regulons. Here we show that activation of the general stress sigma factor, σB, in Bacillus subtilis paradoxically leads to dramatic induction of translation for a subset of its regulon genes. These genes are translationally repressed when transcribed by the housekeeping sigma factor, σA, owing to extended RNA secondary structures as determined in vivo using DMS-MaPseq. Transcription from σB-dependent promoters ablates the secondary structures and activates translation, leading to dual induction. Translation efficiencies between σB- and σA-dependent RNA isoforms can vary by up to 100-fold, which in multiple cases exceeds the magnitude of transcriptional induction. These results highlight the role of long-range RNA folding in modulating translation and demonstrate that a transcription factor can regulate protein synthesis beyond its effects on transcript levels.

Keywords: B. subtilis; RNA structure; dual induction; sigma factor; translation efficiency.


Figures

FIGURE 1.
FIGURE 1.
σB can activate both transcription and translation. (A) Models of transcriptional and translational induction for a transcriptional unit consisting of a promoter, coding sequence, and terminator. Stimuli are indicated with lightning bolts and ribosomes are colored in yellow. (B) RNA-seq, (C) ribosome profiling, and (D) apparent translation efficiency measurements from σB active and inactive conditions. σB regulon genes are indicated with black crosses (+), and subsets that are translationally activated or translationally repressed are highlighted in red and yellow, respectively (Rend-seq/ribosome profiling traces shown in Supplemental Fig. S4). Induced σB regulon genes without complex isoform architecture (Materials and Methods) are highlighted in cyan (Rend-seq/ribosome profiling traces for a subset shown in Supplemental Fig. S5). The dashed blue lines mark a 3.7-fold change in expression for visual reference. The dashed red line is an approximate threshold (2.7-fold) separating the population of translationally activated genes from those whose apparent TE does not markedly change. The insets show the cumulative distribution function (CDF) of fold change (FC) across the two conditions in each measurement, with separate CDFs for all genes (gray) and σB regulon genes (black). The percentage of genes in each group exceeding the chosen thresholds are listed on the right. Contributions of mRNA levels and translation to changes in protein synthesis rate among (E) translationally activated σB regulon genes and (F) a representative subset of induced σB regulon genes without complex isoform architecture. The fold change in protein synthesis rate is indicated by the height of the bars up to the arrows (arrows pointing down correspond to decreased translation efficiency). The light and dark gray regions denote the respective contributions of mRNA levels and translation, that is, fold-change in protein synthesis = (fold-change in mRNA level) × (fold-change in translation efficiency).
FIGURE 2.
FIGURE 2.
Translationally activated σB regulon genes display alternative mRNA isoforms. Rend-seq and ribosome profiling data from conditions with inactive/active σB for the operons containing (A) ctc and (B) yvrE (σB regulon genes are highlighted in red). Orange and blue bars represent 5′- and 3′-mapped read counts, respectively, and the black scale bars correspond to 0.5 kb. Fold changes (FC) for Rend-seq and ribosome profiling between σB active and σB inactive conditions are shown. Rend-seq 5′ ends corresponding to the σB-dependent transcription start sites are marked by red arrows. Putative σB-dependent promoter sequences are listed for each gene (+1 corresponds to the 5′ end of the σB-dependent isoform mapped by Rend-seq). The consensus sequences for the −10 and −35 regions of σB-dependent promoters are GTTTaa and GGG(A/T)A(A/T) (Petersohn et al. 1999). For ctc specifically, the additional 5′/3′ peak pair (*) in the σB active condition corresponds to a spurious RNase A cleavage site that likely occurred post-lysis. See also Supplemental Figures S1, S2.
FIGURE 3.
FIGURE 3.
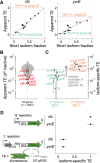
σB-dependent mRNA isoforms have elevated TE. (A) Estimation of the isoform-specific TE for the short, σB-dependent and long, σA-dependent isoforms of ctc and yvrE. Each point is an experimental condition which has a different short isoform fraction and correspondingly different apparent TE (conditions shown in Fig. 2 are distinctly marked by a triangle and a square for σB inactive and active, respectively). Error bars correspond to standard deviations from subsampling bootstraps. The gray lines are linear regressions, whereas the dashed lines indicate estimates of isoform-specific TE calculated from the fits (Materials and Methods). Estimated isoform-specific TEs and errors (standard deviations) from a bootstrapped linear fit (Materials and Methods) are shown. (B) Distribution (beeswarm and boxplot, whiskers corresponding to 10th and 90th percentile) of apparent TE in σB inactive conditions. Translationally activated σB regulon genes (subset from Fig. 1 for which isoform-specific TE could be estimated, Materials and Methods) are marked (red). (C) Isoform-specific TE values inferred, with error bars as in A. (D) Fluorescent reporter assay for validating differential TE between isoforms. Protein expression (from fluorescence) and mRNA levels (from RT-qPCR) were measured for synthetic constructs (left) representing σA-dependent (L) and σB-dependent (S) isoforms. Relative (to S reporters) isoform-specific TE (right) was calculated by dividing relative protein expression by relative mRNA levels. Errors bars represent the standard deviation for technical replicates (n = 3 for fluorescence, n = 4 for RT-qPCR). See also Supplemental Figure S3.
FIGURE 4.
FIGURE 4.
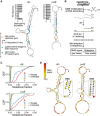
σA-dependent mRNA isoforms have extended secondary structures in vivo. (A) Minimum free energy (MFE) structures of the σA-dependent isoforms of ctc and yvrE near the ribosome binding site. The transcription start sites of σB-dependent isoforms (indicated with arrows), putative Shine–Dalgarno (SD) sequences, and start codons are highlighted in magenta, blue, and green, respectively. The stop codon of the upstream gene in the operon is indicated with an orange box. Computationally determined base-pairing probabilities for individual bases in the SD sequences are shown beside each structure. (B) DMS-MaPseq workflow for in vivo RNA structure determination of σA-dependent isoforms. (C) Cumulative distributions of the per-base mutational fractions for the σA-dependent isoforms of ctc and yvrE. Solid and dashed lines indicate conditions with and without DMS treatment. (D) DMS-constrained MFE structures of representative transcripts for σA-dependent isoforms of ctc and yvrE colored by normalized DMS-MaPseq mutation rate (DMS signal), where values correspond to increased base accessibility. Structured regions containing putative SD sequences are magnified.
FIGURE 5.
FIGURE 5.
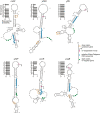
Long-range mRNA secondary structures in σA-dependent isoforms sequester sequence elements necessary for translation. MFE structures of transcripts for σA-dependent isoforms of other translationally activated σB regulon genes. The transcription start sites of σB-dependent isoforms (indicated with arrows), putative Shine–Dalgarno (SD) sequences, and start codons are highlighted in magenta, blue, and green, respectively. The stop codon of the upstream gene in the operon is indicated with an orange box. Computationally determined base-pairing probabilities for individual bases in the SD sequences are shown beside each structure.
FIGURE 6.
FIGURE 6.
Model for σB-dependent translational activation. Schematic of a polycistronic operon containing a σA-dependent promoter (PA), σB-dependent promoter (PB), coding sequences, and a terminator. (A) In the absence of σB, transcription from PA produces a polycistronic mRNA molecule containing secondary structures that translationally repress the σB-dependent open reading frame (red) by sequestering its Shine–Dalgarno sequence (blue) and start codon (green). (B) PB becomes transcriptionally active upon σB induction, generating an mRNA isoform with an alternative transcription start site (magenta). Without the sequences necessary to form stable secondary structures, these transcripts can recruit ribosomes more efficiently to facilitate greater protein expression.

Similar articles

Cited by

References

    1. Bastet L, Turcotte P, Wade JT, Lafontaine DA. 2018. Maestro of regulation: riboswitches orchestrate gene expression at the levels of translation, transcription and mRNA decay. RNA Biol 15: 679–682. 10.1080/15476286.2018.1451721 - DOI - PMC - PubMed
    1. Bhattacharyya S, Jacobs WM, Adkar B V, Yan J, Zhang W, Shakhnovich EI. 2018. Accessibility of the Shine-Dalgarno sequence dictates N-terminal codon bias in E. coli. Mol Cell 70: 894–905.e5. 10.1016/j.molcel.2018.05.008 - DOI - PMC - PubMed
    1. Boël G, Letso R, Neely H, Price WN, Wong KH, Su M, Luff JD, Valecha M, Everett JK, Acton TB, et al. 2016. Codon influence on protein expression in E. coli correlates with mRNA levels. Nature 529: 358–363. 10.1038/nature16509 - DOI - PMC - PubMed
    1. Borujeni AE, Cetnar D, Farasat I, Smith A, Lundgren N, Salis HM. 2017. Precise quantification of translation inhibition by mRNA structures that overlap with the ribosomal footprint in N-terminal coding sequences. Nucleic Acids Res 45: 5437–5448. 10.1093/nar/gkx061 - DOI - PMC - PubMed
    1. Bose B, Grossman AD. 2011. Regulation of horizontal gene transfer in Bacillus subtilis by activation of a conserved site-specific protease. J Bacteriol 193: 22–29. 10.1128/JB.01143-10 - DOI - PMC - PubMed

LinkOut - more resources