. 2021 Apr 27;22(9):4564.
doi: 10.3390/ijms22094564.

Microglia and Inhibitory Circuitry in the Medullary Dorsal Horn: Laminar and Time-Dependent Changes in a Trigeminal Model of Neuropathic Pain

Affiliations

Microglia and Inhibitory Circuitry in the Medullary Dorsal Horn: Laminar and Time-Dependent Changes in a Trigeminal Model of Neuropathic Pain

Nuria García-Magro et al. Int J Mol Sci. .

Abstract

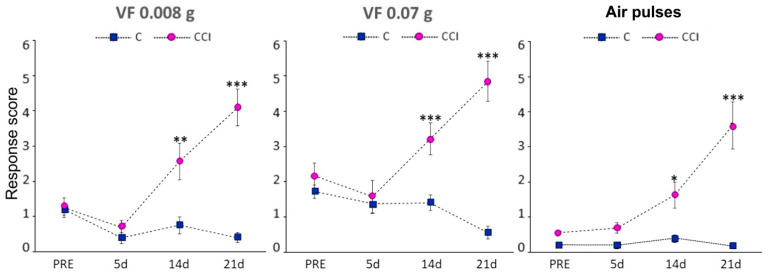
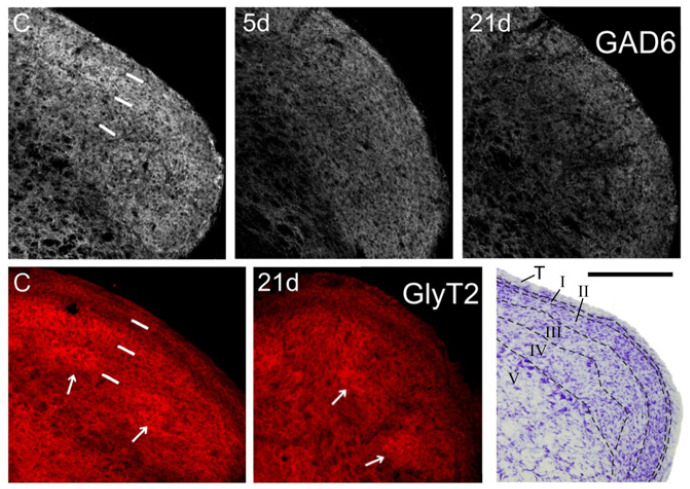
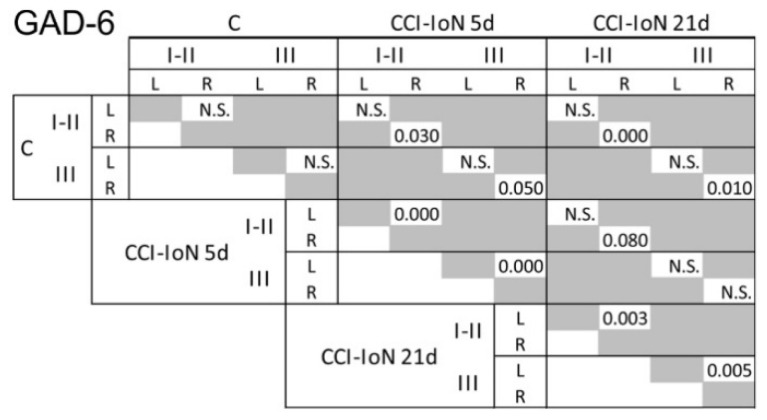
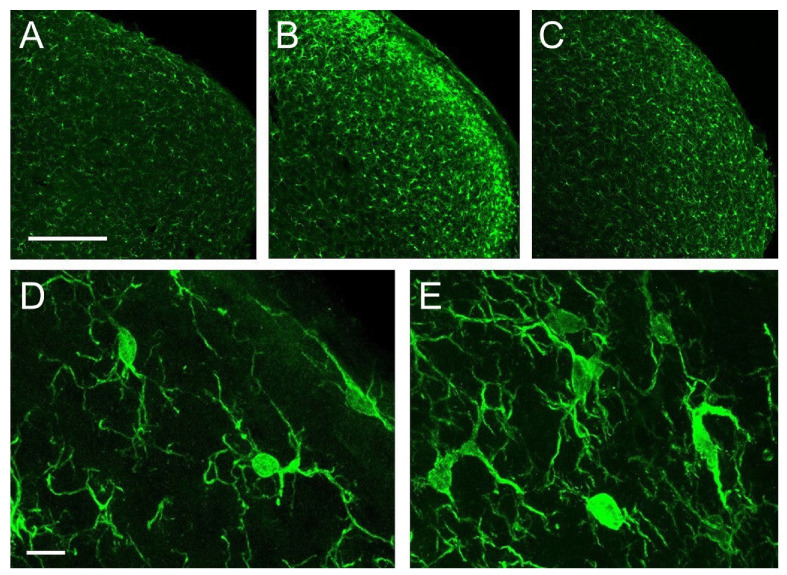
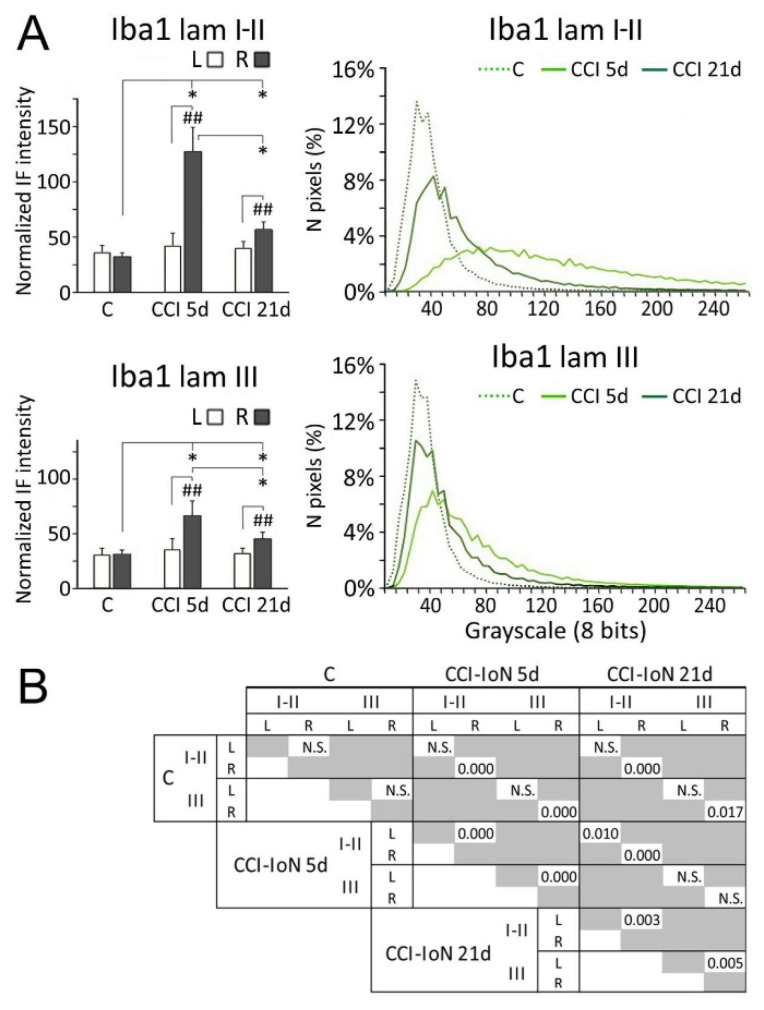
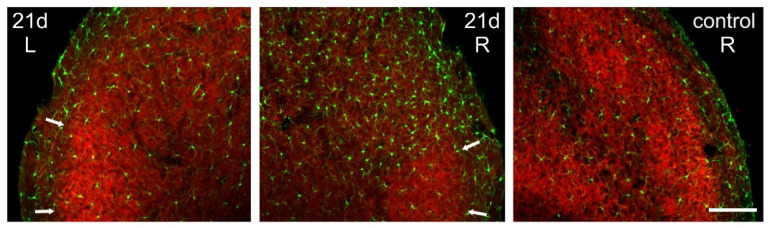
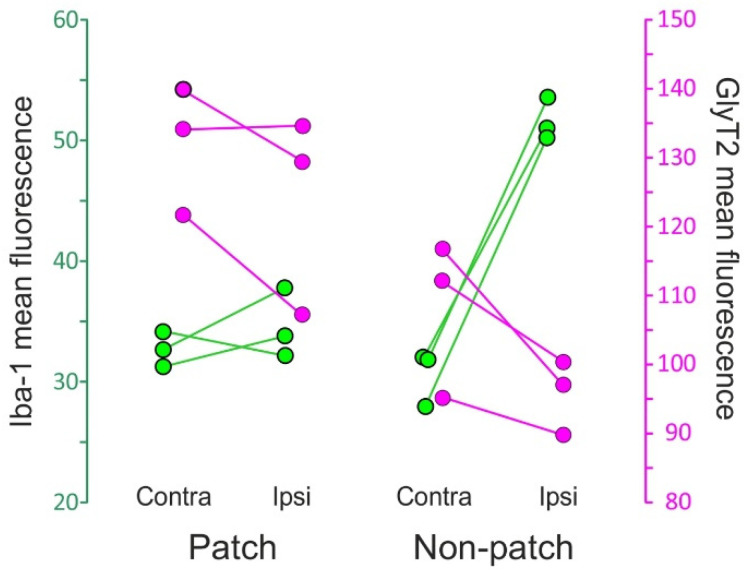
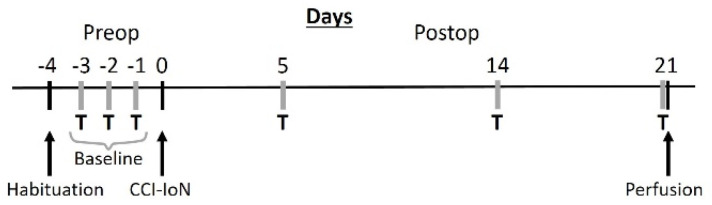
Craniofacial neuropathic pain affects millions of people worldwide and is often difficult to treat. Two key mechanisms underlying this condition are a loss of the negative control exerted by inhibitory interneurons and an early microglial reaction. Basic features of these mechanisms, however, are still poorly understood. Using the chronic constriction injury of the infraorbital nerve (CCI-IoN) model of neuropathic pain in mice, we have examined the changes in the expression of GAD, the synthetic enzyme of GABA, and GlyT2, the membrane transporter of glycine, as well as the microgliosis that occur at early (5 days) and late (21 days) stages post-CCI in the medullary and upper spinal dorsal horn. Our results show that CCI-IoN induces a down-regulation of GAD at both postinjury survival times, uniformly across the superficial laminae. The expression of GlyT2 showed a more discrete and heterogeneous reduction due to the basal presence in lamina III of 'patches' of higher expression, interspersed within a less immunoreactive 'matrix', which showed a more substantial reduction in the expression of GlyT2. These patches coincided with foci lacking any perceptible microglial reaction, which stood out against a more diffuse area of strong microgliosis. These findings may provide clues to better understand the neural mechanisms underlying allodynia in neuropathic pain syndromes.

Keywords: allodynia; chronic pain; glycine transporters; trigeminocervical complex.


Conflict of interest statement

The authors declare no conflict of interest. The funders had no role in the design of the study; in the collection, analyses, or interpretation of data; in the writing of the manuscript, or in the decision to publish the results.

Figures

Figure 1
Figure 1
Behavioral responses following CCI-IoN to stimulation of the whisker pad with 0.008 g or 0.07 g Von Frey filaments, or 10 psi air-puff pulses. The response score before surgery (PRE) represents the average of three consecutive testing days. At 14 and 21 postoperative days the response score differed significantly between operated (n = 6, right side, magenta circles) and control (n = 5, blue squares) cases. The latter included responses from both sides, because there were no left-right differences in these cases. Data represent means ± SEM. Significance is represented by *, ** and ***, corresponding to p < 0.05, p < 0.01 and p < 0.001, respectively (two-tailed Mann-Whitney test).
Figure 2
Figure 2
Coronal sections through the right Sp5C caudal to the obex showing immunofluorescence for GAD-6 (gray, top panels), and GlyT2 (red, bottom panels). GAD-6 expression fades in all laminae at 5 days post-operation (dpo; 5d), and decreases even further at 21 dpo, when the loss is more marked in the ventral 1/2 of the nucleus. Less obvious, but still noticeable is a heterogeneous decrease in GlyT2 expression, which affects mostly lamina II and, irregularly, lamina III in the ventral 1/2 of the nucleus (where afferents from the IoN dominate). Arrows point to some ‘patches’ with strong expression of GlyT2 in laminae III-IV, which persist after CCI-IoN. In control sections (C) short, white bars indicate the approximate boundaries between the trigeminal tract, laminae I-II, lamina III and lamina IV. These sections were among those used for densitometric measures. A Nissl-stained section (lower right corner) shows approximately the same level of Sp5C, with interlaminar boundaries marked by dashed lines. T, trigeminal tract. Scale bar = 500 µm.
Figure 3
Figure 3
Comparisons of densitometric measurements for GAD-6 (A) and GlyT2 (B) in laminae I-II (top panels) and III (bottom panels). Values for each molecule are represented as means ± SD of the normalized fluorescence intensity (histograms), and as the relative distribution of pixels in a grayscale between 0 (darkest) and 255 (brightest). Histograms show values for the contralateral (left, L) and ipsilateral (right, R) sides with respect to the CCI-IoN. Curves show values only for the right side in operated cases, and averages for R and L sides in control cases. C, controls; CCI 5d, operated animals, at 5 dpo; CCI 21d, operated animals, at 21 dpo. In histograms, * indicates statistical significance (p < 0.05) between groups, using hemispheres as sampling units (Mann-Whitney test, n = 4 in C and n = 6 in CCI-IoN cases). Differences between sides in each group were assessed by the Wilcoxon signed rank test using individual sections for pairwise comparisons (n = 12 in C and n = 18 in CCI-IoN cases; ## = p < 0.01). For statistical comparisons of pixel distributions, see Figure 4.
Figure 4
Figure 4
Results of the statistical comparisons (Kolmogorov-Smirnov D test, p-values) of densitometric curves for GAD-6 shown in Figure 2. Similar comparisons for GlyT2 did not show any significant difference between groups. N.S., not significant.
Figure 5
Figure 5
Confocal images of coronal sections of the trigeminocervical complex (TCC) at a caudal level of Sp5C immunolabeled for Iba-1. In controls (A,D) microglial cells showed a homogeneous distribution, relative low density, and a typical morphology of a ‘resting’ or ‘surveying’ state. CCI-IoN induced a potent microgliosis at 5 dpo (B), which decreased but still persisted at 21 dpo (C). Activated microglia (E) was typically characterized by an increase in the number of cells, which exhibit heterogeneous shapes and sizes, predominating those with larger and irregular somata, and an increased number of processes, including thicker protoplasmic expansions. Scale bars = 500 μm (AC) and 10 μm (D,E).
Figure 6
Figure 6
Comparisons of densitometric measurements for Iba-1 (A) in laminae I-II (top panels) and III (bottom panels). In histograms, * indicate statistical significance (p < 0.05) between groups, using hemispheres as sampling units (Mann-Whitney test, n = 4 in C and n = 6 in CCI-IoN cases). Differences between sides in each group were assessed by the Wilcoxon signed rank test using individual sections por pairwise comparisons (n = 12 in C and n = 18 in CCI-IoN cases; ## = p < 0.01). For statistical comparisons of pixel distributions, see Figure 4. The statistical comparisons (Kolmogorov-Smirnov D test) of densitometric curves are shown in (B).
Figure 7
Figure 7
Spatial correlation of microglial reaction to CCI-IoN with GlyT2 expression. The marked ipsilateral microgliosis at 5dpo (not shown) and 21dpo (right side, middle panel) was practically restricted to the zones of Sp5C exhibiting low expression of GlyT2, sparing the GlyT2-intense ‘patches’ in lamina III (arrows). Scale bar = 300 μm.
Figure 8
Figure 8
Dot plot of the immunofluorescence of Iba-1 (green) and GlyT2 (magenta) in lamina III of Sp5C from three CCI-IoN animals. Data represent mean values of 3 sections per case, separately for the GlyT2-strong ‘patches’ and the more moderately immunoreactive ‘non-patch’ zones. Scales are taken from grayscale densitometries with ImageJ (NIH, Bethesda, MD, USA). The diagram shows different combined effects of the nerve injury on each zone: in ‘patches’ the change in Iba-1 immunofluorescence in the side ipsilateral to the CCI is practically nil with respect to the contralateral side, while in ‘non-patch’ or ‘matrix’ zones a pronounced increase is observed. GlyT2, on the other hand, decreases in both zones, apparently more noticeably so in the ‘non-patch’ zones.
Figure 9
Figure 9
Schematic diagram of the experimental protocol. T, behavioral testing; CCI-IoN, constriction of the IoN.

Similar articles

Cited by

References

    1. Moore K.A., Kohno T., Karchewski L.A., Scholz J., Baba H., Woolf C.J. Partial Peripheral Nerve Injury Promotes a Selective Loss of GABAergic Inhibition in the Superficial Dorsal Horn of the Spinal Cord. J. Neurosci. 2002;22:6724–6731. doi: 10.1523/JNEUROSCI.22-15-06724.2002. - DOI - PMC - PubMed
    1. Martin Y.B., Malmierca E., Avendaño C., Nuñez A. Neuronal disinhibition in the trigeminal nucleus caudalis in a model of chronic neuropathic pain. Eur. J. Neurosci. 2010;32:399–408. doi: 10.1111/j.1460-9568.2010.07302.x. - DOI - PubMed
    1. Lee K.Y., Ratté S., Prescott S.A. Excitatory neurons are more disinhibited than inhibitory neurons by chloride dysregulation in the spinal dorsal horn. eLife. 2019;8:8. doi: 10.7554/eLife.49753. - DOI - PMC - PubMed
    1. Yaksh T.L. Behavioral and autonomic correlates of the tactile evoked allodynia produced by spinal glycine inhibition: Effects of modulatory receptor systems and excitatory amino acid antagonists. Pain. 1989;37:111–123. doi: 10.1016/0304-3959(89)90160-7. - DOI - PubMed
    1. Baba H., Ji R.R., Kohno T., Moore A.K., Ataka T., Wakai A., Okamoto M., Woolf C.J. Removal of GABAergic inhibition facilitates polysynaptic A fiber-mediated excitatory transmission to the superficial spinal dorsal horn. Mol. Cell. Neurosci. 2003;24:818–830. doi: 10.1016/S1044-7431(03)00236-7. - DOI - PubMed

MeSH terms

Substances