Review
. 2021 Apr 22;11(5):622.
doi: 10.3390/biom11050622.

Functional Interfaces, Biological Pathways, and Regulations of Interferon-Related DNA Damage Resistance Signature (IRDS) Genes

Affiliations
Review

Functional Interfaces, Biological Pathways, and Regulations of Interferon-Related DNA Damage Resistance Signature (IRDS) Genes

Monikaben Padariya et al. Biomolecules. .

Abstract

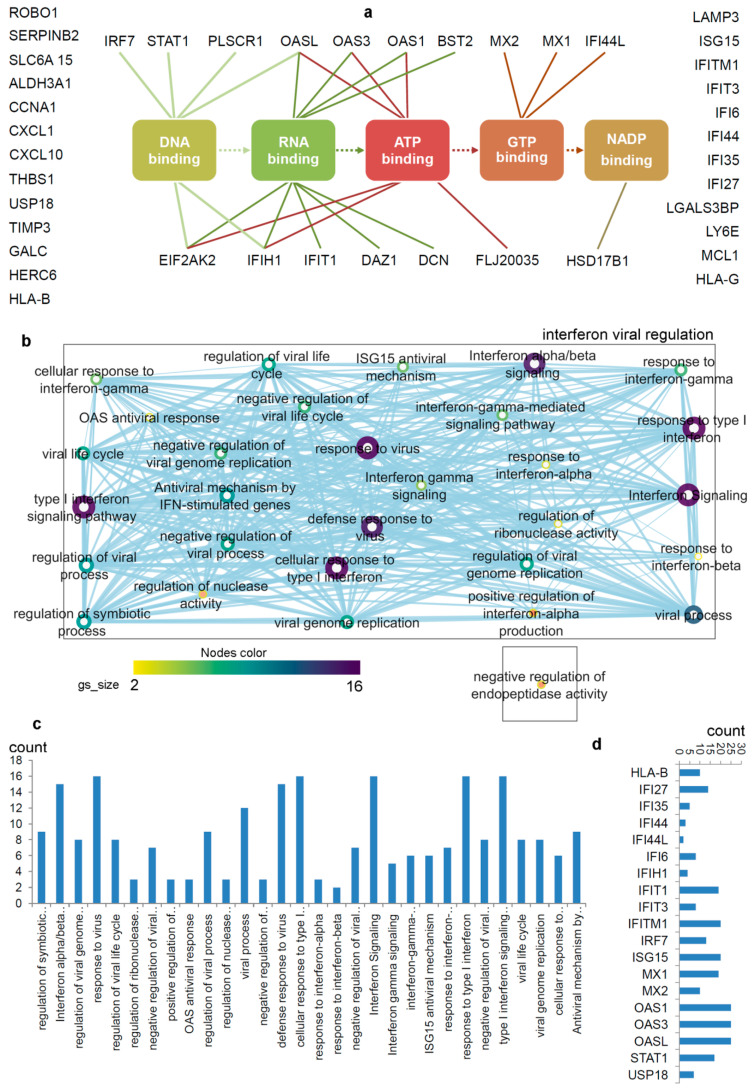
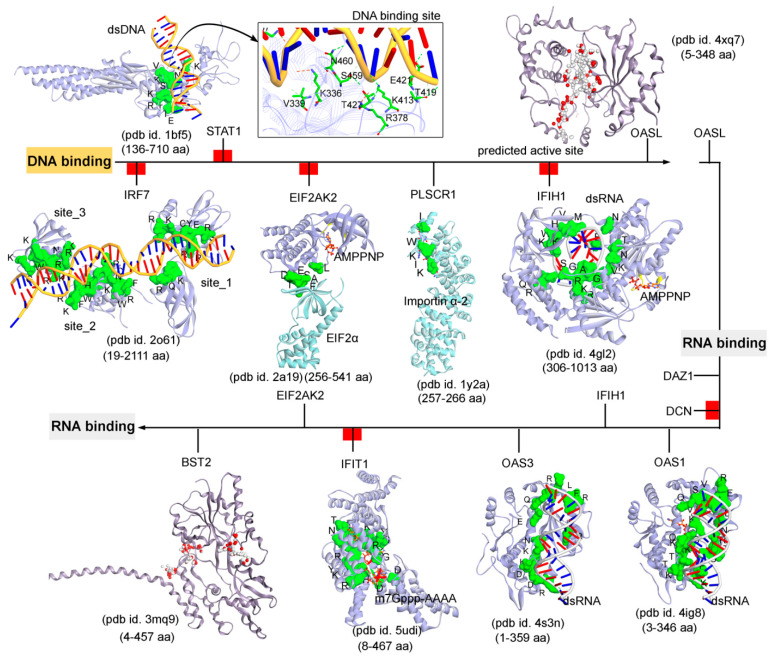
Interferon (IFN)-related DNA damage resistant signature (IRDS) genes are a subgroup of interferon-stimulated genes (ISGs) found upregulated in different cancer types, which promotes resistance to DNA damaging chemotherapy and radiotherapy. Along with briefly discussing IFNs and signalling in this review, we highlighted how different IRDS genes are affected by viruses. On the contrary, different strategies adopted to suppress a set of IRDS genes (STAT1, IRF7, OAS family, and BST2) to induce (chemo- and radiotherapy) sensitivity were deliberated. Significant biological pathways that comprise these genes were classified, along with their frequently associated genes (IFIT1/3, IFITM1, IRF7, ISG15, MX1/2 and OAS1/3/L). Major upstream regulators from the IRDS genes were identified, and different IFN types regulating these genes were outlined. Functional interfaces of IRDS proteins with DNA/RNA/ATP/GTP/NADP biomolecules featured a well-defined pharmacophore model for STAT1/IRF7-dsDNA and OAS1/OAS3/IFIH1-dsRNA complexes, as well as for the genes binding to GDP or NADP+. The Lys amino acid was found commonly interacting with the ATP phosphate group from OAS1/EIF2AK2/IFIH1 genes. Considering the premise that targeting IRDS genes mediated resistance offers an efficient strategy to resensitize tumour cells and enhances the outcome of anti-cancer treatment, this review can add some novel insights to the field.

Keywords: ATP; DNA; DNA damage; IRDS genes; RNA; chemotherapy and radiotherapy; functional site; interferon; protein interfaces; receptors; resistance; upstream regulator; viruses.


Conflict of interest statement

The authors declare no conflict of interest.

Figures

Figure 1
Figure 1
Type I, II, and III interferons (IFNs) signalling cascades, along with their tertiary structures retrieved from the Protein data bank (PDB) [7] database. Individual IFN receptors from the IFNAR1-IFNα2-IFNAR2 (pdb id. 3se4 [17]), IFNGR1-IFNγ-IFNGR2 (pdb id. 6e3l [18]), and IFNLR1-IFNλ3-IL10Rβ (pdb id. 5t5w [19]) complexes containing the extracellular topological domain (ETD), transmembrane domain (TMD) and cytoplasmic domain (CPD) are described with their amino acid range. Type I, II and III IFNs signal via distinct receptors IFNAR (composed of IFNAR1 and IFNAR2), IFNGR (IFNGR1 and IFNGR2) and IFNLR (INFLR1 and IL-10Rβ), respectively [20,21]. Upon the IFN binding to the receptor complex, JAK1 (Janus kinase 1) and TYK2 (tyrosine kinase 2) are activated by cross-phosphorylation within the cytoplasmic regions of the receptor, which then phosphorylate STAT1 and STAT2 (signal transducer and activator of transcription 1 and 2). STATs from various complexes migrate to the nucleus and binds the IFN-stimulated response elements (ISREs) or gamma-activated sequences (GASs), which leads to the activation of transcription of several genes involved in antiviral responses comprising ISGs, IFNs, IRFs and STATs [20,21]. Abbreviations: IFNAR, interferon alpha and beta receptor; IFNGR, interferon-gamma receptor; IFNLR, interferon lambda receptor; L10Rβ, interleukin 10 receptor Beta; aa, amino acids; P, phosphate; OASs, oligoadenylate synthases; GBPs, guanylate binding proteins; NOS2, nitric oxide synthase 2; IFITMs, IFN-induced transmembrane proteins; and TRIMs, tripartite motif proteins. Visualization and representation of the tertiary structures of IFNs and its associated receptors was performed using the BIOVIA Discovery Studio Visualizer (Dassault Systèmes, BIOVIA, San Diego, CA, USA), IFNs are shown in ribbon and its receptors as surface.
Figure 2
Figure 2
Differentiating IRDS genes considering their binding molecules, and associated significant biological pathways [71,74,75]. (a) A network describing IRDS genes involvement in binding with diverse biomolecules; DNA, RNA, ATP, GTP or NADP [77]. (b) Pathway enrichment analysis for the IRDS genes listed in the panel (a). The enrichment analysis was performed using g:Profiler [78,79], and as the following step, the networks were visualized using the “Enrichment Map” platform in the Cytoscape package [80]. Parameters for the pathway enrichment analysis in g:Profiler and Cytoscape were set as described in the protocol by Reimand et al. [79]. (c) The total number of IRDS genes involved in a particular pathway. (d) Frequency of IRDS genes occurring in different pathways that are identified in panel (c), and only genes with higher frequency are presented. For pathway analysis as shown in panel (b), the node size corresponds to the number of genes in the dataset/gene-set size, and colour of the node corresponds to the number of the geneset for the dataset. Edge size corresponds to the number of genes that overlap between two connected genesets. Intra- and interconnecting nodes means some genes are shared in clusters or pathways and, hence, they are represented as edges. In the cytoscape, following parameters were set for the plots: the chart data, Q-value (FDR) columns; and chart type, radial heat map (RdBu-3). The plots and networks between pathways for this figure were generated with the data retrieved from the Cytoscape program [80].
Figure 3
Figure 3
Upstream regulators from the IRDS genes, as well as a list of genes regulated by different IFN types (Type I/II/III). (a) IRDS genes (IRF7, STAT1, EIF2AK2, IFIH1, USP18 (ubiquitin specific peptidase 18), ISG15, DCN (decorin), IFIT1 and TIMP3) were found as the upstream regulators in QIAGEN-IPA analysis (Ingenuity Pathway analysis [https://digitalinsights.qiagen.com, accessed on: 7 April 2021]). Genes are presented in ascending order based on the p-values, and the bottom panel represents pathway enrichment analysis for upstream regulators performed using g:Profiler [78,79] and Cytoscape package [80]. The node size corresponds to the number of genes in the dataset/gene-set size, and colour of the node corresponds to the number of the geneset for the dataset. Edge size corresponds to the number of genes that overlap between two connected genesets. Intra- and interconnecting nodes means some genes are shared in clusters or pathways, and hence, they are represented as edges. (b) Different IRDS genes targeted by two major upstream regulators; IRF7 and STAT1. (c) Majority of the IRDS genes were found regulated by both IFNs Type I and II or by all three IFN types, whereas only a small amount of genes are regulated by a single type; Type II IFN. The pie chart is generated considering the experimental datasets from the Interferome database [81].
Figure 4
Figure 4
The functional binding sites for a set of IRDS genes with the DNA or RNA molecules. The crystal structures or experimentally derived complexes for the following IRDS genes from the PDB database [7] were analysed; STAT1 (pdb id. 1bf5 [91]), OASL (2’-5’-oligoadenylate synthetase like; pdb id. 4xq7 [92]), IRF7 (interferon regulatory factor 7; pdb id. 2o61 [93]), EIF2AK2 (Eukaryotic Translation Initiation Factor 2 Alpha Kinase 2; pdb id. 2a19 [94]), PLSCR1 (Phospholipid scramblase 1; pdb id. 1y2a [95]), IFIH1 (interferon-induced helicase C-domain-containing protein 1; pdb id. 4gl2 [96]), BST2 (bone marrow stromal cell antigen 2; pdb id. 3mq9 [97]), IFIT1 (interferon induced protein with tetratricopeptide repeats 1; pdb id. 5udi [98]), OAS3 (pdb id. 4s3n [99]), and OAS1 (pdb id. 4ig8 [100]). These DNA or RNA binding interfaces in IRDS genes were defined based on the amino acids involved in the hydrogen bond (h-bond, distance ≥ 3.5 Å) as well as in the pi-stacking (distance ≥ 5 Å) interactions. In addition, the upstream regulators are marked with red label (Figure 3a); IRF7, STAT1, EIF2AK2, IFIH1, DCN and IFIT1, differentiating them with the functional proteins (PLSCR1, OASL, OAS3, BST2 and DAZ1). Interacting residues of IRDS genes with its respective partner are presented in green surface view, with amino acids labeled in black. The DNA and RNA structures are coloured in orange and grey, respectively. For OASL and BST2, the alpha spheres (MOE; Chemical Computing Group Inc., Montreal, QC, Canada) are presented as either “hydrophobic” or “hydrophilic (for lone pair active; LPA)” in red and white colour. Visualization and representation of the protein tertiary structures in this figure, and tracing hydrogen bonds or pi interactions between two partners was performed using the Molecular Operating Environment (MOE; Chemical Computing Group Inc., Montreal, QC, Canada) and BIOVIA Discovery Studio Visualizer (Dassault Systèmes, BIOVIA, San Diego, CA, USA) software programs.
Figure 5
Figure 5
The ATP (adenosine triphosphate), GTP (guanosine triphosphate), or NADP (nicotinamide adenine dinucleotide phosphate) binding residues from a set of IRDS genes. Considering the known tertiary structures from the PDB database [7], the binding sites were defined for the following proteins; OAS1 (pdb id. 4ig8 [100]), EIF2AK2 (pdb id. 2a19 [94]), IFIH1 (pdb id. 4gl2 [96]), MX1 (pdb id. 4p4t [101]), MX2 (pdb id. 4whj [102]), and HSD17B1 (pdb id.1a27 [103]). The ATP, GTP or NADP interfaces were defined considering the amino acids involved in the hydrogen bond (h-bond, distance ≥ 3.5 Å) as well as in the pi-stacking (distance ≥ 5 Å) interactions. The upstream regulators EIF2AK2 and IFIH1 are marked in red label (Figure 3a), differentiating them with the other functional protein. Interacting residues of IRDS genes with its respective partner are presented in yellow surface view, with amino acids labelled in black. The ATP/GTP/NADP and dsRNA structures are coloured in orange and grey, respectively. Particularly for the MX2 gene, the active sites were predicted using the MOE program (Chemical Computing Group Inc., Montreal, QC, Canada), the alpha spheres are presented as either “hydrophobic” or “hydrophilic (for lone pair active; LPA)” in red and white colour. Visualization and representation of the protein tertiary structures for this figure, and tracing hydrogen bonds or pi interactions between two partners was performed using the MOE (Chemical Computing Group Inc., Montreal, QC, Canada) and BIOVIA Discovery Studio Visualizer (Dassault Systèmes, BIOVIA, San Diego, CA, USA) programs.

Similar articles

Cited by

References

    1. Deng L., Liang H., Fu S., Weichselbaum R.R., Fu Y.X. From DNA damage to nucleic acid sensing: A strategy to enhanceradiation therapy. Clin. Cancer Res. 2016;22:20–25. doi: 10.1158/1078-0432.CCR-14-3110. - DOI - PubMed
    1. Burnette B.C., Liang H., Lee Y., Chlewicki L., Khodarev N.N., Weichselbaum R.R., Fu Y.X., Auh S.L. The efficacy of radiotherapy relies upon induction of type i interferon-dependent innate and adaptive immunity. Cancer Res. 2011;71:2488–2496. doi: 10.1158/0008-5472.CAN-10-2820. - DOI - PMC - PubMed
    1. Lim J.Y., Gerber S.A., Murphy S.P., Lord E.M. Type I interferons induced by radiation therapy mediate recruitment and effector function of CD8(+) T cells. Cancer Immunol. Immunother. 2014;63:259–271. doi: 10.1007/s00262-013-1506-7. - DOI - PMC - PubMed
    1. Sarhan J., Liu B.C., Muendlein H.I., Weindel C.G., Smirnova I., Tang A.Y., Ilyukha V., Sorokin M., Buzdin A., Fitzgerald K.A., et al. Constitutive interferon signaling maintains critical threshold of MLKL expression to license necroptosis. Cell Death Differ. 2019;26:332–347. doi: 10.1038/s41418-018-0122-7. - DOI - PMC - PubMed
    1. Snyder A.G., Hubbard N.W., Messmer M.N., Kofman S.B., Hagan C.E., Orozco S.L., Chiang K., Daniels B.P., Baker D., Oberst A. Intra tumoral activation of the necroptotic pathway components RIPK1 and RIPK3 potentiates antitumor immunity. Sci. Immunol. 2019;4:eaaw2004. doi: 10.1126/sciimmunol.aaw2004. - DOI - PMC - PubMed

Publication types

MeSH terms