. 2021 Apr 9;10(4):854.
doi: 10.3390/cells10040854.

Direct Conjugation of NEDD8 to the N-Terminus of a Model Protein Can Induce Degradation

Affiliations

Direct Conjugation of NEDD8 to the N-Terminus of a Model Protein Can Induce Degradation

Kartikeya Vijayasimha et al. Cells. .

Abstract

While the role of ubiquitin in protein degradation is well established, the role of other ubiquitin-like proteins (UBLs) in protein degradation is less clear. Neural precursor cell expressed developmentally down-regulated protein 8 (NEDD8) is the UBL with the highest level of amino acids identified when compared to ubiquitin. Here we tested if the N-terminal addition of NEDD8 to a protein of interest could lead to degradation. Mutation of critical glycine residues required for normal NEDD8 processing resulted in a non-cleavable fusion protein that was rapidly degraded within the cells by both the proteasome and autophagy. Both degradation pathways were dependent on a functional ubiquitin-conjugation system as treatment with MLN7243 increased levels of non-cleavable NEDD8-GFP. The degradation of non-cleavable, N-terminal NEDD8-GFP was not due to a failure of GFP folding as different NEDD8-GFP constructs with differing abilities to fold and fluoresce were similarly degraded. Though the fusion of NEDD8 to a protein resulted in degradation, treatment of cells with MLN4924, an inhibitor of the E1 activating enzyme for NEDD8, failed to prevent degradation of other destabilized substrates. Taken together these data suggest that under certain conditions, such as the model system described here, the covalent linkage of NEDD8 to a protein substrate may result in the target proteins degradation.

Keywords: NEDD8; proteasome; protein degradation; ubiquitination.


Conflict of interest statement

The authors declare no conflict of interest.

Figures

Figure 1
Figure 1
Fusion of NEDD8 to GFP leads to decreased GFP in stably transfected cells. (A) Cartoon representation of the components of the constructs. During normal NEDD8 processing, UCH-L3 cleaves between the second and third glycine residues releasing the active NEDD8 molecule. NEDD8 fused to GFP should be cleaved in the same manner as the wildtype NEDD8 protein, however, mutation of the 3 glycine residues to alanine residues will result in a fusion protein where NEDD8 is bound, in a non-cleavable manner to GFP. (B) Each NEDD8-GFP construct was cloned into an IRES expression vector containing a Thy1.1 reporter DNA sequence. EL4 cells (dotted trace) were stably transfected with either wildtype and cleavable NEDD8-GFP (solid trace) or non-cleavable (NC) NEDD8-GFP constructs (shaded histograms). Each cell type was analyzed by flow cytometry for both Thy1.1 expression (top histogram) and GFP (bottom histogram). (C) Western blot analysis of EL4/NEDD8-GFP and EL4/NC NEDD8-GFP cell lysates. Following SDS-PAGE and blotting onto nitrocellulose, membranes were probed with either mouse monoclonal antibodies against GFP or rabbit poly-clonal antibodies against actin and appropriate secondary antibodies. (D) Two-color immunoblot of EL4/NEDD8-GFP and EL4/NC NEDD8-GFP cell lysates. After SDS-PAGE and blotting, nitrocellulose membranes were probed simultaneously with mouse monoclonal antibodies against GFP and rabbit polyclonal antibodies against NEDD8. Antigen-antibody complexes were detected using goat anti-rabbit IRDye 680 CW (red), and goat anti-mouse 800 CW (green) secondary antibodies. Yellow regions correspond to simultaneous fluorescence in both channels. All Western blot images were cropped to show relevant bands.
Figure 2
Figure 2
Half-life determination of the non-cleavable forms of NEDD8-GFP and NEDD8-OVA in EL4 cells. EL4 cells stably expressing model proteins were treated with CHX to prevent translation of new proteins. (A) Cell lysates of NC NEDD8-GFP were created at indicated times after CHX treatment and analyzed by Western blot analysis. (B) Single phase exponential decay analysis was used to calculate the half-life of NC NEDD8-GFP, after quantification of bands from Western blot. The mean half-life of GFP was calculated from three independent experiments to be 26.7± 1.6 min. (C,D) Cell lysates for EL4/NC NEDD8-OVA and EL4 cells stably expressing OVA alone were made at indicated times (after CHX treatment) and analyzed by Western blot. (E) Half-lives for NC NEDD8-OVA (black circles) and OVA-alone (white circles) were calculated as described before. The calculated half-life was 1 ± 0.1 h for NC NEDD8-OVA and 7.7 ± 1.3 h for OVA-alone. Data shown is from one of three independent experiments performed. Half-lives shown are mean values obtained from three independent experiments. All western blot images were cropped to show relevant bands.
Figure 3
Figure 3
Non-cleavable NEDD8-GFP undergoes proteasomal degradation in a NUB1-dependent process. EL4 cells stably expressing NC NEDD8-GFP were treated with the proteasomal inhibitors MG132 or epoxomicin (epo) for 3 h and checked for NEDD8-GFP accumulation. (A) Flow cytometric analysis for GFP fluorescence of cells after proteasomal inhibition are compared with mock-treated cells as a control. The MFI of GFP for the total cell population is reported on the y-axis. (B) Cell lysates of EL4/NC NEDD8-GFP cells treated with MG132 or epoxomicin were made and analyzed by Western blot using mouse monoclonal antibodies against GFP and p97 with appropriate secondary antibodies. (C) Western blot analysis of EL4/NC NEDD8-GFP cells transfected with either scrambled siRNA oligomers or siRNA targeting NUB1. Cell lysates were probed for either NUB1 (top panel) or p97 as a loading control (bottom panel). (D) EL4/NC NEDD8-GFP cells were transfected with scrambled or NUB1-targeting siRNAs and cultured with or without MG132. Cell lysates were examined by Western blot analysis for GFP. (E) GFP signal obtained by Western blot was quantified in three independent experiments and calculated as fold-increase over mock-treated cells. Error bars represent the standard error. (F) GFP levels were analyzed by Western blot analysis in EL4/NEDD8-GFP cells upon NUB1 loss. (G) EL4/SCRAP cells were transfected with NUB1-specific or scrambled siRNAs are analyzed by Western blot for GFP. As a control, EL4/SCRAP cells transfected with scrambled siRNAs were treated with MG132 prior to cell lysis. All Western blot images were cropped to show relevant bands.
Figure 4
Figure 4
Non-cleavable NEDD8-GFP undergoes autophagosomal degradation. (A) Western blot analysis of EL4/NC NEDD8-GFP cells following a 5-h treatment with autophagy inhibitors 3-MA or bafilomcyin. Cell lysates of NC EL4/NEDD8-GFP cells and NC EL4/NEDD8-GFP treated with inhibitors were made and analyzed by Western blot using mouse monoclonal antibodies against GFP and actin with appropriate secondary antibodies. (B) The average fold increase in GFP following autophagy inhibition was determined by Western blot analysis is reported for three independent experiments. (C) Flow cytometric analysis for GFP fluorescence of cells after autophagosomal inhibition are compared with mock-treated cells. (D) Western blot analysis of EL4/NC NEDD8-GFP cells after overnight treatment with 5mM NH4Cl treatment. (E) Western blot analysis of EL4/NC NEDD8-GFP cells transfected with either scrambled siRNA oligomers or siRNA targeting ATG7. Cell lysates were probed for either ATG7 (top panel) or p97 as a loading control (bottom panel). (F) EL4/NC NEDD8-GFP cells were transfected with scrambled or ATG7-targeting siRNAs and cultured with or without 3-MA. Cell lysates were examined by Western blot analysis for GFP. (G) GFP signal obtained by Western blot was quantified in three independent experiments. The increase of NC/NEDD8-GFP for each treatment is shown as the fold-increase increases over mock-treated control. Error bars represent the standard error. All Western blot images were cropped to show relevant bands.
Figure 5
Figure 5
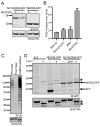
A functional ubiquitination system is required for NC NEDD8-GFP degradation. (A) EL4/NC NEDD8-GFP and EL4/NEDD8-GFP cells were treated with MLN7243 for 3 h to inactivate UBE1 preventing ubiquitination. Lysates were subjected to Western blot analysis for indicated proteins. (B) Western blot densitometry for GFP accumulation after treatment with MG132, Epoxomicin, 3MA, and MLN7243. GFP accumulation is shown as a fold increase over mock-treated cells. Values for MG132, Epoxomicin, and 3MA are from Figure 3 and Figure 4. (C) Western Blot analysis for poly-ubiquitinated proteins in EL4/NC NEDD8-GFP lysates prior to TUBES precipitation (labeled pre-clear), post-pull down (labeled post clear), and the TUBES precipitated proteins. Poly-ubiquitinated proteins were identified by staining with the ubiquitin-specific monoclonal antibody FK2. Actin (bottom panel) is shown as a control. (D) Poly-ubiquitinated proteins were isolated from EL4, EL4/NEDD8-GFP, and EL4/NC NEDD8-GFP cell lysates using TUBES and subjected to Western blot analysis with GFP monoclonal antibodies. Total cell lysates not subject to TUBES pull-down (labeled “-“) were compared to proteins eluted from TUBES (labeled “+”) and, in the case of NC NEDD8-GFP cell lysates, the remaining total cell lysate after removing poly-ubiquitinated proteins (labeled “post”). Bands corresponding to GFP and NC NEDD8-GFP are indicated. Bands marked by an asterisk (*) are contaminating bands reacting non-specifically to the presence of an antibody. All Western blot images were cropped to show relevant bands.
Figure 6
Figure 6
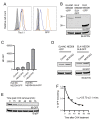
Fusion of NEDD8 to GFP prevents proper folding of GFP. (A) GFP fluorescence as determined by flow cytometry in EL4/NC NEDD8-GFP cells and EL4/SCRAP-GFP cells after treatment with chemical stabilizer (Shield-1 or MLN7243 respectively) for 3 h is shown. The average MFI of the cellular population from three independent measurements is reported on the y-axis. (B) Western blot analysis for GFP accumulation after treatment of EL4/NC NEDD8-GFP and EL4/SCRAP-GFP cells with their stabilizers, Shield-1 or MLN7243, respectively, for 3 h. (C) The ratio of fluorescent GFP signal obtained by flow cytometry (MFI GFP) to total GFP protein obtained by Western blot (WB Densitometry) for both SCRAP-GFP and NC NEDD8-GFP after treatment with stabilizer was calculated for three independent experiments and was statistically different (* p < 0.05). (D) Comparison of increased fluorescence of EL4/SCRAP-GFP cells and EL4/NC NEDD8-GFP cells after stabilizer treatment. Mean GFP fluorescence intensity of EL4/SCRAP-GFP cells (black circle), EL4/SCRAP-GFP cells treated with Shield-1 (blue circle) or MLN7243 (orange circle), and EL4/NC NEDD8-GFP (black triangle) and EL4/NC NEDD8-GFP treated with MLN7243 (orange triangle) were measured by flow cytometry at the indicated time points. (E) Representative Western blot of GFP standards with the concentration of recombinant GFP standard indicated. (F) Standard curve for the Western blot shown, (E) demonstrating the linearity of the signal determined by densitometry. (G) GFP fluorescence of E. coli expressing NC NEDD8-GFP (black trace), NEDD8-GFP (orange trace), GFP (blue trace), or empty cloning vector (shaded histogram) as determined by flow cytometry. (H) Western blot for GFP from the indicated cell lysates of E. coli from part (G) above. All Western blot images were cropped to show relevant bands.
Figure 7
Figure 7
Fluorescence of NC NEDD8-GFP can be rescued by the addition of an eight-amino acid linker peptide. The construct NC NEDD8-SL8-GFP contains an eight-amino acid sequence (SIINFEKL) inserted between the terminal residue of NEDD8 and GFP. (A) Stable EL4 cell lines expressing NC NEDD8-GFP(black trace), NC NEDD8-SL8-GFP (blue trace), or NEDD8-GFP (orange trace) were analyzed by flow cytometry for Thy1.1 expression (left histogram) or GFP (right histogram). EL4 parental cells are shown in the shaded histogram. (B) EL4 cells expressing the three NEDD8-GFP constructs were analyzed for total GFP protein by Western blot with antibodies specific for GFP. (C,D) EL4/NC NEDD8-GFP or EL4/NC NEDD8-SL8-GFP cells were treated with MLN7243 to prevent protein degradation for 2 h and analyzed for GFP fluorescence by flow cytometry (C) or for total GFP protein by Western blot (D). (E) EL4/NC NEDD8-SL8-GFP cells were treated with CHX and cell lysates created at indicated times. Lysates were measured for total GFP by Western blot. Single phase exponential decay analysis was used to calculate the half-life of NC NEDD8-SL8-GFP from three independent experiments (F). All Western blots are cropped to show relevant bands.
Figure 8
Figure 8
Ubiquitination, but not NEDDylation, is required for the rapid degradation of SCRAP-GFP. (A) EL4/SCRAP-GFP cells were treated with 2.5 μM Shield-1 overnight to allow accumulation of SCRAP-GFP. The cells were then washed, resuspended in fresh media, supplemented with either 10 μM MG132, 10 μM MLN7243, 10 μM MLN4924, or an equivalent volume of DMSO (mock), and incubated at 37 °C. GFP fluorescence was detected in each of the samples via flow cytometry every 1.5 h over 6 h and the MFI of the population reported. (B) Cell lysates of EL4 cells stably expressing NC NEDD8-GFP following a 3-h treatment with 10 μM MLN7243, 50 μM 3MA, and 10 μM MLN4924 were analyzed by Western blotting for GFP or p97. All Western blot images were cropped to show relevant bands.
Figure 9
Figure 9
NC NEDD8-GFP requires ubiquitination for degradation in MCF7 cells. (A) MCF7 cells stably transfected with either NEDD8-GFP (black trace) or NC NEDD8-GFP (orange trace) vectors were analyzed by flow cytometry for Thy1.1 expression (left panel) and fluorescent GFP (right panel) compared to the parental cells (shaded histogram). (B) MCF7/NC NEDD8-GFP and EL4/NEDD8-GFP cells were treated with MLN7243 for 3 h and cell lysates analyzed by Western blot analysis. All Western blot images were cropped to show relevant bands.

Similar articles

Cited by

References

    1. Sutton M.A., Schuman E.M. Dendritic Protein Synthesis, Synaptic Plasticity, and Memory. Cell. 2006;127:49–58. doi: 10.1016/j.cell.2006.09.014. - DOI - PubMed
    1. Cambridge S.B., Gnad F., Nguyen C., Bermejo J.L., Krüger M., Mann M. Systems-wide Proteomic Analysis in Mammalian Cells Reveals Conserved, Functional Protein Turnover. J. Proteome Res. 2011;10:5275–5284. doi: 10.1021/pr101183k. - DOI - PubMed
    1. Chiti F., Dobson C.M. Protein Misfolding, Amyloid Formation, and Human Disease: A Summary of Progress Over the Last Decade. Annu. Rev. Biochem. 2017;86:27–68. doi: 10.1146/annurev-biochem-061516-045115. - DOI - PubMed
    1. Gundersen V. Protein aggregation in Parkinson’s disease. Acta Neurol. Scand. 2010;122:82–87. doi: 10.1111/j.1600-0404.2010.01382.x. - DOI - PubMed
    1. Krobitsch S., Lindquist S. Aggregation of huntingtin in yeast varies with the length of the polyglutamine expansion and the expression of chaperone proteins. Proc. Natl. Acad. Sci. USA. 2000;97:1589–1594. doi: 10.1073/pnas.97.4.1589. - DOI - PMC - PubMed

Publication types

MeSH terms

LinkOut - more resources