. 2021 Apr 1;13(7):1648.
doi: 10.3390/cancers13071648.

Targeting p53 for Melanoma Treatment: Counteracting Tumour Proliferation, Dissemination and Therapeutic Resistance

Affiliations

Targeting p53 for Melanoma Treatment: Counteracting Tumour Proliferation, Dissemination and Therapeutic Resistance

Joana B Loureiro et al. Cancers (Basel). .

Abstract

Melanoma is the deadliest form of skin cancer, primarily due to its high metastatic propensity and therapeutic resistance in advanced stages. The frequent inactivation of the p53 tumour suppressor protein in melanomagenesis may predict promising outcomes for p53 activators in melanoma therapy. Herein, we aimed to investigate the antitumor potential of the p53-activating agent SLMP53-2 against melanoma. Two- and three-dimensional cell cultures and xenograft mouse models were used to unveil the antitumor activity and the underlying molecular mechanism of SLMP53-2 in melanoma. SLMP53-2 inhibited the growth of human melanoma cells in a p53-dependent manner through induction of cell cycle arrest and apoptosis. Notably, SLMP53-2 induced p53 stabilization by disrupting the p53-MDM2 interaction, enhancing p53 transcriptional activity. It also promoted the expression of p53-regulated microRNAs (miRNAs), including miR-145 and miR-23a. Moreover, it displayed anti-invasive and antimigratory properties in melanoma cells by inhibiting the epithelial-to-mesenchymal transition (EMT), angiogenesis and extracellular lactate production. Importantly, SLMP53-2 did not induce resistance in melanoma cells. Additionally, it synergized with vemurafenib, dacarbazine and cisplatin, and resensitized vemurafenib-resistant cells. SLMP53-2 also exhibited antitumor activity in human melanoma xenograft mouse models by repressing cell proliferation and EMT while stimulating apoptosis. This work discloses the p53-activating agent SLMP53-2 which has promising therapeutic potential in advanced melanoma, either as a single agent or in combination therapy. By targeting p53, SLMP53-2 may counteract major features of melanoma aggressiveness.

Keywords: drug resistance; melanoma; metastasis; p53; targeted therapy; tryptophanol-derived oxazoloisoindolinone.


Conflict of interest statement

One international patent protecting the compound disclosed in this manuscript has been filed by M.M.M. Santos and L. Saraiva. The funders had no role in the design of the study; in the collection, analyses, or interpretation of data; in the writing of the manuscript, or in the decision to publish the results. The other authors declare no conflict of interest.

Figures
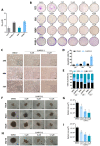
Figure 1
Figure 1
SLMP53-2 inhibits melanoma cell growth through induction of cell cycle arrest and apoptosis. (A) IC50 values of SLMP53-2 in A375, G361, MEWO and SK-MEL-5 melanoma cells obtained by colony formation assay for 11 days; data were normalized to DMSO and correspond to mean ± SEM, n = 5 (two replicates each). (B) Colony formation assay for A375, G361, MEWO and SK-MEL-5 melanoma cells treated with SLMP53-2 for the indicated concentrations. Images are representative of five independent experiments. (C) Effect of SLMP53-2 on growth and morphology of A375 cells for the indicated time points; images are representative of five independent experiments (scale bar  =  100 μm, magnification = ×100). (D) Apoptosis (Annexin V-positive cells) was evaluated in A375 cells after 24, 48 and 72 h of treatment with 12 μM SLMP53-2. (E) Cell cycle analysis in A375 cells was determined after 24, 48 and 72 h of treatment with 12 μM SLMP53-2. In (D,E), data are mean  ±  SEM, n = 5; values are significantly different from DMSO: * p < 0.05, one-way ANOVA followed by Tukey’s test. (F,G) Effect of SLMP53-2 on three-day-old A375 spheroids, for up to 8 days of treatment. In G, data are mean  ±  SEM, n = 5; values are significantly different from DMSO: * p < 0.05, one-way ANOVA followed by Tukey’s test. (H,I) Evaluation of spheroid formation after 10 days of treatment with SLMP53-2; treatment was performed at the seeding time of A375 cells. In I, data are mean  ±  SEM, n = 5; values are significantly different from DMSO: * p < 0.05, one-way ANOVA followed by Tukey’s test. In (F,H), images are representative of five independent experiments; scale bar = 100 μm; magnification = 100×.
Figure 2
Figure 2
SLMP53-2 has p53-dependent growth inhibitory effect in melanoma cells with enhancement of p53 transcriptional activity. (AC) Colony formation assay for silenced p53 (sip53) and control (CTRL) A375 cells treated with SLMP53-2, allowed to grow for 11 days. In (A), silencing efficacy of p53 by siRNA is shown; immunoblots are representative of five independent experiments and GAPDH was used as loading control; data plotted were normalized to CTRL and correspond to mean  ± SEM, n = 5; values are significantly different from CTRL: * p < 0.05, unpaired Student’s t-test. In (B), images are representative of five independent experiments. In (C), data are normalized to DMSO and correspond to mean ±  SEM, n = 5; values of sip53 cells significantly different from CTRL cells: * p < 0.05, two-way ANOVA followed by Sidak’s test. (D,E) Protein levels of p53 transcriptional targets in A375 cells treated with SLMP53-2 for 24 h (p53, MDM2, PTEN, Cyclin D1, p21 and KILLER) or 48 h (GADD45, PUMA, BCL-2, BCL-xL and BAX). In (D), immunoblots are representative of five independent experiments; GAPDH was used as loading control. In (E), quantification of protein expression levels is shown; values with DMSO were set as 1; data are mean  ±  SEM, n = 5. (F) mRNA levels of p53 target genes were determined by RT-qPCR in A375 cells after 24 h treatment with SLMP53-2; fold change is relative to DMSO; data are mean  ±  SEM, n = 5; values are significantly different from DMSO: * p < 0.05, two-way ANOVA with Dunnett’s multiple comparison test.
Figure 3
Figure 3
SLMP53-2 enhances p53 stabilization by disrupting the p53–MDM2 interaction and interferes with the miRNA network in melanoma cells. (A) p53 protein levels in A375 melanoma cells treated for 24 h with 12 µM SLMP53-2 or solvent followed by cycloheximide treatment from 0 to 2 h (CHX; 150 μg/mL). (B) Quantification of p53 protein expression levels; immunoblots are representative of five independent experiments; GAPDH was used as loading control. Values for cells nontreated with cycloheximide (0 h) were set as 1; data are mean  ±  SEM, n = 5. (C,D) Coimmunoprecipitation (Co-IP) was performed in A375 cells treated with SLMP53-2 for 4 h. In C, representative immunoblots of five independent experiments are shown—whole-cell lysate (Input). p53 from IP was used as loading control. In D, quantification of protein expression levels relative to DMSO is shown (set as 1). Data shown are mean ± SEM, n = 5. (E) Expression levels of miR-145 and miR-23a in A375 cells after 24 h of treatment with SLMP53-2 were determined by RT-qPCR; fold of change is relative to DMSO; data are mean  ±  SEM, n = 5; values are significantly different from DMSO: * p < 0.05, one-way ANOVA followed by Tukey’s test. (F,G) Protein levels of miR-145 target genes, in A375 cells treated with SLMP53-2 for 24 h. In (F), immunoblots are representative of five independent experiments; GAPDH was used as loading control. In (G), quantification of protein expression levels is shown; values with DMSO were set as 1; data are mean  ±  SEM, n = 5.
Figure 4
Figure 4
SLMP53-2 inhibits melanoma cell migration and invasion. (A) A375 and SK-MEL-5 confluent cells were treated with 2 or 4 μM SLMP53-2, respectively; cells were observed at 24 and 32 h (A375) and 30 and 48 h (SK-MEL-5) in the wound-healing assay. Images are representative of five independent experiments; scale bar = 100 μM; magnification = 100×. (B) Quantification of wound closure using randomly selected microscopic fields (six fields per sample). Data are mean ± SEM, n = 5; values are significantly different from DMSO: * p < 0.05, two-way ANOVA followed by Sidak’s test. (C) Effect of 2 μM SLMP53-2 on migration of A375 and SK-MEL-5 cells after 24 h of treatment. The relative number of migratory cells was determined by analysis of fluorescence signal intensity; values with DMSO were set as 1. Data are mean ± SEM, n = 5 (two replicates each); values are significantly different from DMSO: * p < 0.05, Student’s t-test. (D) Effect of 2 μM SLMP53-2 on the invasion of A375 and SK-MEL-5 cells after 24 h of treatment. Cells able to invade through an ECMatrix layer were quantified by fluorescence signal; values with DMSO were set as 1. Data are mean ± SEM, n = 5 (two replicates each); values are significantly different from DMSO: * p < 0.05, Student’s t-test. (E) Effect of SLMP53-2 on lactate secretion by A375 and SK-MEL-5 cells after 8 h of treatment. Cell density for each sample was used to normalize relative luminescence units (RLU) signal. Data are mean ± SEM, n = 5 (two replicates each); values are significantly different from DMSO: * p < 0.05; unpaired Student’s t-test.
Figure 5
Figure 5
SLMP53-2 interferes with key molecular players in epithelial-to-mesenchymal transition (EMT) and angiogenesis. (AD) Protein expression levels of crucial regulators of EMT and angiogenesis in A375 (A,B) and SK-MEL-5 (C,D) melanoma cells after 48 h of treatment with SLMP53-2 (in A375 cells, β-catenin was detected for 8 h and E-cadherin and TWIST for 24 h of treatment). Immunoblots are representative of five independent experiments; GAPDH was used as a loading control. In (B,D), quantification of protein expression levels is shown; values with DMSO were set as 1; data are means  ±  SEM, n = 5.
Figure 6
Figure 6
SLMP53-2 sensitizes melanoma cells to clinically used chemotherapeutic agents. (AC) Cells were treated with a concentration range of vemurafenib (A), dacarbazine (B) and cisplatin (C) alone and in combination with 2 μM SLMP53-2, for 48 h, and the growth was analysed by SBR assay. Growth with DMSO was set as 100%. For each combination, the combination index (C.I.) and dose reduction index (D.R.I.) values were obtained. Data are mean  ±  SEM, n = 5 (two replicates each); values are significantly different from chemotherapeutic drug alone: * p < 0.05; two-way ANOVA followed by Sidak’s test. (D) Apoptosis (Annexin V-positive cells) was evaluated in A375 cells after 48 h of treatment with 2 μM SLMP53-2 (SLMP) and 5 µM cisplatin and 0.03 µM vemurafenib. Data are mean  ±  SEM, n = 5; values are significantly different from drug alone: * p < 0.05, one-way ANOVA followed by Tukey’s test. (E,F) Protein expression levels of BCL-2 after 48 h of treatment of SLMP53-2 with cisplatin (cisp) and with vemurafenib (vem). Immunoblots are representative of five independent experiments; GAPDH was used as a loading control. In F, quantification of protein expression levels; values with DMSO were set as 1; data are mean  ±  SEM, n = 5. (G) Cell cycle analysis in A375 cells was determined after 48 h of treatment with 2 μM SLMP53-2 and 2 μM dacarbazine (Dac). Data are mean  ±  SEM, n = 5; values are significantly different from drug alone: * p < 0.05, one-way ANOVA followed by Tukey’s test. (H,I) Protein expression levels of p21 after 48 h treatment of SLMP53-2 with dacarbazine (Dac). Immunoblots are representative of five independent experiments; GAPDH was used as a loading control. In I, quantification of protein expression levels is shown; values with DMSO were set as 1; data are mean  ±  SEM, n = 5. (J,K) Effect of 2 μM SLMP53-2 in combination with 0.027 μM Vemurafenib (Vem) on three-day-old A375 spheroids for up to 8 days of treatment. For the combination, the C.I. value was obtained. Images are representative of five independent experiments; scale bar = 100 μm; magnification = 100×. In (K), data are mean  ±  SEM, n = 5; values are significantly different from DMSO: * p < 0.05, one-way ANOVA followed by Tukey’s test.
Figure 7
Figure 7
Melanoma cells do not develop resistance to SLMP53-2: vemurafenib-resistant melanoma cells show no cross-resistance to SLMP53-2 and are resensitized to vemurafenib by SLMP53-2. (A) A375 cells were exposed to six rounds of treatment with 6, 9, 12, 18, 24 and 30 μM of SLMP53-2. IC50 values were determined at the end of each round by SRB assay after 48 h of treatment. Data were normalized to DMSO and correspond to mean  ±  SEM, n = 5 (two replicates each); values not significantly different from parental cells: p > 0.05, two-way ANOVA followed by Sidak’s test. (B) Representative images of parental, vemurafenib-resistant (Vem-res) A375 cells; scale bar = 100 μm; magnification = 100×. (C) Concentration–response curves for vemurafenib in parental and Vem-res A375 cells after 48 h of treatment. Data were normalized to DMSO and correspond to mean  ±  SEM, n = 6 (two replicates each); values of Vem-res cells significantly different from parental cells: * p < 0.05; two-way ANOVA followed by Sidak’s test. (D,E) Protein levels of p-AKT/AKT, p-ERK/ERK, PTEN and MDR-1 in untreated parental and Vem-res A375 cells. In D, immunoblots are representative of five independent experiments; GAPDH was used as loading control. In E, quantification of protein expression levels is shown; values with DMSO were set as 1; data are mean  ±  SEM, n = 5. (F) Concentration–response curves for SLMP53-2 in parental and Vem-res A375 cells after 48 h of treatment. Data were normalized to DMSO and correspond to mean  ±  SEM, n = 6 (two replicates each); values of Vem-res cells are not significantly different from parental cells: two-way ANOVA followed by Sidak’s test. (G) Vem-res A375 cells were treated with a concentration range of vemurafenib alone and in combination with 2 μM of SLMP53-2. Cell growth was evaluated for 48 h of treatment; growth obtained with DMSO was set as 100%. For each combination, the C.I. and D.R.I. values were obtained. Data are mean ± SEM, n = 6 (two replicates each); values are significantly different from vemurafenib alone: * p < 0.05, two-way ANOVA followed by Sidak’s test. (H) Representative images of Vem-res A375 cells treated with DMSO, 2 μM SLMP53-2, 1.3 μM vemurafenib (Vem) and the combination (SLMP53-2 + Vem) for 48 h; images are representative of five treatments; scale bar = 100 μm; magnification = 100×. (I,J) Protein levels of PTEN, BCL-2, MDR-1 and p-AKT/AKT, in Vem-res cells after 48 h of treatment with 2 µM SLMP53-2. In I, immunoblots are representative of five independent experiments; GAPDH was used as loading control. In J, quantification of protein expression levels is shown; values with DMSO were set as 1; data are mean  ±  SEM, n = 5.
Figure 8
Figure 8
In vivo melanoma antitumour activity of SLMP53-2. C57BL/6-Rag2−/−IL2rg−/− mice carrying A375 xenografts were treated with 50 mg∙kg−1 SLMP53-2 or vehicle by intraperitoneal injection twice a week for a total of six administrations. (A) Tumour volume curves of mice carrying A375 xenografts treated with SLMP53-2 or vehicle. Fold change is relative to the start of treatments; data are mean ± SEM, n = 7; values are significantly different from vehicle: * p < 0.05, two-way ANOVA followed by Sidak’s test. (B) Tumour weights measured at the end of the in vivo experiment; data are mean ± SEM, n = 7; values are significantly different from vehicle: * p < 0.05, unpaired Student’s t-test. Representative images of the tumours treated with SLMP53-2 or vehicle at the end of the experiment. (C) Body weight of the mice registered during the course of the experiment. Data are mean ± SEM, n = 7; values are not significantly different from vehicle: p > 0.05, two-way ANOVA followed by Sidak’s test. (D) Weight of heart, spleen, kidney and livers from animals treated with SLMP53-2 or vehicle. Data are mean ± SEM, n = 7; values are not significantly different from vehicle: p > 0.05, two-way ANOVA followed by Sidak’s test. (E) Representative images of p53, Ki-67, BAX, BCL-2, TUNEL, β-catenin, Vimentin, and Slug detection in tumour tissues of A375 xenografts treated with SLMP53-2 or vehicle, collected at the end of treatment (scale bar = 5 μm; magnification = 200×); haematoxylin and eosin (H&E). (FH) Quantification of immunohistochemistry of A375 xenograft tumour tissues treated with SLMP53-2 or vehicle. In F, quantification of the number of Ki-67-positive and -negative cells; values are significantly different from vehicle: * p < 0.05, two-way ANOVA followed by Sidak’s test. In G, quantification of the percentage of positive-staining cells with TUNEL, n = 5; values are significantly different from vehicle: * p < 0.05, unpaired Student’s t-test. In H, quantification of the p53, Vimentin, BAX, BCL-2, β-catenin and Slug staining by evaluation of 3,3′-diaminobenzidine (DAB) intensity is shown, n = 5; values are significantly different from vehicle: * p < 0.05, unpaired Student’s t-test.

Similar articles

Cited by

References

    1. Domingues B., Lopes J., Soares P., Populo H. Melanoma treatment in review. Immunotargets. 2018;7:35–49. doi: 10.2147/ITT.S134842. - DOI - PMC - PubMed
    1. Ferlay J., Ervik M., Lam F., Colombet M., Mery L., Piñeros M., Znaor A., Soerjomataram I., Bray F. Global Cancer Observatory: Cancer Today. [(accessed on 25 May 2020)]; Available online: https://gco.iarc.fr/today.
    1. Paluncic J., Kovacevic Z., Jansson P.J., Kalinowski D., Merlot A.M., Huang M.L.H., Lok H.C., Sahni S., Lane D.J.R., Richardson D.R. Roads to melanoma: Key pathways and emerging players in melanoma progression and oncogenic signaling. Biochim. Biophys. Acta Mol. Cell. Res. 2016;1863:770–784. doi: 10.1016/j.bbamcr.2016.01.025. - DOI - PubMed
    1. Shtivelman E., Davies M.A., Hwu P., Yang J., Lotem M., Oren M., Flaherty K.T., Fisher D.E. Pathways and therapeutic targets in melanoma. Oncotarget. 2014;5:1701–1752. doi: 10.18632/oncotarget.1892. - DOI - PMC - PubMed
    1. Kim G., McKee A.E., Ning Y.-M., Hazarika M., Theoret M., Johnson J.R., Xu Q.C., Tang S., Sridhara R., Jiang X., et al. FDA approval summary: Vemurafenib for treatment of unresectable or metastatic melanoma with the BRAFV600E mutation. Clin. Cancer Res. Off. J. Am. Assoc. Cancer Res. 2014;20:4994–5000. doi: 10.1158/1078-0432.CCR-14-0776. - DOI - PubMed