Regulatory role of non-coding RNA in ginseng rusty root symptom tissue
- PMID: 33911151
- PMCID: PMC8080638
- DOI: 10.1038/s41598-021-88709-3
Regulatory role of non-coding RNA in ginseng rusty root symptom tissue
Abstract
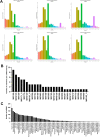
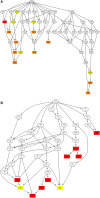
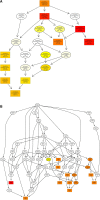
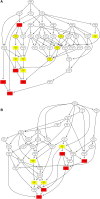
Ginseng rusty root symptom (GRS) is one of the primary diseases of ginseng. It leads to a severe decline in the quality of ginseng and significantly affects the ginseng industry. The regulatory mechanism of non-coding RNA (ncRNA) remains unclear in the course of disease. This study explored the long ncRNAs (lncRNAs), circular RNAs (circRNAs), and microRNAs (miRNAs) in GRS tissues and healthy ginseng (HG) tissues and performed functional enrichment analysis of the screened differentially expressed ncRNAs. Considering the predictive and regulatory effects of ncRNAs on mRNAs, we integrated ncRNA and mRNA data to analyze and construct relevant regulatory networks. A total of 17,645 lncRNAs, 245 circRNAs, and 299 miRNAs were obtained from HG and GRS samples, and the obtained ncRNAs were characterized, including the classification of lncRNAs, length and distribution of circRNA, and the length and family affiliations of miRNAs. In the analysis of differentially expressed ncRNA target genes, we found that lncRNAs may be involved in the homeostatic process of ginseng tissues and that lncRNAs, circRNAs, and miRNAs are involved in fatty acid-related regulation, suggesting that alterations in fatty acid-related pathways may play a key role in GRS. Besides, differentially expressed ncRNAs play an essential role in regulating transcriptional translation processes, primary metabolism such as starch and sucrose, and secondary metabolism such as alkaloids in ginseng tissues. Finally, we integrated the correlations between ncRNAs and mRNAs, constructed corresponding interaction networks, and identified ncRNAs that may play critical roles in GRS. These results provide a basis for revealing GRS's molecular mechanism and enrich our understanding of ncRNAs in ginseng.
Conflict of interest statement
The authors declare no competing interests.
Figures








Similar articles
-
Metabolome and transcriptome analysis reveals the molecular profiles underlying the ginseng response to rusty root symptoms.BMC Plant Biol. 2021 May 13;21(1):215. doi: 10.1186/s12870-021-03001-w. BMC Plant Biol. 2021. PMID: 33985437 Free PMC article.
-
A transcriptomic profile of topping responsive non-coding RNAs in tobacco roots (Nicotiana tabacum).BMC Genomics. 2019 Nov 14;20(1):856. doi: 10.1186/s12864-019-6236-6. BMC Genomics. 2019. PMID: 31726968 Free PMC article.
-
Time-Course Transcriptome Analysis Reveals Resistance Genes of Panax ginseng Induced by Cylindrocarpon destructans Infection Using RNA-Seq.PLoS One. 2016 Feb 18;11(2):e0149408. doi: 10.1371/journal.pone.0149408. eCollection 2016. PLoS One. 2016. PMID: 26890788 Free PMC article.
-
Non-Coding RNA Networks in Pulmonary Hypertension.Front Genet. 2021 Nov 30;12:703860. doi: 10.3389/fgene.2021.703860. eCollection 2021. Front Genet. 2021. PMID: 34917122 Free PMC article. Review.
-
Interactions Among Regulatory Non-coding RNAs Involved in Cardiovascular Diseases.Adv Exp Med Biol. 2020;1229:79-104. doi: 10.1007/978-981-15-1671-9_4. Adv Exp Med Biol. 2020. PMID: 32285406 Review.
Cited by
-
Analysis of gene expression profiles in two spinal cord injury models.Eur J Med Res. 2022 Aug 23;27(1):156. doi: 10.1186/s40001-022-00785-x. Eur J Med Res. 2022. PMID: 35999613 Free PMC article.
-
Abiotic stress tolerance in plants: a fascinating action of defense mechanisms.3 Biotech. 2023 Mar;13(3):102. doi: 10.1007/s13205-023-03519-w. Epub 2023 Feb 27. 3 Biotech. 2023. PMID: 36866326 Free PMC article. Review.
-
Chromosome-scale genome assembly of Astragalus membranaceus using PacBio and Hi-C technologies.Sci Data. 2024 Oct 2;11(1):1071. doi: 10.1038/s41597-024-03852-6. Sci Data. 2024. PMID: 39358417 Free PMC article.
-
Identification, biogenesis, function, and mechanism of action of circular RNAs in plants.Plant Commun. 2023 Jan 9;4(1):100430. doi: 10.1016/j.xplc.2022.100430. Epub 2022 Sep 7. Plant Commun. 2023. PMID: 36081344 Free PMC article. Review.
-
The Characters of Non-Coding RNAs and Their Biological Roles in Plant Development and Abiotic Stress Response.Int J Mol Sci. 2022 Apr 8;23(8):4124. doi: 10.3390/ijms23084124. Int J Mol Sci. 2022. PMID: 35456943 Free PMC article. Review.
References
-
- Wu L, Zhao Y, Guan Y, Pang S. A review on studies of the reason and control methods of succession cropping obstacle of Panax ginseng CA Mey. Spec. Wild Econ. Anim. Plant Res. 2008;2:68–72.
Publication types
MeSH terms
Substances
LinkOut - more resources
Full Text Sources
Other Literature Sources

