. 2022 May;55(9-10):2474-2490.
doi: 10.1111/ejn.15256. Epub 2021 May 14.

Disarranged neuroplastin environment upon aging and chronic stress recovery in female Sprague Dawley rats

Affiliations

Disarranged neuroplastin environment upon aging and chronic stress recovery in female Sprague Dawley rats

Marta Balog et al. Eur J Neurosci. 2022 May.

Abstract

Chronic stress produces long-term metabolic changes throughout the superfamily of nuclear receptors, potentially causing various pathologies. Sex hormones modulate the stress response and generate a sex-specific age-dependent metabolic imprint, especially distinct in the reproductive senescence of females. We monitored chronic stress recovery in two age groups of female Sprague Dawley rats to determine whether stress and/or aging structurally changed the glycolipid microenvironment, a milieu playing an important role in cognitive functions. Old females experienced memory impairment even at basal conditions, which was additionally amplified by stress. On the other hand, the memory of young females was not disrupted. Stress recovery was followed by a microglial decrease and an increase in astrocyte count in the hippocampal immune system. Since dysfunction of the brain immune system could contribute to disturbed synaptogenesis, we analyzed neuroplastin expression and the lipid environment. Neuroplastin microenvironments were explored by analyzing immunofluorescent stainings using a newly developed Python script method. Stress reorganized glycolipid microenvironment in the Cornu Ammonis 1 (CA1) and dentate gyrus (DG) hippocampal regions of old females but in a very different fashion, thus affecting neuroplasticity. The postulation of four possible neuroplastin environments pointed to the GD1a ganglioside enrichment during reproductive senescence of stressed females, as well as its high dispersion in both regions and to GD1a and GM1 loss in the CA1 region. A specific lipid environment might influence neuroplastin functionality and underlie synaptic dysfunction triggered by a combination of aging and chronic stress.

Keywords: GD1a; GM1; hippocampus; neurodegeneration; neuroinflammation; reproductive senescence.


Conflict of interest statement

The authors have no conflict of interest to declare.

Figures

FIGURE 1
FIGURE 1
Chronic stress protocol scheme. Study included two experimental (stress) age groups (N = 10)—young (3.5 months old) and old (12 months old) female rats, with appropriate control groups (sham stress). The protocol lasted 10 weeks
FIGURE 2
FIGURE 2
Effect of chronic stress and aging on memory impairment in young and old female rats assessed with a passive avoidance test at the end of the study. The latency to enter the dark compartment 24 hr following the initial training (when foot‐shock was applied) was recorded for 180 s. If the rats did not enter the dark compartment for 180 s, the successful acquisition of passive avoidance response was recorded. The results are shown as latencies (seconds) in a cumulative incidence plot. Statistical analysis was performed using a Cox regression modeling (table) and chi‐square test for comparison of the two old groups. Statistical significance between control and stressed old females is marked with an asterisk. Abbreviations: CI, confidence interval; OF‐C, control group of old females; OF‐S, stressed group of old females; YF‐C, control group of young females; YF‐S, stressed group of young females
FIGURE 3
FIGURE 3
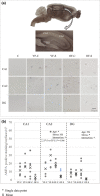
The quantitative and qualitative analysis of Iba1 positive cells in the CA1 and DG hippocampal regions in young and old female rats upon chronic stress. Iba1‐positive staining (measured as integrated density value) is shown in (a). Microglia cell number decreased in both young and old stressed females in the CA1 and DG, but no statistical significance was reached (b). Image inserts are shown in (c). Significant main effects and their interaction are marked as follows: *p < 0.05, ***p < 0.001. Significant difference between the groups is marked by a § symbol, and the exact P‐value is indicated. Abbreviations: C, negative control reaction; CA1, Cornu Ammonis subfield 1; DG, dentate gyrus; Iba1, ionized calcium binding adaptor molecule 1; NS, nonsignificant; OF‐C, control group of old females; OF‐S, stressed group of old females; YF‐C, control group of young females; YF‐S, stressed group of young females
FIGURE 4
FIGURE 4
The quantitative analysis of glial fibrillary acidic protein (GFAP)‐positive cells in the CA1 and DG hippocampal regions of young and old female rats upon chronic stress. Cell count for the astrocyte positive cells was analyzed in two hippocampal regions, CA1 and DG (a). Image inserts are shown in (b). Statistical analysis was performed using a two‐way analysis of variance (ANOVA). Bonferroni correction was used for post hoc comparisons. Significant main effects and their interaction are marked as *p < 0.05, ***p < 0.001. Significant difference between groups in the DG region is marked by a § symbol, and the exact P‐value is indicated. Abbreviations: C, negative control reaction; CA1, Cornu Ammonis subfield 1; DG, dentate gyrus; GFAP, glial fibrillary acidic protein; NS, nonsignificant; OF‐C, control group of old females; OF‐S, stressed group of old females; YF‐C, control group of young females; YF‐S, stressed group of young females
FIGURE 5
FIGURE 5
AMPA‐R immunoreactivity in the hippocampal CA1, CA2 and DG regions in female rats in response to chronic stress and aging. (a) AMPA‐R immunoreactivity was analyzed in three hippocampal regions by free‐floating immunohistochemistry. (b) Statistical analysis was performed using a two‐way analysis of variance (ANOVA). Bonferroni correction was used for post hoc comparisons. Significant effects of age or stress and their interaction are marked as *p < 0.05. A significant difference between groups in the CA2 region is marked by a ‡ symbol, and the exact P‐value is indicated. Abbreviations: AMPA‐R, AMPA‐receptor; C, negative control reaction; CA1, Cornu Ammonis subfield 1; CA2, Cornu Ammonis subfield 2; DG, dentate gyrus; NS, nonsignificant; OF‐C, control group of old females; OF‐S, stressed group of old females; YF‐C, control group of young females; YF‐S, stressed group of young females
FIGURE 6
FIGURE 6
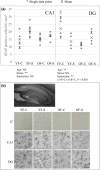
The quantitative analysis of APP expression in the CA1 and DG hippocampal regions of young and old stressed female rats. Image inserts are shown in (a). Immunofluorescent staining was analyzed using integrated density values for APP in the CA1 (B, on the left) and DG (b, on the right). Statistical analysis was performed using a two‐way analysis of variance (ANOVA). Bonferroni correction was used for post hoc comparisons. Significant effects of age or stress and their interaction are marked as *p < 0.05, ***p < 0.001. Abbreviations: APP, amyloid precursor protein; CA1, Cornu Ammonis subfield 1; DG, dentate gyrus; NS, nonsignificant; OF‐C, control group of old females; OF‐S, stressed group of old females; YF‐C, control group of young females; YF‐S, stressed group of young females
FIGURE 7
FIGURE 7
Age‐specific changes in GM1, GD1a, and neuroplastin expression upon chronic stress in the CA1 hippocampal region. Immunofluorescent staining was analyzed using the shares of single molecules: GD1a, GM1 and Np65; double colocalizations: GD1a/Np65, GM1/Np65, GD1a/GM1; and triple colocalization in absolute pixel counts for all four animal groups. The average ratio of pixel count is shown for each single or combination profile. The Venn diagram defines the expression of combination profiles. Statistical analysis was performed using a two‐way analysis of variance (ANOVA) and is shown in Table 1. Abbreviations: CA1, Cornu Ammonis subfield 1; GD1a, ganglioside GD1a; GM1, ganglioside GM1 visualized by cholera toxin beta subunit; NS, nonsignificant; Np65, neuroplastin; OF‐C, control group of old females; OF‐S, stressed group of old females; YF‐C, control group of young females; YF‐S, stressed group of young females
FIGURE 8
FIGURE 8
Age‐specific changes in GM1, GD1a, and neuroplastin expression upon chronic stress in the DG hippocampal region. Immunofluorescent staining was analyzed using the shares of single molecules: GD1a, GM1, and Np65; double colocalizations: GD1a/Np65, GM1/Np65, GD1a/GM1; and triple colocalization in absolute pixel counts for all four animal groups. The average ratio of pixel count is shown for each single or combination profile. The Venn diagram defines the expression of combination profiles. Statistical analysis was performed using a two‐way analysis of variance (ANOVA) and is shown in Table 2. Abbreviations: CA1, Cornu Ammonis subfield 1; GD1a, ganglioside GD1a; GM1, ganglioside GM1 visualized by cholera toxin beta subunit; NS, nonsignificant; Np65, neuroplastin; OF‐C, control group of old females; OF‐S, stressed group of old females; YF‐C, control group of young females; YF‐S, stressed group of young females
FIGURE 9
FIGURE 9
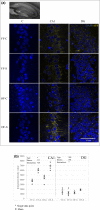
Immunofluorescent 3D reconstruction of the hippocampal CA1 (a) and DG (b) regions stained with Np65 and GM1 in young and old stressed female rats. The CA1 and DG hippocampal regions were reconstructed using confocal microscopy. Sagittal sections from the triple staining (Np65/GD1a/GM1) were used. For the reconstruction, two channels were used because of the confocal microscope limitations, so Np65/GM1 colocalization was analyzed. The colocalization of both markers in different z‐sections was 3D‐assembled by confocal microscopy at 40× (oil immersion). Np65 is stained magenta, GM1 is stained green, while nuclei are blue. Abbreviations: GM1, ganglioside GM1 visualized by cholera toxin beta subunit; Np65, neuroplastin; OF‐C, control group of old females; OF‐S, stressed group of old females; YF‐C, control group of young females; YF‐S, stressed group of young females
FIGURE 10
FIGURE 10
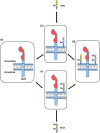
Possible ganglioside membrane environments of neuroplastin in the CA1 and DG hippocampal regions based on GD1a/GM1/Np65 analysis. Four possible membrane environments were postulated: (a) Neuroplastin can stand alone. It could be localized in an environment rich in GM1 (b), GD1a (c), or both gangliosides (d). Abbreviations: GD1a, ganglioside GD1a; GM1, ganglioside GM1; Np65, neuroplastin

Similar articles

Cited by

References

    1. Aisen, P. S. , Davis, K. L. , Berg, J. D. , Schafer, K. , Campbell, K. , Thomas, R. G. , Weiner, M. F. , Farlow, M. R. , Sano, M. , Grundman, M. , & Thal, L. J. (2000). A randomized controlled trial of prednisone in Alzheimer's disease. Neurology, 54(3), 588. 10.1212/wnl.54.3.588 - DOI - PubMed
    1. Ali, S. A. , Begum, T. , & Reza, F. (2018). Hormonal influences on cognitive function. The Malaysian Journal of Medical Sciences, 25(4), 31–41. 10.21315/mjms2018.25.4.3 - DOI - PMC - PubMed
    1. An, G. H. , Chen, X. W. , Li, C. , Zhang, L. I. , Wei, M. F. , Chen, J. J. , Ma, Q. , Yang, D. F. , & Wang, J. (2020). Pathophysiological changes in female rats with estrous cycle disorder induced by long‐term heat stress. BioMed Research International, 2020, 4701563. 10.1155/2020/4701563 - DOI - PMC - PubMed
    1. Balog, M. , Miljanović, M. , Blažetić, S. , Labak, I. , Ivić, V. , Viljetić, B. , & Heffer, M. (2015). Sex‐specific chronic stress response at the level of adrenal gland modified sexual hormone and leptin receptors. Croatian Medical Journal, 56(2), 104–113. 10.3325/cmj.2015.56.104 - DOI - PMC - PubMed
    1. Barth, A. M. , Domonkos, A. , Fernandez‐Ruiz, A. , Freund, T. F. , & Varga, V. (2018). Hippocampal network dynamics during rearing episodes. Cell Reports, 23(6), 1706–1715. 10.1016/j.celrep.2018.04.021 - DOI - PMC - PubMed

Publication types