. 2021 Apr 27:10:e65537.
doi: 10.7554/eLife.65537.

Widespread premature transcription termination of Arabidopsis thaliana NLR genes by the spen protein FPA

Affiliations

Widespread premature transcription termination of Arabidopsis thaliana NLR genes by the spen protein FPA

Matthew T Parker et al. Elife. .

Abstract

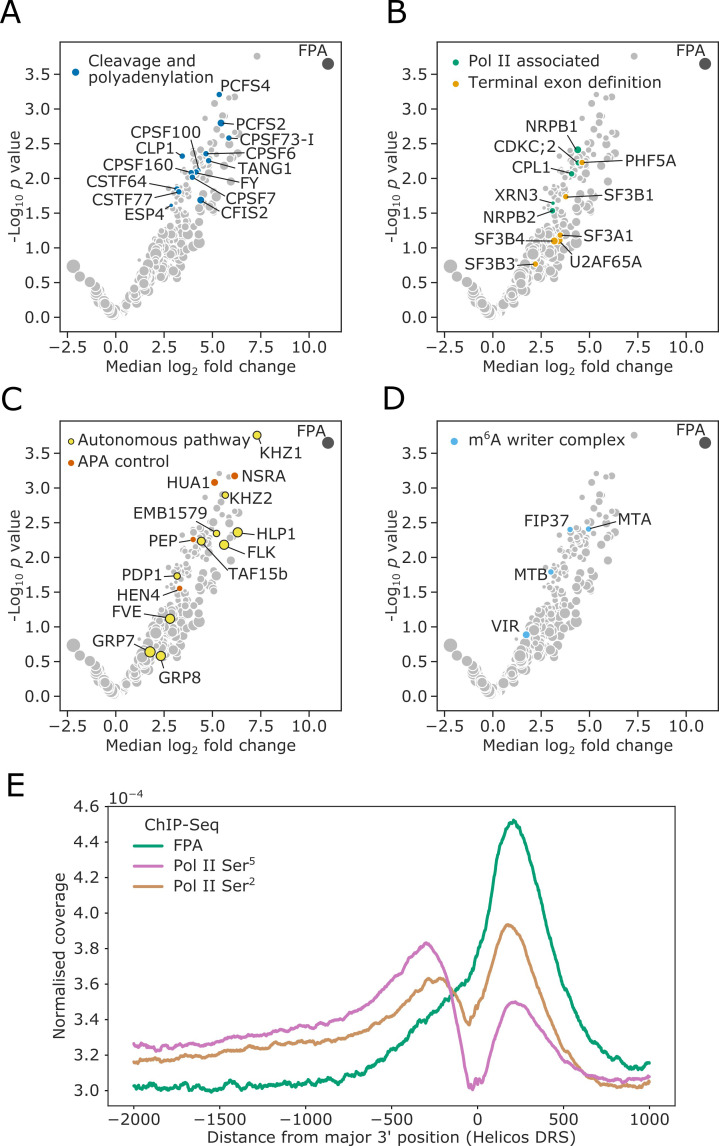
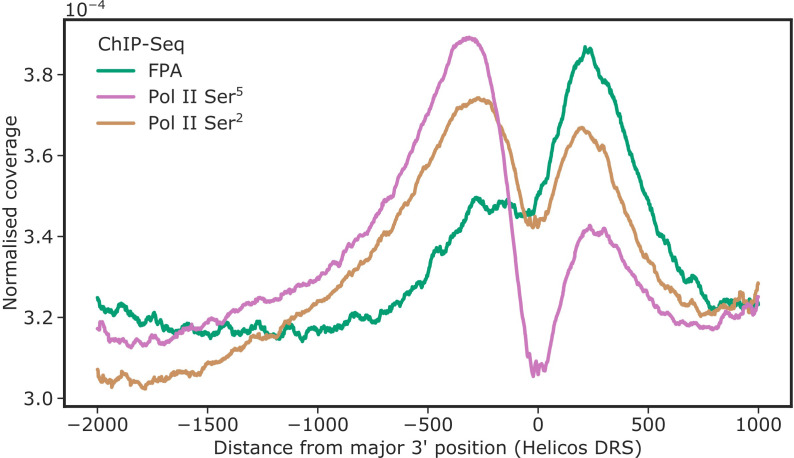
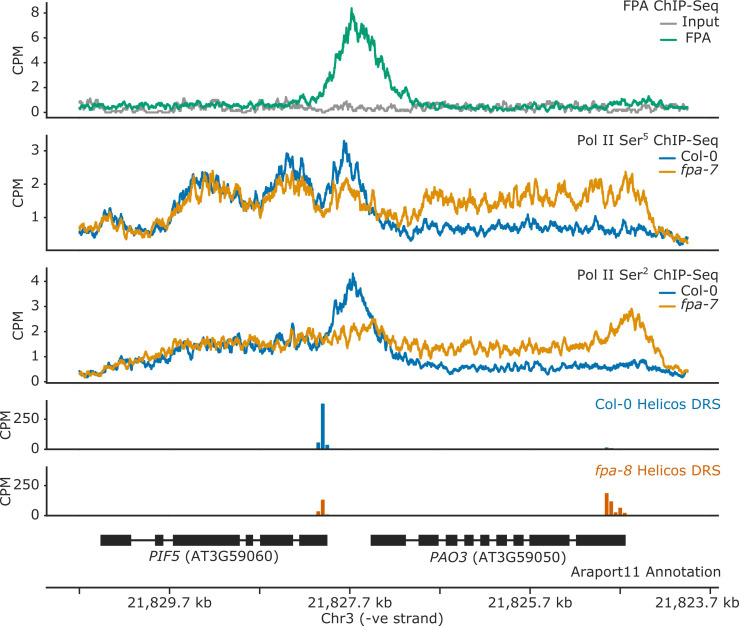
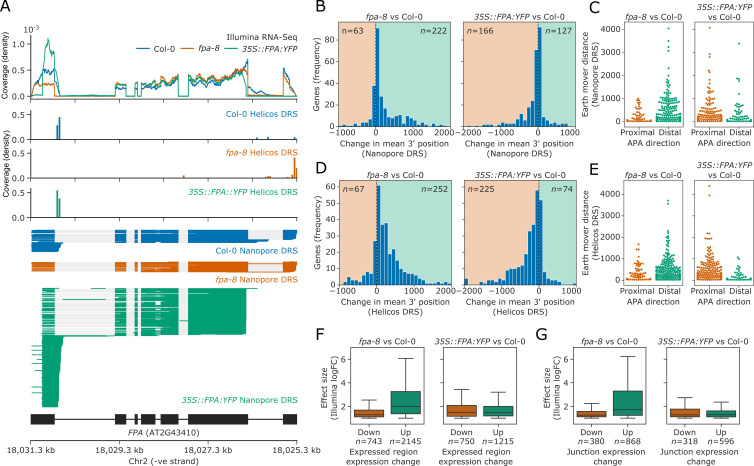
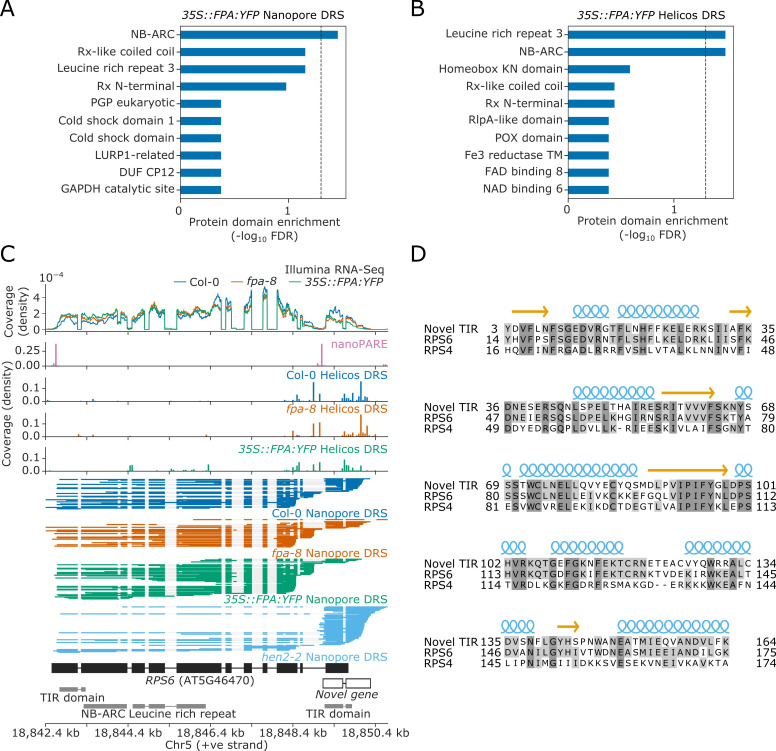
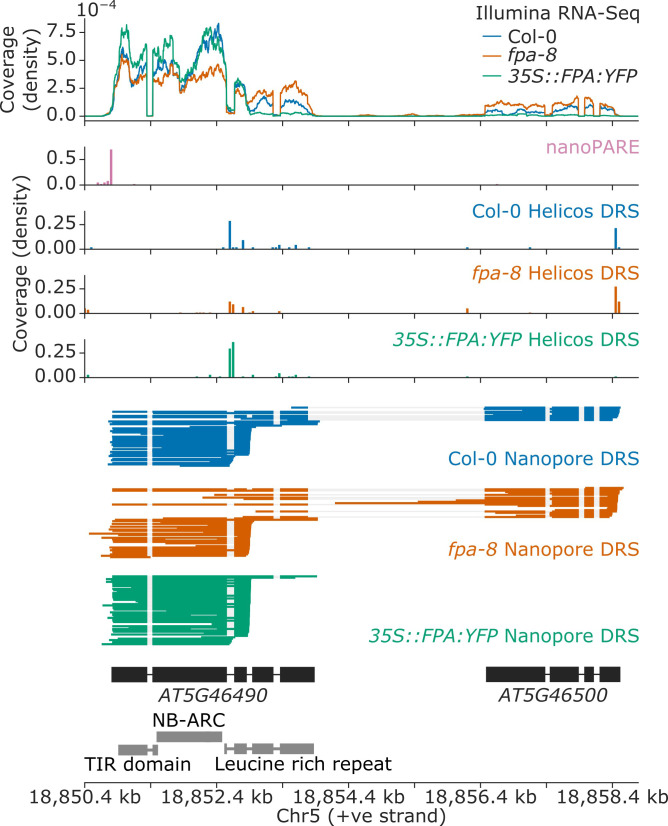
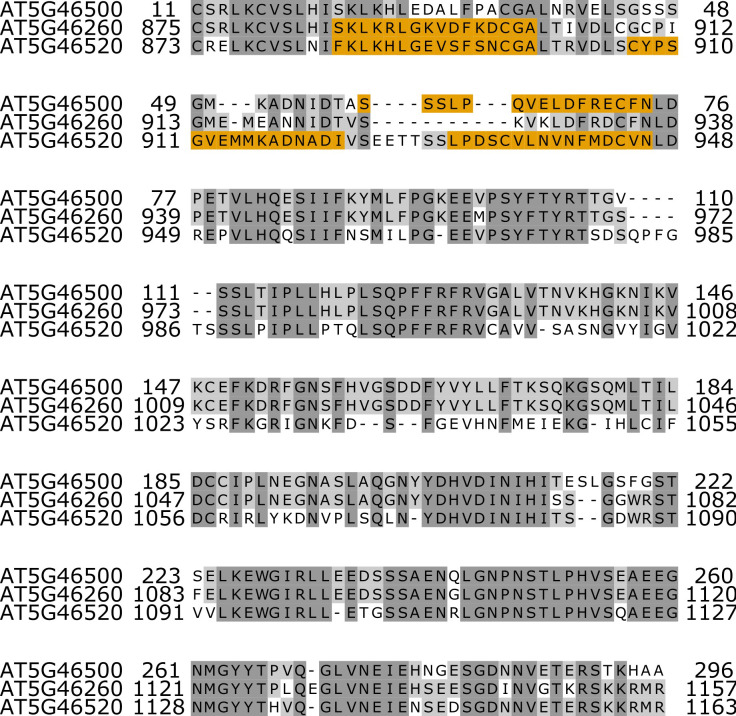
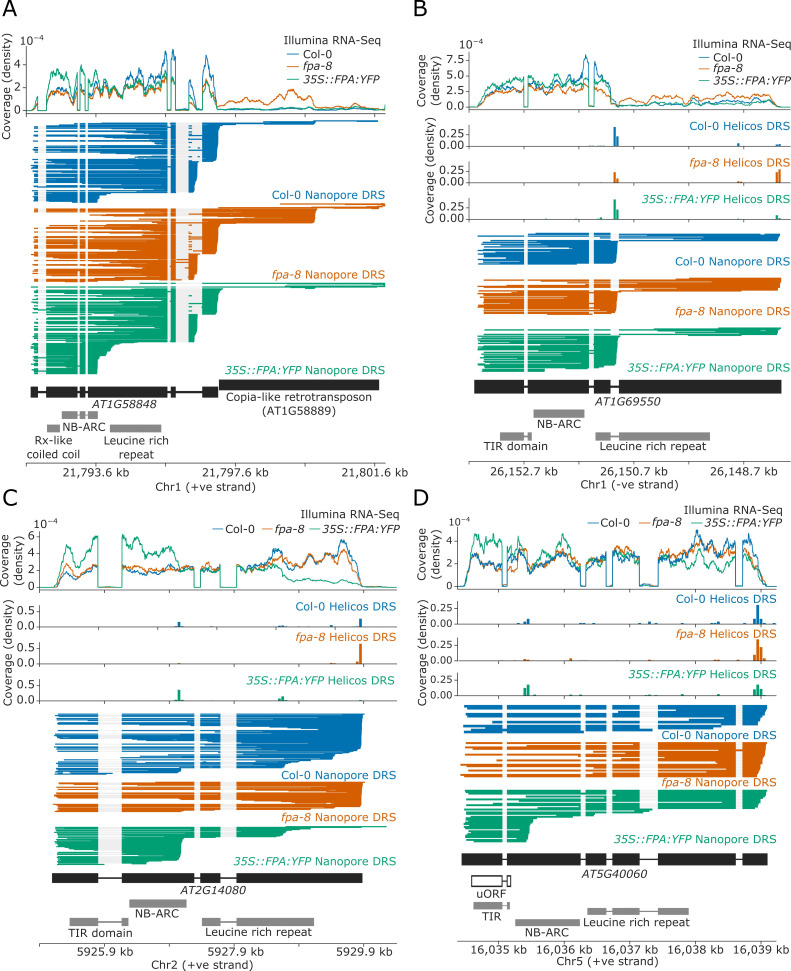
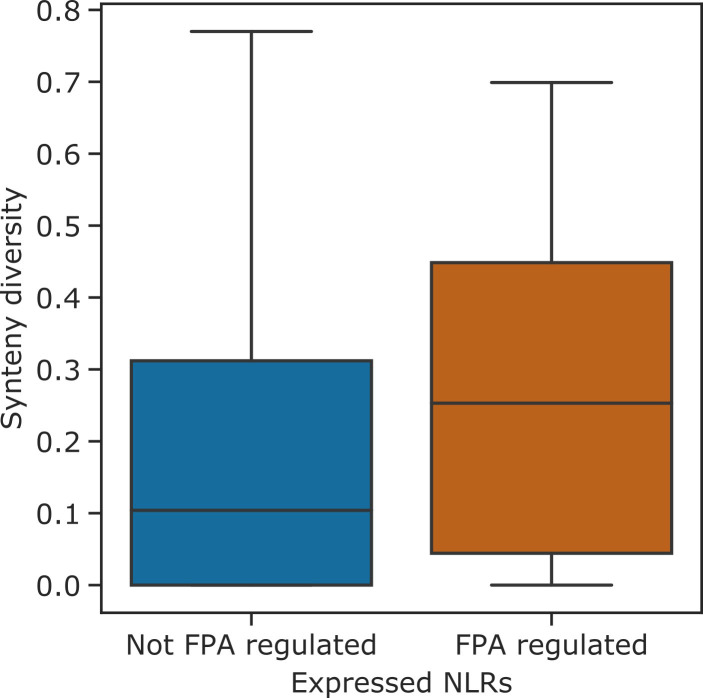
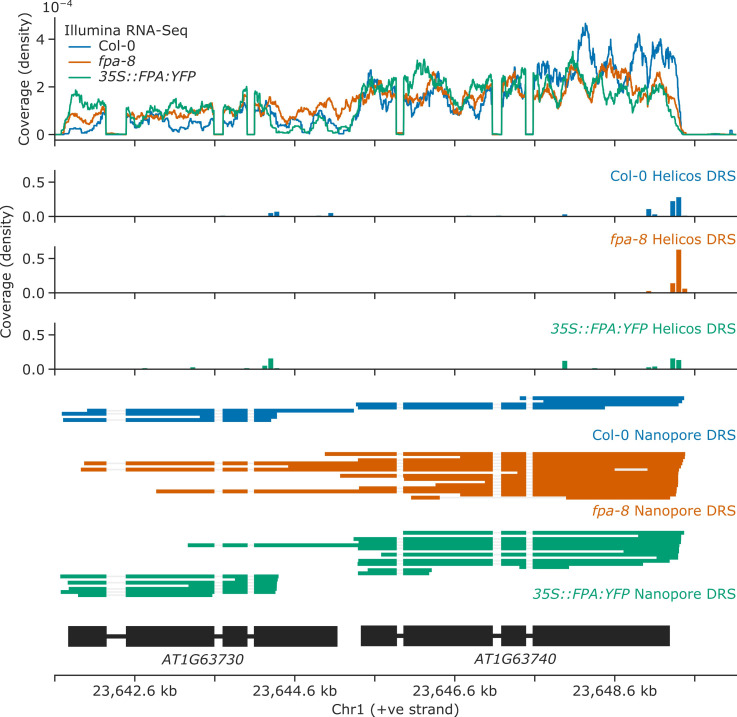
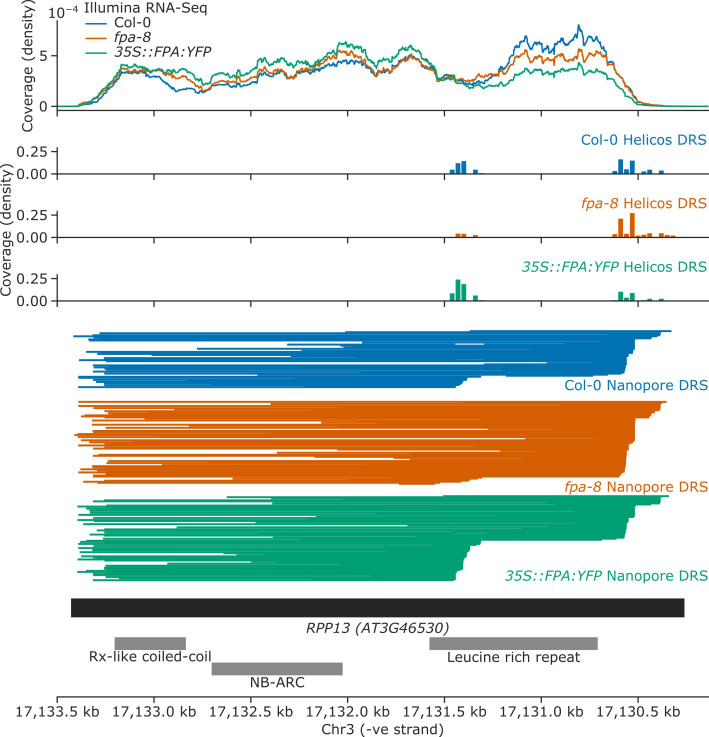
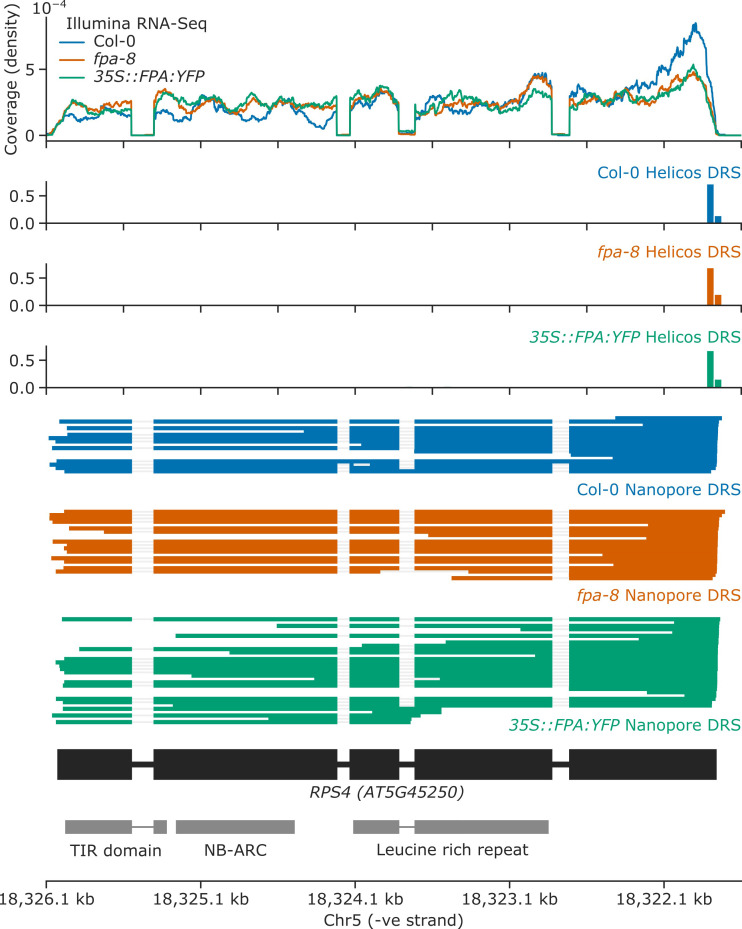
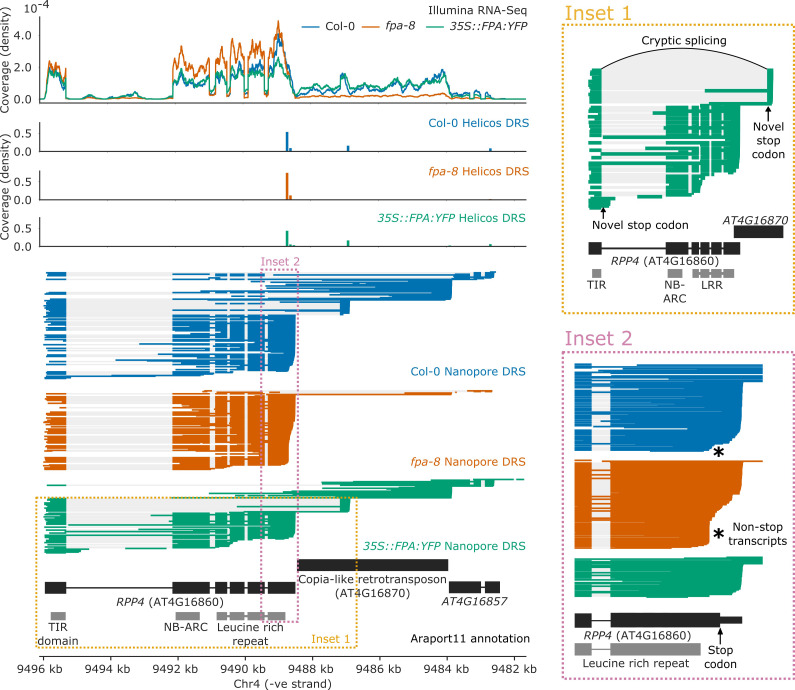
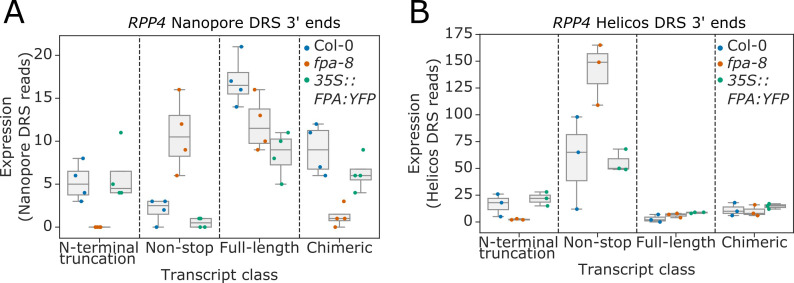
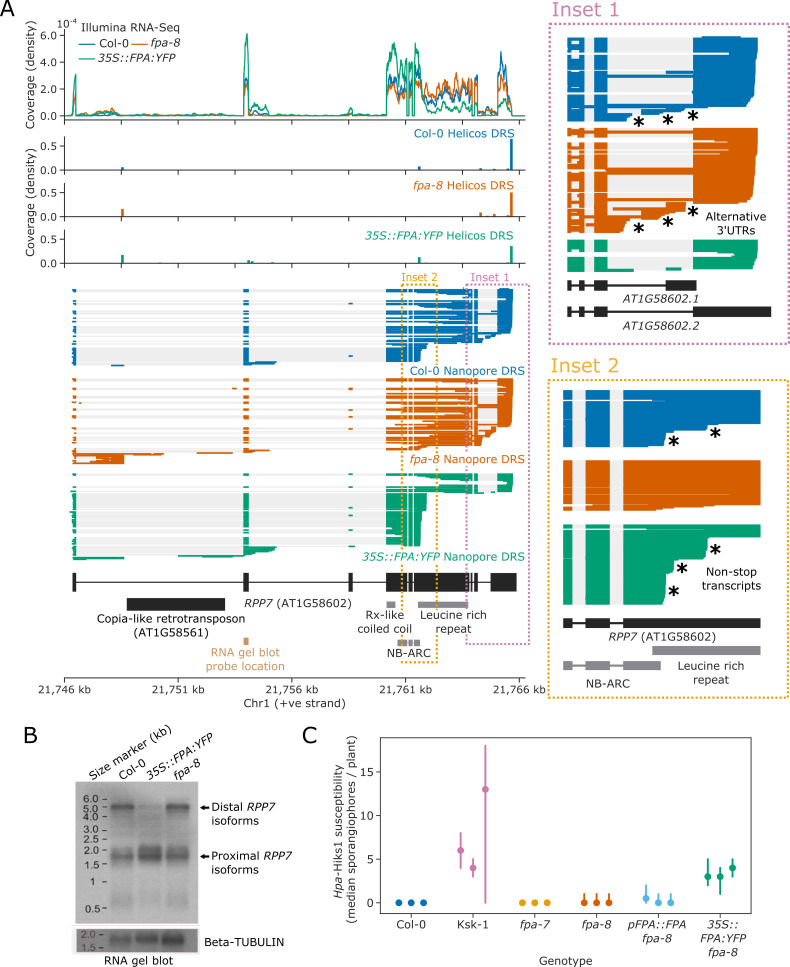
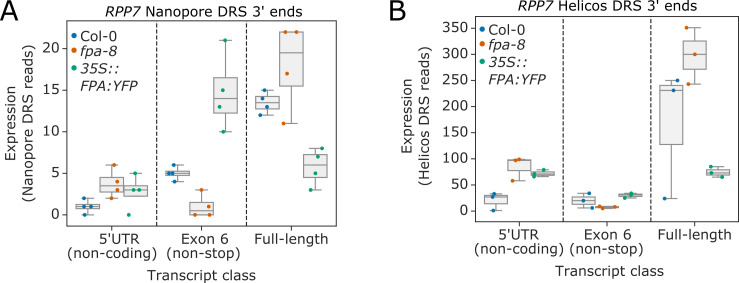
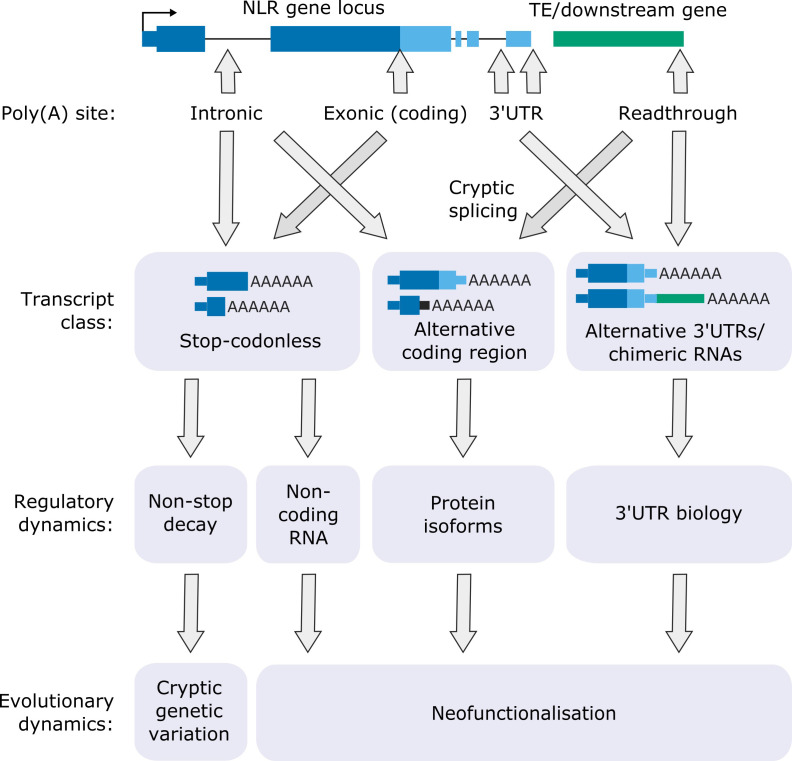
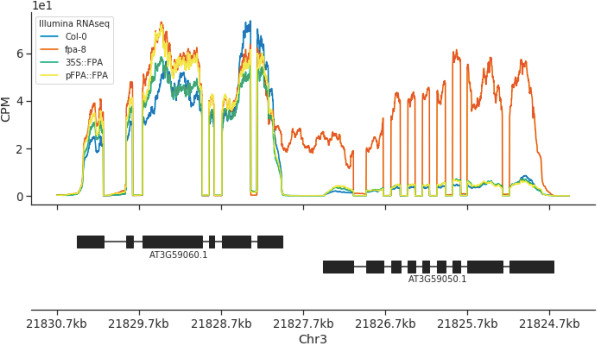
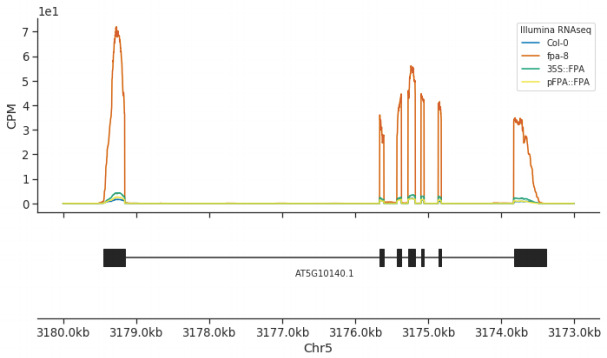
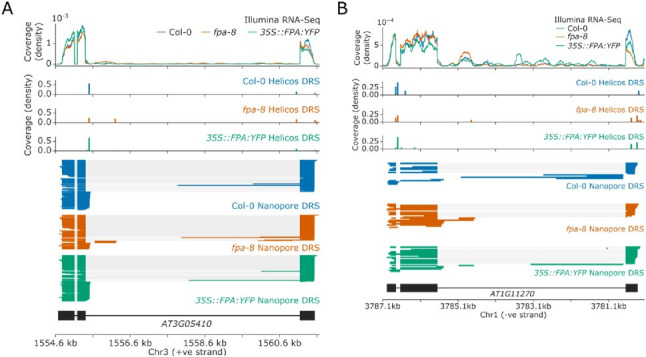
Genes involved in disease resistance are some of the fastest evolving and most diverse components of genomes. Large numbers of nucleotide-binding, leucine-rich repeat (NLR) genes are found in plant genomes and are required for disease resistance. However, NLRs can trigger autoimmunity, disrupt beneficial microbiota or reduce fitness. It is therefore crucial to understand how NLRs are controlled. Here, we show that the RNA-binding protein FPA mediates widespread premature cleavage and polyadenylation of NLR transcripts, thereby controlling their functional expression and impacting immunity. Using long-read Nanopore direct RNA sequencing, we resolved the complexity of NLR transcript processing and gene annotation. Our results uncover a co-transcriptional layer of NLR control with implications for understanding the regulatory and evolutionary dynamics of NLRs in the immune responses of plants.

Keywords: A. thaliana; NLR; alternative polyadenylation; chromosomes; direct RNA sequencing; gene expression; m6A; nanopore; plant biology; spen.


Conflict of interest statement

MP, KK, VZ, AS, DT, XY, PM, JB, SM, GB, GS No competing interests declared

Figures

Figure 1.
Figure 1.. FPA associates with proteins that function to process the 3′ ends of Pol II-transcribed RNAs and promote transcription termination.
(A–D) Volcano plots representing proteins co-purifying with FPA using IVI-MS. Only proteins detected in all three biological replicates of the 35S::FPA:YFP line are shown (light grey). The following classes are highlighted: (A) CPFs in dark blue; (B) Pol II-associated factors in green; terminal exon definition factors in dark orange; (C) autonomous pathway components in yellow and factors controlling alternative polyadenylation in light orange; and (D) m6A writer complex components in light blue. (E) ChIP-Seq metagene profile showing the normalised occupancy of FPA (green) and Pol II phosphorylated at Ser5 (pink) and Ser2 (brown) of the CTD (Yu et al., 2019) relative to the major 3′ position of each gene, as measured using Helicos DRS. Only long genes (>2.5 kb) are included (n = 10,215).
Figure 1—figure supplement 1.
Figure 1—figure supplement 1.. FPA co-localises with Pol II Ser2 at the 3′ end of genes.
ChIP-Seq metagene profile showing the normalised occupancy of FPA (green) and Pol II phosphorylated at Ser5 and Ser2 of the CTD relative to the major 3′ position of each gene, as measured using Helicos DRS. Only short genes (<2.5 kb) are included (n = 17,440).
Figure 1—figure supplement 2.
Figure 1—figure supplement 2.. FPA controls Pol II occupancy and chimeric RNA formation at PIF5.
ChIP-Seq occupancy in counts per million (CPM) of FPA and Pol II phosphorylated at Ser5 or Ser2 at the PIF5 and PAO3 loci. fpa mutants display readthrough of the canonical PIF5 poly(A) site, with a concomitant loss of Ser2 at the poly(A) site, and an increase in Ser5 in downstream PAO3.
Figure 2.
Figure 2.. FPA-dependent poly(A) site selection.
Loss of FPA function is associated with the preferential selection of distal poly(A) sites, whereas FPA overexpression leads to the preferential selection of proximal poly(A) sites. (A) Illumina RNA-Seq, Helicos DRS and Nanopore DRS reveal FPA-dependent RNA 3′ end processing changes at the FPA (AT2G43410) locus. The 35S::FPA:YFP construct has alternative transgene-derived untranslated regions, so mRNAs derived from the transgene do not align to the native FPA 5′UTR and 3′UTR. (B) Histograms showing change in mean RNA 3′ end position for significantly alternatively polyadenylated loci (EMD >25, FDR < 0.05) in fpa-8 (left panel) and 35S::FPA:YFP (right panel) compared with Col-0, as detected using Nanopore DRS. Orange and green shaded regions indicate sites with negative and positive RNA 3′ end position changes, respectively. (C) Effect size of significant proximal (orange) and distal (green) alternative polyadenylation events in fpa-8 (left panel) and 35S::FPA:YFP (right panel) compared with Col-0, as measured using the EMD. (D) Histograms showing change in mean RNA 3′ end position for significantly alternatively polyadenylated loci (EMD >25, FDR < 0.05) in fpa-8 (left panel) and 35S::FPA:YFP (right panel) compared with Col-0, as detected using Nanopore DRS. Orange and green shaded regions indicate sites with negative and positive RNA 3′ end position changes, respectively. (E) Effect size of significant proximal (orange) and distal (green) alternative polyadenylation events in fpa-8 (left panel) and 35S::FPA:YFP (right panel) compared with Col-0, as measured using the EMD. (F) Boxplots showing the effect size (absolute log2 fold change (logFC)) of alternatively processed loci identified using Illumina RNA-Seq in fpa-8 (left panel) and 35S::FPA:YFP (right panel) respectively. Down- and upregulated loci are shown in orange and green, respectively. For each locus, the region with the largest logFC was selected to represent the locus. Loci with both up- and downregulated regions contribute to both boxes. (G) Boxplots showing the effect size (absolute logFC) of loci with alternative splice junction usage identified using Illumina RNA-Seq in fpa-8 (left panel) and 35S::FPA:YFP (right panel), respectively. Down- and upregulated loci are shown in orange and green, respectively. For each locus, the junction with the largest logFC was selected to represent the locus. Loci with both up- and downregulated junctions contribute to both boxes.
Figure 2—figure supplement 1.
Figure 2—figure supplement 1.. Nanopore and Helicos DRS reveal FPA-dependent RNA 3′ end processing changes.
(A) Comparison of RNA 3′ ends identified in Nanopore and Helicos DRS datasets in fpa-8 and 35S::FPA:YFP (compared with Col-0). Bar size indicates the number of alternatively polyadenylated loci common to an intersection (highlighted using circles below). Bars indicating loci that are identified as alternatively polyadenylated in a single condition (fpa-8 or 35S::FPA:YFP) using a single technique (Nanopore or Helicos DRS) are presented in black; bars indicating loci identified as distally polyadenylated in fpa-8 using both Nanopore and Helicos DRS, in orange; bars indicating loci identified as proximally polyadenylated in 35S::FPA:YFP using both Nanopore and Helicos DRS, in green; and bars indicating loci identified as reciprocally regulated by FPA (distal polyadenylation in fpa-8, proximal in 35S::FPA:YFP) using at least one technique, in yellow.
Figure 2—figure supplement 2.
Figure 2—figure supplement 2.. Splicing alterations in fpa-8 can be explained by changes in RNA 3′ end formation.
Gene track showing chimeric RNA formation at the PIF5 gene locus, as detected with Illumina RNA-Seq, Helicos DRS, and Nanopore DRS.
Figure 2—figure supplement 3.
Figure 2—figure supplement 3.. FPA does not affect global mRNA m6A methylation.
Box plot showing the m6A/A ratio, as analysed using LC-MS/MS.
Figure 2—figure supplement 4.
Figure 2—figure supplement 4.. FPA-dependent control of NLR expression is independent of IBM1.
Venn diagram showing genes with altered H3K9me2 levels in ibm1–four mutants, in yellow (Inagaki et al., 2017) and orange (Lai et al., 2020); and genes with altered poly(A) site choice in 35S::FPA:YFP, in green.
Figure 3.
Figure 3.. Nanopore and Helicos DRS identify NLR genes regulated by alternative polyadenylation.
(A–B) Protein domain enrichment analysis for loci with increased proximal poly(A) site selection in 35S::FPA:YFP line, as detected using (A) Nanopore DRS or (B) Helicos DRS. (C) Nanopore DRS reveals the complexity of RNA processing at RPS6. Protein domain locations (shown in grey) represent collapsed InterPro annotations. The novel TIR domain was annotated using InterProScan (Mitchell et al., 2019). (D) Protein alignment of the predicted TIR domain from the novel gene downstream of RPS6, with the sequence of the TIR domains from RPS6 and RPS4. Helix and strand secondary structures (from UniProt: RPS4, Q9XGM3) are shown in blue and yellow, respectively. Residues are shaded according to the degree of conservation.
Figure 3—figure supplement 1.
Figure 3—figure supplement 1.. Nanopore DRS informs reannotation of the complex NLR locus encompassing the AT5G46490 and AT5G46500 annotations.
Gene track showing alternative polyadenylation at the AT5G46490 gene locus, as detected with Illumina RNA-Seq, nanoPARE, Helicos DRS, and Nanopore DRS.
Figure 3—figure supplement 2.
Figure 3—figure supplement 2.. Nanopore DRS informs reannotation of the complex NLR locus encompassing the AT5G46490 and AT5G46500 annotations.
Protein alignment showing similarity between the AT5G46500 protein sequence (which forms the C-terminal portion of distally polyadenylation AT5G46490–AT5G46500 mRNAs) and other NLR protein sequences in the RPS6 cluster. LRR predictions, generated with LRRpredictor (Martin et al., 2020), are shown in orange.
Figure 4.
Figure 4.. FPA-dependent alternative polyadenylation of NLR transcripts.
FPA controls (A) readthrough and chimeric RNA formation at AT1G58848 (unique mapping of short Helicos DRS reads was not possible due to the high homology of AT1G58848 to tandemly duplicated NLR loci in the same cluster); (B) intronic polyadenylation at AT1G69550, resulting in transcripts encoding a protein with a truncated LRR domain; (C) exonic polyadenylation at AT2G14080, resulting in stop-codonless transcripts; and (D) exonic polyadenylation at AT5G40060, resulting in transcripts encoding a TIR-domain-only protein due to an upstream ORF.
Figure 4—figure supplement 1.
Figure 4—figure supplement 1.. NLR genes with FPA-dependent alternative polyadenylation are found in hotspots of rearrangements.
Boxplot showing the synteny diversity, calculated from seven diverse A. thaliana accessions (Jiao and Schneeberger, 2020), of expressed NLR genes with and without FPA-sensitive alternative polyadenylation.
Figure 4—figure supplement 2.
Figure 4—figure supplement 2.. Loss of FPA function causes chimeric RNA formation at AT1G63730 and AT1G63740 NLR loci.
Gene track showing chimeric RNA formation at the AT1G63730 gene locus, as detected with Illumina RNA-Seq, Helicos DRS, and Nanopore DRS.
Figure 4—figure supplement 3.
Figure 4—figure supplement 3.. FPA overexpression increases exonic proximal polyadenylation of RPP13.
Gene track showing proximal polyadenylation at the RPP13 gene locus, as detected with Illumina RNA-Seq, Helicos DRS, and Nanopore DRS.
Figure 4—figure supplement 4.
Figure 4—figure supplement 4.. FPA overexpression causes intron retention and exonic proximal polyadenylation at intron 3 of RPS4.
Gene track showing proximal polyadenylation at the RPS4 gene locus, as detected with Illumina RNA-Seq, Helicos DRS, and Nanopore DRS.
Figure 5.
Figure 5.. Complex FPA-dependent patterns of alternative polyadenylation at RPP4.
FPA-dependent intronic, exonic and readthrough poly(A) site selection in RPP4. (Inset 1) A magnified view of TIR-domain-only RPP4 transcripts detected in 35S::FPA:YFP caused by proximal polyadenylation in intron 1, and distal polyadenylation within the TE associated with cryptic splicing. (Inset 2) A magnified view of the stop-codonless transcripts produced within the protein-coding RPP4 region in fpa-8.
Figure 5—figure supplement 1.
Figure 5—figure supplement 1.. Complex FPA-dependent patterns of alternative polyadenylation at the RPP4 locus.
Comparison of the expression of four classes of RPP4 (AT4G16860) transcripts detected using (A) Nanopore DRS or (B) Helicos DRS. N-terminal truncation, TIR-domain-only transcripts generated by proximal intronic polyadenylation or distal polyadenylation and cryptic splicing; Non-stop, mRNAs lacking in-frame stop codons; Full-length, full-length protein-coding mRNAs; and Chimeric, mRNAs containing RPP4, COPIA-like retrotransposon (AT4G16870) and/or downstream AT4G16857.
Figure 6.
Figure 6.. FPA promotes premature cleavage and polyadenylation within RPP7 protein-coding exon six that compromises plant immunity against Hpa-Hiks1.
(A) FPA-dependent RNA 3′ end formation changes at the RPP7 (AT1G58602) locus. (Inset 1) Magnified view of the RPP7 3′UTR region with alternative RNA 3′ ends. (Inset 2) Magnified view of the stop-codonless transcripts produced in protein-coding RPP7 exon 6. (B) RNA gel blot visualising RPP7 transcripts in Col-0, fpa-8 and 35S::FPA:YFP. Probe location in second exon is shown on (A) (light brown). Beta-TUBULIN was used as an internal control. (C) FPA-dependent premature exonic termination of RPP7 compromises immunity against Hpa-Hiks1. Point plot showing median number of sporangiophores per plant calculated 4 days after Hpa-Hiks1 inoculation. Error bars are 95% confidence intervals. Each experimental replicate was generated from 7 to 45 plants per genotype.
Figure 6—figure supplement 1.
Figure 6—figure supplement 1.. Complex FPA-dependent patterns of alternative polyadenylation at the RPP7 locus.
Comparison of the expression of three classes of RPP7 transcripts detected using (A) nanopore DRS or (B) Helicos DRS. 5′UTR (non-coding), mRNAs prematurely terminated within the 5′UTR; exon 6 (non-stop), stop-codonless transcripts terminated at proximal poly(A) sites in exon 6; and full-length, protein-coding mRNAs terminated at distal poly(A) sites within the 3′UTR. List of supplementary files.
Figure 7.
Figure 7.. Functional consequences of FPA-dependent alternative polyadenylation at NLR loci.
Model diagram showing how FPA-dependent alternative polyadenylation at NLR loci might affect the regulatory and evolutionary dynamics of plant disease resistance.
Author response image 1.
Author response image 1.. A pFPA::FPA transgene complements chimeric RNA formation found in the fpa-8 mutant at PIF5.
Illumina RNA-Seq data showing the expression of PIF5 (AT3G59060) - PAO3 (AT3G59050) chimeric RNAs in fpa-8 is lost in pFPA::FPAfpa-8 complemented lines.
Author response image 2.
Author response image 2.. A 35S::FPA:YFP transgene complements elevated expression of FLC found in the fpa-8 mutant.
Illumina RNA-Seq data showing the overexpression of FLC (AT5G10140) in fpa-8 is restored to around wild type levels in pFPA::FPA and 35S::FPA:YFP complemented lines.
Author response image 3.
Author response image 3.. Alternative polyadenylation of genes with intronic heterochromatin in fpa-8 and 35S::FPA:YFP lines.
(A-B) Gene track showing poly(A) site choice of (A) AT3G05410 and (B) AT1G11270 in fpa-8 and 35S::FPA:YFP lines.

Similar articles

Cited by

References

    1. Adachi H, Derevnina L, Kamoun S. NLR singletons, pairs, and networks: evolution, assembly, and regulation of the intracellular immunoreceptor circuitry of plants. Current Opinion in Plant Biology. 2019;50:121–131. doi: 10.1016/j.pbi.2019.04.007. - DOI - PubMed
    1. Akiva P, Toporik A, Edelheit S, Peretz Y, Diber A, Shemesh R, Novik A, Sorek R. Transcription-mediated gene fusion in the human genome. Genome Research. 2006;16:30–36. doi: 10.1101/gr.4137606. - DOI - PMC - PubMed
    1. Anders S, Reyes A, Huber W. Detecting differential usage of exons from RNA-seq data. Genome Research. 2012;22:2008–2017. doi: 10.1101/gr.133744.111. - DOI - PMC - PubMed
    1. Andrés F, Coupland G. The genetic basis of flowering responses to seasonal cues. Nature Reviews Genetics. 2012;13:627–639. doi: 10.1038/nrg3291. - DOI - PubMed
    1. Andrews S. FastQC: a quality control tool for high throughput sequence data. 2010 https://www.bioinformatics.babraham.ac.uk/projects/fastqc/

Publication types

MeSH terms

LinkOut - more resources