. 2021 Apr 27:10:e67468.
doi: 10.7554/eLife.67468.

Variability in the Munc13-1 content of excitatory release sites

Affiliations

Variability in the Munc13-1 content of excitatory release sites

Maria Rita Karlocai et al. Elife. .

Abstract

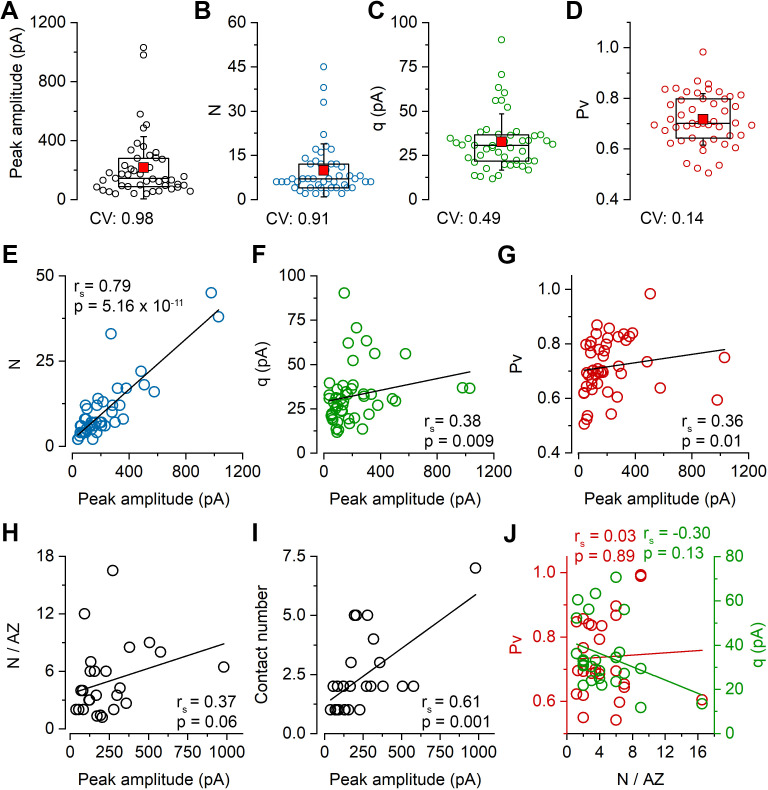
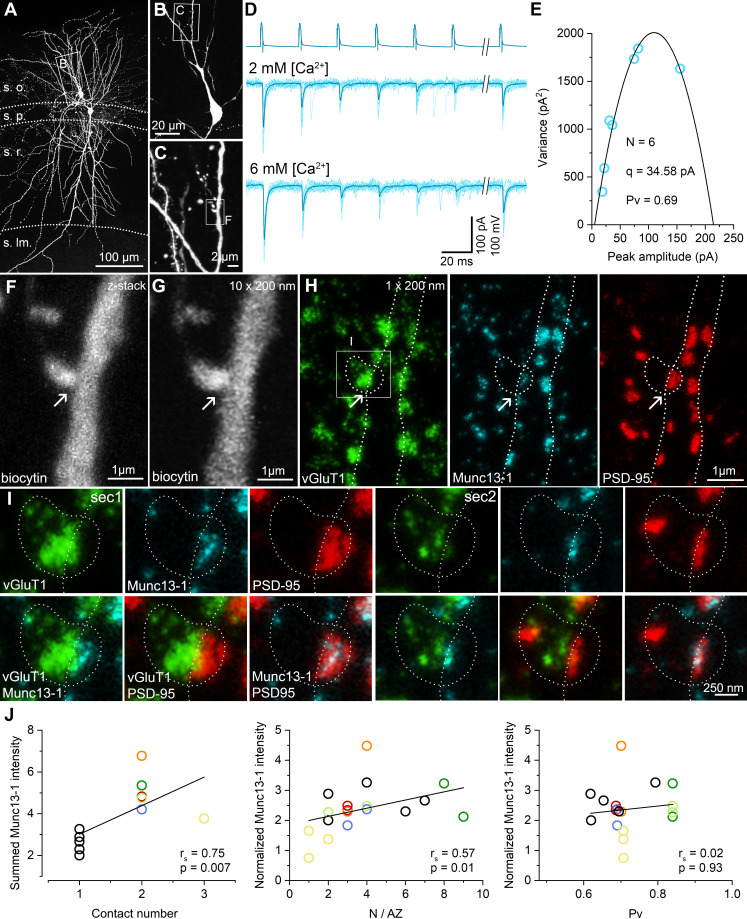
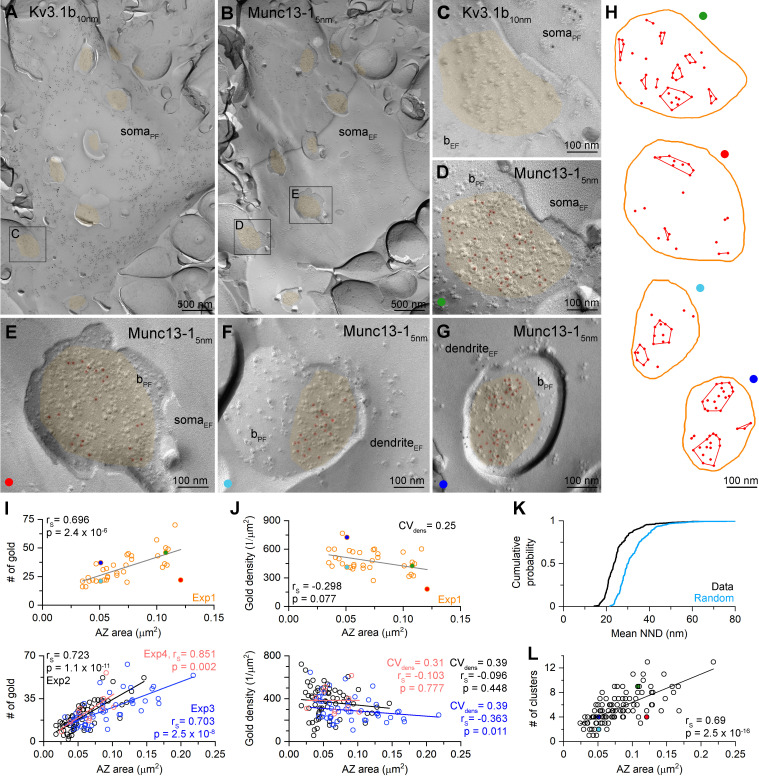
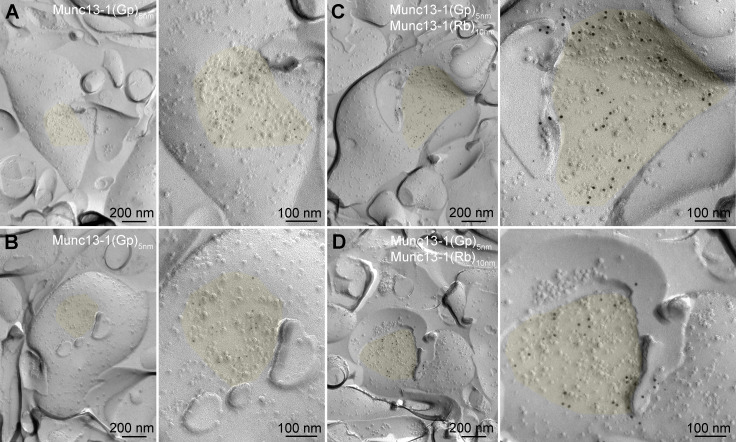
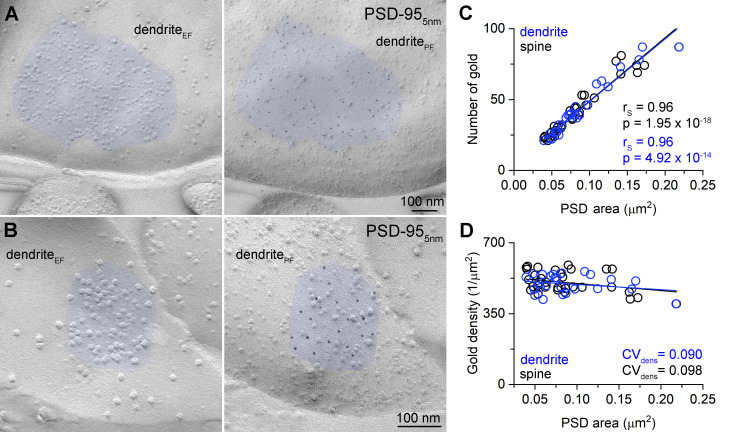
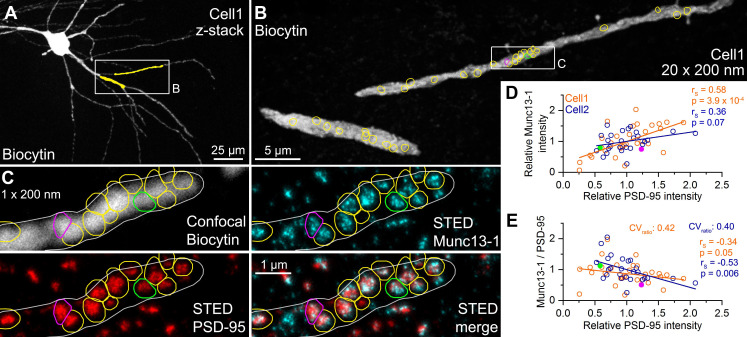
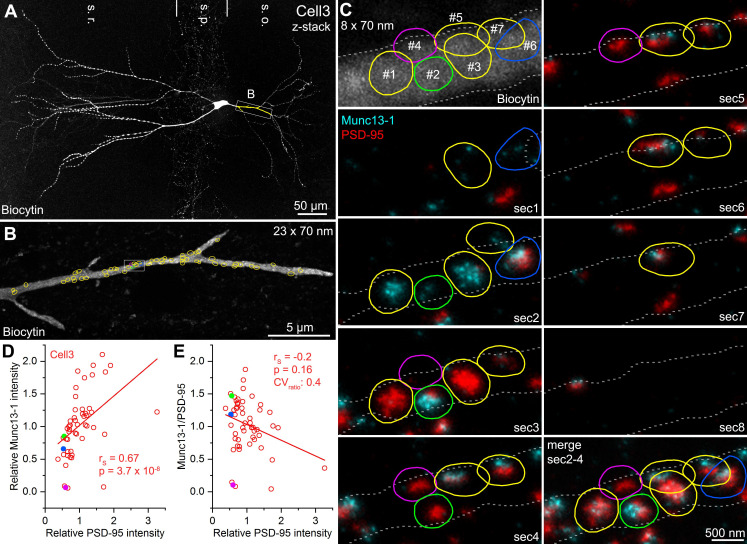
The molecular mechanisms underlying the diversity of cortical glutamatergic synapses are still incompletely understood. Here, we tested the hypothesis that presynaptic active zones (AZs) are constructed from molecularly uniform, independent release sites (RSs), the number of which scales linearly with the AZ size. Paired recordings between hippocampal CA1 pyramidal cells and fast-spiking interneurons in acute slices from adult mice followed by quantal analysis demonstrate large variability in the number of RSs (N) at these connections. High-resolution molecular analysis of functionally characterized synapses reveals variability in the content of one of the key vesicle priming factors - Munc13-1 - in AZs that possess the same N. Replica immunolabeling also shows a threefold variability in the total Munc13-1 content of AZs of identical size and a fourfold variability in the size and density of Munc13-1 clusters within the AZs. Our results provide evidence for quantitative molecular heterogeneity of RSs and support a model in which the AZ is built up from variable numbers of molecularly heterogeneous, but independent RSs.

Keywords: hippocampus; mouse; neuroscience; patch clamp; synaptic transmission.


Conflict of interest statement

MK, JH, TB, NH, AL, ZN No competing interests declared

Figures

Figure 1.
Figure 1.. Synapses between CA1 PC and FSINs show a large variability in their postsynaptic response amplitude and short-term plasticity.
(A) Representative confocal image of a monosynaptically connected, biocytin labeled PC–FSIN pair in the hippocampal CA1 region (top). Membrane potential responses of the IN upon depolarizing and hyperpolarizing current injections (bottom). The supratreshold response shows FS firing characteristics. (B) Excitatory connections in three PC–FSIN pairs. EPSCs (lower traces) recorded in postsynaptic FSINs evoked by action potential (AP) trains in the presynaptic PCs (6 APs at 40 Hz followed by a recovery pulse at 300 or 500 ms, upper traces) display large variability in amplitude and short-term plasticity in 2 mM [Ca2+]. (Pair #1, 68.0 ± 27.7 pA, PPR: 1.05; Pair #2, 140.7 ± 50.8 pA, PPR: 0.58; Pair #3, 507.4 ± 199.6 pA, PPR: 0.65). Top scale bars apply to the top two traces. Recording shown in orange (Pair #1) are from the cell pair in (A). (C) Superimposed averaged traces of the first EPSCs (n = 65 from 50 mice, mean EPSC rise time: 0.4 ± 0.2, CV = 0.40). Colored traces are from the corresponding pairs shown in (B). (D, E) Cumulative distribution of the peak amplitudes of the rise time-subselected first EPSCs and the paired-pulse ratios (EPSC2/EPSC1) recorded in 2 mM [Ca2+] (n = 68 pairs from 46 mice; mean ± SD are indicated on the figure). Colored symbols represent two corresponding pairs with rise times ≤ 0.5 ms shown in (B). (F) Unitary EPSCs in a representative PC–FSIN pair recorded in 6 mM [Ca2+]. Same stimulation protocol as in (B). (G) Stability of the peak amplitude of the first EPSCs over 30 sweeps from the pair shown in (F). (H) Relationship between mean and variance values of EPSC peak amplitudes in 6 mM [Ca2+] from the pair shown in (F). Quantal parameters were estimated with MPFA. N, number of functional release sites, q, quantal size, Pv, vesicular release probability. rs, Spearman’s rank correlation coefficient. s.o. stratum oriens, s.p. stratum pyramidale, s.r. stratum radiatum, s.lm. stratum lacunosum-moleculare.
Figure 1—figure supplement 1.
Figure 1—figure supplement 1.. Confocal and STED analysis of Munc13-1 and PSD-95 immunosignals at functionally characterized synapses in a CA1 PC–FSIN pair that is shown in Figure 1F–H.
(A) Maximum intensity projection of confocal image stack of contact #1 (left) and reconstruction of the same contact after re-sectioning (nineteen 200 nm thick sections, right). Arrows point to the putative synaptic contact between the PC and the FSIN. (B) A single 200 nm thin section containing contact #1. The biocytin-filled presynaptic bouton and postsynaptic dendrite are outlined with white lines. The presynaptic bouton is labeled for vGluT1 (green). Munc13-1 (cyan) and PSD-95 (red) are shown in confocal (middle) and STED (bottom) images. The close apposition of the Munc13-1 and PSD-95 immunosignals on the merged STED image confirms that the presynaptic axon forms a synapse on the postsynaptic dendrite. (C) Same as (A), but for contact #2. (D) Same as (B), but for contact #2.
Figure 2.
Figure 2.. Variability in the number of release sites is primarily responsible for the variability in peak EPSC amplitudes at PC–FSIN pairs.
(A–D) Distribution in the peak amplitude of the first EPSCs (mean: 215.9 ± 211.2 pA), the number of release sites (N, mean: 9.9 ± 9.0), quantal size (q, mean: 32.4 ± 16.0 pA), and vesicular release probability (Pv, mean: 0.72 ± 0.1) in 47 pairs from 41 mice in 6 mM [Ca2+]. Boxplots represent 25–75% percentile, median (middle line), mean (red square), and SD (whisker) values. (E–I) Relationship between the peak amplitude of the first EPSC and the N (E), q (F), Pv (G), N/AZ(H), number of anatomical contact sites (I) in 6 mM [Ca2+], (E–G n = 47 pairs, H and I n = 61 contacts from 26 pairs, 25 mice). (J) Relationships between Pv and N/AZ and q and N/AZ are shown in 26 pairs. rs, Spearman’s rank correlation coefficient.
Figure 2—figure supplement 1.
Figure 2—figure supplement 1.. Comparison of quantal parameters and their correlations in 2 mM and 6 mM extracellular [Ca2+].
(A) Quantal parameters in the presence of 2 mM and 6 mM [Ca2+] (mean of 1st EPSC peak amplitude: 107.0 ± 90.6 pA vs 170.1 ± 112.6 pA; Pv: 0.42 ± 0.15 vs 0.71 ± 0.10; q: 27.4 ± 14.1 pA; N: 10.0 ± 8.2). N and q values were determined from MPFA calculated in 6 mM [Ca2+]. (B) N as a function of first EPSC peak amplitude in the presence of 2 mM (black) and 6 mM (blue) [Ca2+]. (C) Pv as a function of first EPSC peak amplitude in the presence of 2 mM (black) and 6 mM (red) [Ca2+]. (D) Q as a function of first EPSC peak amplitude in the presence of 2 mM (black) and 6 mM (green) [Ca2+]. (E) Pv as a function of N in the presence of 2 mM (black) and 6 mM (red) [Ca2+]. Data are collected from n = 14 cell pairs, 12 mice. rs, Spearman’s rank correlation coefficient. p, Wilcoxon signed rank test (panel A), Spearman’s rank test (B-E).
Figure 3.
Figure 3.. STED analysis of Munc13-1 and PSD-95 immunosignals at functionally characterized PC–FSIN synapses.
(A) Confocal maximum intensity projection image of a monosynaptically connected, biocytin-filled PC–FSIN pair in the hippocampal CA1 region. (B) Enlarged view of the boxed area in (A) with the IN soma and proximal dendrites. (C) Confocal image stack enlarged from the boxed area in (B). Boxed region indicates the location of the synaptic contact site shown in (F and G). (D) Unitary EPSCs recorded from the pair shown in (A) in the presence of 2 mM or 6 mM [Ca2+]. Six APs were evoked at 40 Hz followed by a recovery pulse at 500 ms. (E) Relationship between mean and variance values of EPSC peak amplitudes in the presence of 6 mM extracellular [Ca2+]. Quantal parameters were estimated with MPFA. (F) Maximum intensity projection image of confocal z-stacks (from seven optical sections at 300 nm steps) was obtained from a 125 µm thick resin-embedded slice. Arrow points to the putative synaptic contact between the PC axon and the IN dendrite. (G) The same contact is shown reconstructed from 10 thin (200 nm) serial sections after re-sectioning the resin-embedded slice. (H) STED microscopy image of a single 200 nm thin section. White dashed lines outlining the presynaptic bouton and the postsynaptic dendrite are superimposed on all images. Excitatory synapses – including the identified connection – are located along the biocytin filled dendrite identified by vGluT1 (green), Munc13-1 (cyan), and PSD-95 (red) triple immunolabeling. Arrows point to the putative synaptic contact between the PC axon and the IN dendrite. White box indicates the location of the enlarged area in (I). (I) Localization and separation of the presynaptic (vGluT1 and Munc13-1) and postsynaptic (PSD-95) proteins in the identified contact on two consecutive sections. The biocytin-filled bouton is labeled for vGluT1 (green). The close apposition of the Munc13-1 and PSD-95 immunosignals on the merged STED image confirms that the presynaptic axon forms a synapse on the postsynaptic dendrite. (J, left panel) Summed Munc13-1 intensity of synapses of each pair as a function of contact number. In pairs with double or triple contacts the sums of Munc13-1 intensities are plotted. Black circles represent single-contact pairs, colored circles represent pairs with two (red, blue, green, orange, light green) or three (yellow) synaptic contacts throughout the panels. The Munc13-1 intensity shows a significant positive correlation with N/AZ (middle panel) and the lack of correlation with Pv (right panel). rs: Spearman’s rank correlation coefficient s.o. stratum oriens, s.p. stratum pyramidale, s.r. stratum radiatum, s.lm. stratum lacunosum-moleculare.
Figure 4.
Figure 4.. Density of Munc13-1 shows large variability in AZs targeting Kv3.1b + cells in hippocampal CA1 area as revealed by SDS-FRL.
(A, B) Low-magnification EM images of corresponding protoplasmic-face (somaPF, A) and exoplasmic-face (somaEF, B) membranes of a Kv3.1b + cell body in the stratum oriens. AZs fractured onto the somatic plasma membranes are highlighted in orange. (C, D) High-magnification images of the boxed areas from (A) and (B) show matching EF and PF membranes of a bouton (bEF and bPF) attached to the Kv3.1+ cell. 5 nm gold particles (highlighted in red) labeling Munc13-1 are accumulated in the AZ (orange) of the bouton. (E–G) Other examples of Munc13-1 labeled AZs attached to Kv3.1b + somata or dendrites. (H) Distribution and cluster identification of gold particles labeling Munc13-1 in the AZs shown in (D–G) by DBSCAN analysis (epsilon = 31 nm, minimum number of particles per cluster = 2). (I) Number of Munc13-1 gold particles as a function of AZ area. Data from Exp1 (n = 36) is shown on the upper panel, additional three experiments are shown on the lower panel (Exp2, n = 65; Exp3, n = 48, Exp4 = 10 from three mice). The four AZs shown in (D–G) are indicated by their corresponding colors. (J) Density of Munc13-1 gold particles as a function of AZ area. Data from Exp1 (n = 36) is shown on the upper panel, additional three experiments are shown on the lower panel. (K) Cumulative distribution of mean NNDs (per AZ) of Munc13-1 gold particles (n = 159 AZs) and mean NNDs of randomly distributed particles within the same AZs (generated from 200 random distributions per AZ, p<0.001, Wilcoxon test). (L) Number of Munc13-1 gold particle clusters (estimated by DBSCAN analysis, n = 105 AZs) as a function of AZ area. Colored symbols represent the AZs shown in panels (D–G). rS, Spearman’s rank correlation coefficient.
Figure 4—figure supplement 1.
Figure 4—figure supplement 1.. Specificity test of the Munc13-1 immunolabeling.
(A, B) Two axon terminals with AZs (yellow) labeled for Munc13-1 with a guinea pig antibody (epitope: AA 364–469) shown at low (left) and high (right) magnifications. (C, D) Two axon terminals with AZs (yellow) double labeled for Munc13-1 with two polyclonal antibodies raised against non-overlapping epitopes (guinea pig antibody: AA 364–469, 5 nm gold; rabbit antibody: AA 3–317, 10 nm gold) shown at low (left) and high (right) magnifications. Quantitative analysis in Figure 4 was performed with the rabbit anti-Munc13-1 antibody.
Figure 5.
Figure 5.. Uniform PSD-95 immunolabeling density in the PSDs.
(A, B) Two mirror replica pairs showing excitatory postsynaptic densities (PSDs) on dendrites in the CA1 area. PSD area is identified by the accumulation of intramembrane particles on the exoplasmic-face dendritic membranes (dendriteEF) highlighted by blue (left). The corresponding protoplasmic-face of the same dendrite (dendritePF) is labeled for PSD-95 with 5 nm gold particles (right). (C) Number of gold particles labeling PSD-95 as a function of PSD area in dendritic shaft (n = 25) and dendritic spine (n = 32) synapses. (D) Density of gold particles labeling PSD-95 as a function of PSD area in dendritic shafts (n = 25, rs = −0.115, p=0.583) and dendritic spines (n = 32, rs = −0.326, p=0.069). rs, Spearman’s rank correlation coefficient.
Figure 6.
Figure 6.. Quantitative STED analysis reveals highly variable Munc13-1 signal in excitatory synapses on FSIN dendrites.
(A) Confocal maximum intensity projection image of a biocytin-filled FSIN (Cell1, soma, and basal dendrites in the str. oriens are shown). The dendritic segments that were re-sectioned and analyzed are highlighted in yellow. (B) Reconstruction of the re-sectioned dendritic segments (from twenty 200 nm thick sections) shown in (A). Colored circles indicate en face excitatory synapses (n = 33) identified by Munc13-1 and PSD-95 double immunolabeling. (C) STED analysis of Munc13-1 and PSD-95 immunofluorescent signals on a single 200 nm thick section (shown in the boxed area in (B)). The biocytin-filled dendrite shown in a confocal image (top left) is outlined by a white line. Colored regions of interests (ROIs) represent en face synapses based on the Munc13-1 and PSD-95 immunosignals. (D) Relative Munc13-1 intensity as a function of relative PSD-95 signal in individual synapses. Symbols represent mean normalized integrated fluorescent intensities in individual synapses (Cell1, n = 33; Cell2, n = 26). Magenta and green filled symbols indicate the corresponding color-coded synapses shown in (C). Note that the two synapses have very similar Munc13-1 content although their PSD-95 reactivity is ~2.5-fold different. (E) Munc13-1 to PSD-95 ratio as a function of relative PSD-95 intensity in individual synapses. Magenta and green filled symbols indicate the corresponding color-coded synapses shown in (C). rs, Spearman’s rank correlation coefficient.
Figure 6—figure supplement 1.
Figure 6—figure supplement 1.. Quantitative STED analysis on 70 nm thick sections reveals high variance in Munc13-1 signal in excitatory synapses on FSIN dendrites.
(A) Confocal maximum intensity projection image of a biocytin-filled FSIN (the re-sectioned and analyzed dendritic segment is highlighted in yellow). (B) Reconstruction of the re-sectioned dendritic segment (23 sections, 70 nm thick each) shown in (A). Colored circles indicate excitatory synapses (n = 54) identified by Munc13-1 and PSD-95 double immunolabeling. (C) STED analysis of Munc13-1 and PSD-95 immunofluorescent signals on eight consecutive 70 nm thick sections (shown in the boxed area in B). The biocytin-filled dendrite (top left) is outlined by a dashed white line. Colored regions of interests (ROIs) represent excitatory contacts based on the Munc13-1 and PSD-95 immunosignals. (D) Relative Munc13-1 intensity as a function of relative PSD-95 signal in individual synapses. Symbols represent mean normalized integrated fluorescent intensities in individual synapses (n = 53). Magenta, blue and green filled symbols indicate the corresponding color-coded synapses shown in (C). Note that the three synapses have very similar PSD-95 content although their Munc13-1 reactivity is largely different. (E) Munc13-1 to PSD-95 ratio as a function of relative PSD-95 intensity in individual synapses. Magenta, blue, and green filled symbols indicate the corresponding color-coded synapses shown in (C). rs, Spearman’s rank correlation coefficient, s.o. stratum oriens, s.p. stratum pyramidale, s.r. stratum radiatum.

Similar articles

Cited by

References

    1. Ariel P, Hoppa MB, Ryan TA. Intrinsic variability in pv, RRP size, ca(2+) channel repertoire, and presynaptic potentiation in individual synaptic boutons. Frontiers in Synaptic Neuroscience. 2012;4:9. doi: 10.3389/fnsyn.2012.00009. - DOI - PMC - PubMed
    1. Auger C, Kondo S, Marty A. Multivesicular release at single functional synaptic sites in cerebellar stellate and basket cells. The Journal of Neuroscience. 1998;18:4532–4547. doi: 10.1523/JNEUROSCI.18-12-04532.1998. - DOI - PMC - PubMed
    1. Augustin I, Rosenmund C, Südhof TC, Brose N. Munc13-1 is essential for fusion competence of glutamatergic synaptic vesicles. Nature. 1999;400:457–461. doi: 10.1038/22768. - DOI - PubMed
    1. Betz A, Thakur P, Junge HJ, Ashery U, Rhee JS, Scheuss V, Rosenmund C, Rettig J, Brose N. Functional interaction of the active zone proteins Munc13-1 and RIM1 in synaptic vesicle priming. Neuron. 2001;30:183–196. doi: 10.1016/S0896-6273(01)00272-0. - DOI - PubMed
    1. Biró AA, Holderith NB, Nusser Z. Quantal size is independent of the release probability at hippocampal excitatory synapses. Journal of Neuroscience. 2005;25:223–232. doi: 10.1523/JNEUROSCI.3688-04.2005. - DOI - PMC - PubMed

Publication types

Substances

Grants and funding

The funders had no role in study design, data collection and interpretation, or the decision to submit the work for publication.

LinkOut - more resources