

High Dose IFN- β Activates GAF to Enhance Expression of ISGF3 Target Genes in MLE12 Epithelial Cells
- PMID: 33897699
- PMCID: PMC8062733
- DOI: 10.3389/fimmu.2021.651254
High Dose IFN- β Activates GAF to Enhance Expression of ISGF3 Target Genes in MLE12 Epithelial Cells
Abstract
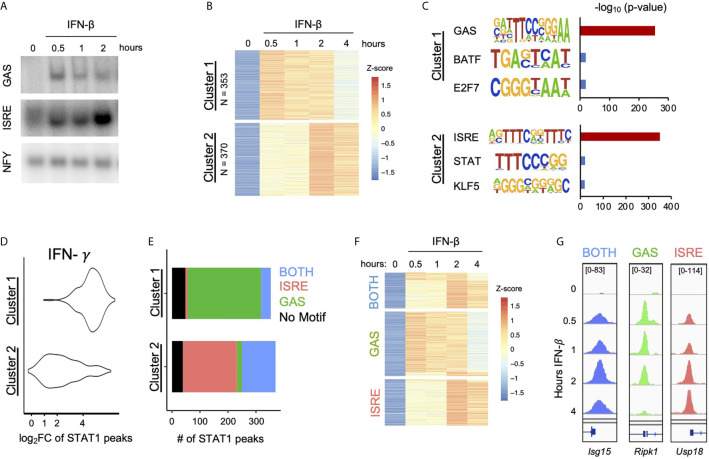
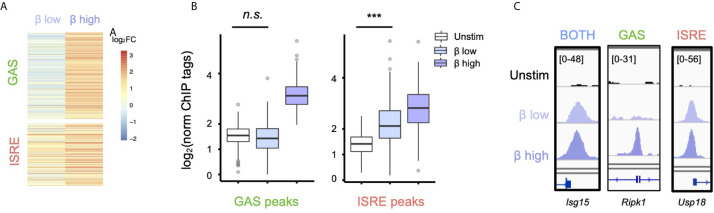
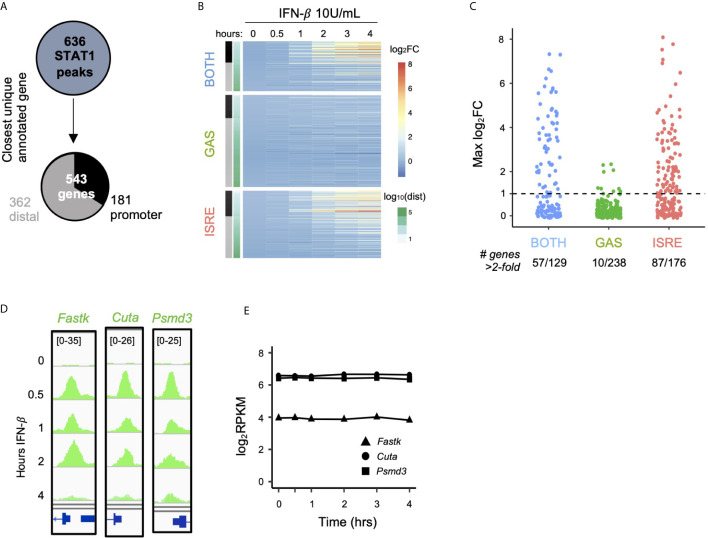
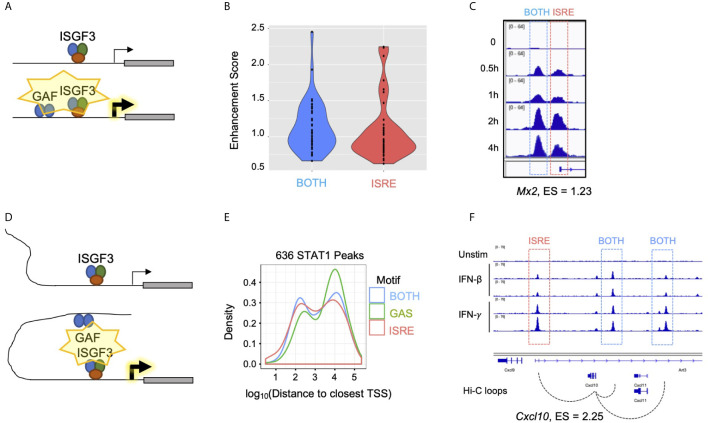
Interferon β (IFN-β) signaling activates the transcription factor complex ISGF3 to induce gene expression programs critical for antiviral defense and host immune responses. It has also been observed that IFN-β activates a second transcription factor complex, γ-activated factor (GAF), but the significance of this coordinated activation is unclear. We report that in murine lung epithelial cells (MLE12) high doses of IFN-β indeed activate both ISGF3 and GAF, which bind to distinct genomic locations defined by their respective DNA sequence motifs. In contrast, low doses of IFN-β preferentially activate ISGF3 but not GAF. Surprisingly, in MLE12 cells GAF binding does not induce nearby gene expression even when strongly bound to the promoter. Yet expression of interferon stimulated genes is enhanced when GAF and ISGF3 are both active compared to ISGF3 alone. We propose that GAF may function as a dose-sensitive amplifier of ISG expression to enhance antiviral immunity and establish pro-inflammatory states.
Keywords: GAF; ISGF3; JAK-STAT signaling pathway; gene regulation; interferon; signal transduction.
Copyright © 2021 Kishimoto, Wilder, Buchanan, Nguyen, Okeke, Hoffmann and Cheng.
Conflict of interest statement
The authors declare that the research was conducted in the absence of any commercial or financial relationships that could be construed as a potential conflict of interest.
Figures


Similar articles
-
IκB kinase epsilon (IKK(epsilon)) regulates the balance between type I and type II interferon responses.Proc Natl Acad Sci U S A. 2011 Dec 27;108(52):21170-5. doi: 10.1073/pnas.1119137109. Epub 2011 Dec 14. Proc Natl Acad Sci U S A. 2011. PMID: 22171011 Free PMC article.
-
A Positive Feedback Amplifier Circuit That Regulates Interferon (IFN)-Stimulated Gene Expression and Controls Type I and Type II IFN Responses.Front Immunol. 2018 May 28;9:1135. doi: 10.3389/fimmu.2018.01135. eCollection 2018. Front Immunol. 2018. PMID: 29892288 Free PMC article. Review.
-
Unphosphorylated ISGF3 drives constitutive expression of interferon-stimulated genes to protect against viral infections.Sci Signal. 2017 Apr 25;10(476):eaah4248. doi: 10.1126/scisignal.aah4248. Sci Signal. 2017. PMID: 28442624
-
Signal Integration of IFN-I and IFN-II With TLR4 Involves Sequential Recruitment of STAT1-Complexes and NFκB to Enhance Pro-inflammatory Transcription.Front Immunol. 2019 Jun 4;10:1253. doi: 10.3389/fimmu.2019.01253. eCollection 2019. Front Immunol. 2019. PMID: 31231385 Free PMC article.
-
The unique role of STAT2 in constitutive and IFN-induced transcription and antiviral responses.Cytokine Growth Factor Rev. 2016 Jun;29:71-81. doi: 10.1016/j.cytogfr.2016.02.010. Epub 2016 Mar 18. Cytokine Growth Factor Rev. 2016. PMID: 27053489 Review.
Cited by
-
Analysis of differential gene expression of pro-inflammatory cytokines in the nasopharyngeal milieu of mild & severe COVID-19 cases.PLoS One. 2022 Dec 30;17(12):e0279270. doi: 10.1371/journal.pone.0279270. eCollection 2022. PLoS One. 2022. PMID: 36584119 Free PMC article.
-
Anti-G protein antibodies targeting the RSV G protein CX3C chemokine region improve the interferon response.Ther Adv Infect Dis. 2023 Mar 14;10:20499361231161157. doi: 10.1177/20499361231161157. eCollection 2023 Jan-Dec. Ther Adv Infect Dis. 2023. PMID: 36938145 Free PMC article.
-
A stimulus-contingent positive feedback loop enables IFN-β dose-dependent activation of pro-inflammatory genes.Mol Syst Biol. 2023 May 9;19(5):e11294. doi: 10.15252/msb.202211294. Epub 2023 Mar 17. Mol Syst Biol. 2023. PMID: 36929731 Free PMC article.
References
-
- Stegemann-Koniszewski S, Jeron A, Gereke M, Geffers R, Kröger A, Gunzer M, et al. . Alveolar type II epithelial cells contribute to the anti-influenza A virus response in the lung by integrating pathogen-and microenvironment-derived signals. mBio (2016) 7(3):e00276–16. 10.1128/mBio.00276-16 - DOI - PMC - PubMed
-
- Thorley AJ, Ford PA, Giembycz MA, Goldstraw P, Young A, Tetley TD. Differential regulation of cytokine release and leukocyte migration by lipopolysaccharide-stimulated primary human lung alveolar type II epithelial cells and macrophages. J Immunol (2007) 178:463–73. 10.4049/jimmunol.178.1.463 - DOI - PubMed
-
- Chuquimia OD, Petursdottir DH, Periolo N, Ferńandez C. Alveolar epithelial cells are critical in protection of the respiratory tract by secretion of factors able to modulate the activity of pulmonary macrophages and directly control bacterial growth. Infect Immun (2013) 81:381–9. 10.1128/IAI.00950-12 - DOI - PMC - PubMed
Publication types
MeSH terms
Substances
Grants and funding
LinkOut - more resources
Full Text Sources
Other Literature Sources
Molecular Biology Databases