. 2021 May 1;35(9-10):749-770.
doi: 10.1101/gad.347005.120. Epub 2021 Apr 22.

BAP1 constrains pervasive H2AK119ub1 to control the transcriptional potential of the genome

Affiliations

BAP1 constrains pervasive H2AK119ub1 to control the transcriptional potential of the genome

Nadezda A Fursova et al. Genes Dev. .

Abstract

Histone-modifying systems play fundamental roles in gene regulation and the development of multicellular organisms. Histone modifications that are enriched at gene regulatory elements have been heavily studied, but the function of modifications found more broadly throughout the genome remains poorly understood. This is exemplified by histone H2A monoubiquitylation (H2AK119ub1), which is enriched at Polycomb-repressed gene promoters but also covers the genome at lower levels. Here, using inducible genetic perturbations and quantitative genomics, we found that the BAP1 deubiquitylase plays an essential role in constraining H2AK119ub1 throughout the genome. Removal of BAP1 leads to pervasive genome-wide accumulation of H2AK119ub1, which causes widespread reductions in gene expression. We show that elevated H2AK119ub1 preferentially counteracts Ser5 phosphorylation on the C-terminal domain of RNA polymerase II at gene regulatory elements and causes reductions in transcription and transcription-associated histone modifications. Furthermore, failure to constrain pervasive H2AK119ub1 compromises Polycomb complex occupancy at a subset of Polycomb target genes, which leads to their derepression, providing a potential molecular rationale for why the BAP1 ortholog in Drosophila has been characterized as a Polycomb group gene. Together, these observations reveal that the transcriptional potential of the genome can be modulated by regulating the levels of a pervasive histone modification.

Keywords: BAP1; H2AK119ub1; Polycomb; chromatin; deubiquitylase; epigenetics; gene expression; histone modification; histone monoubiquitylation; transcription.


Figures

Figure 1.
Figure 1.
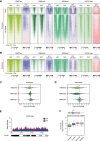
BAP1 functions pervasively throughout the genome to constrain H2AK119ub1. (A) Western blot analysis for BAP1 and other subunits of the PR-DUB complex (ASXL1 and FOXK1) in untreated (UNT) and OHT-treated (OHT) Bap1fl/fl ESCs. BRG1 is shown as a loading control. (B) Western blot analysis (left panel) and quantification (right panel) of H2AK119ub1 and H2BK120ub1 levels relative to histone H3 in untreated and OHT-treated Bap1fl/fl ESCs. Error bars represent SEM (n = 3). P-values denote the result of a paired two-tailed Student's t-test. (C) A chromosome density plot showing H2AK119ub1 cChIP-seq signal across chromosome 18 in Bap1fl/fl ESCs (untreated and OHT-treated) with an expanded snapshot of a region on chromosome 18 shown below. BioCAP-seq and RING1B cChIP-seq in wild-type ESCs are also shown to indicate the location of CGIs that are occupied by PRC1. (D) Box plots comparing log2 fold changes in H2AK119ub1 cChIP-seq signal at gene regulatory elements (enhancers and promoters), gene bodies, and intergenic regions in Bap1fl/fl ESCs following OHT treatment. (E) Box plots comparing log2 fold changes in H2AK119ub1 cChIP-seq signal following OHT treatment in Bap1fl/fl ESCs across different chromatin states derived from unsupervised genome segmentation using ChromHMM. Chromatin states are grouped based on the underlying gene regulatory elements (GREs) and transcriptional activity. The dashed gray line indicates the overall change in H2AK119ub1 levels in the genome as determined by its median value in intergenic regions.
Figure 2.
Figure 2.
Pervasive accumulation of H2AK119ub1 in the absence of BAP1 causes widespread reductions in gene expression. (A) MA plots showing log2 fold changes in gene expression (cnRNA-seq) in Bap1fl/fl, PRC1CPM;Bap1fl/fl, and PRC1CPM ESCs following OHT treatment. Significant gene expression changes (P-adj < 0.05 and >1.5-fold) for a custom nonredundant set of refGene genes (n = 20,633) are shown in red. The density of gene expression changes is shown at the right. (B) A bar plot illustrating the distribution of different gene classes among genes showing significantly reduced expression following OHT treatment in Bap1fl/fl ESCs based on cnRNA-seq analysis (P-adj < 0.05 and >1.5-fold). (PcG) Polycomb-occupied genes, (Non-PcG) non-Polycomb-occupied genes, (Non-NMI) genes lacking a nonmethylated CGI (NMI) at their promoter. (C) Snapshots of genes whose expression is significantly reduced (P-adj < 0.05 and >1.5-fold) following removal of BAP1, showing gene expression (cnRNA-seq) in Bap1fl/fl, PRC1CPM;Bap1fl/fl, and PRC1CPM ESCs (untreated and OHT-treated). (D) Snapshots of genes whose expression is significantly reduced (P-adj < 0.05 and >1.5-fold) following removal of BAP1, showing H2AK119ub1 cChIP-seq in Bap1fl/fl ESCs (untreated and OHT-treated). Also shown is cChIP-seq for H3K27ac and H3K4me3 in untreated Bap1fl/fl ESCs to highlight the position of promoters (H3K27ac-high, H3K4me3-high) and nearest putative enhancers (H3K27ac-high, H3K4me3-low) for these genes. (E) Metaplots of H2AK119ub1 cChIP-seq signal in Bap1fl/fl ESCs (untreated and OHT-treated) across genes that show a significant reduction (Down, n = 2828) or no change (No Change, n = 17,203) in expression following BAP1 removal based on cnRNA-seq analysis (P-adj < 0.05 and >1.5-fold). (F) Box plots comparing log2 fold changes in expression (cnRNA-seq) following OHT treatment in Bap1fl/fl (green), PRC1CPM;Bap1fl/fl (red), and PRC1CPM (blue) ESCs for genes whose expression is significantly reduced (P-adj < 0.05 and >1.5-fold) in the absence of BAP1. P-values denote the result of a two-tailed Student's t-test. (****) P < 10−100. (G) A Venn diagram of the overlap between genes that show a significant reduction in expression based on cnRNA-seq analysis (P-adj < 0.05 and >1.5-fold) following OHT treatment in Bap1fl/fl (green), PRC1CPM;Bap1fl/fl (red), and PRC1CPM (blue) ESCs. P-values denote the result of a Fisher's exact test for the pairwise overlaps between genes showing reduced expression in PRC1CPM;Bap1fl/fl and PRC1CPM, Bap1fl/fl and PRC1CPM;Bap1fl/fl, as well as Bap1fl/fl and PRC1CPM ESCs. (****) P < 10−100 for PRC1CPM;Bap1fl/fl and PRC1CPM, (**) P < 10−5 for Bap1fl/fl and PRC1CPM;Bap1fl/fl, (*) P < 0.05 for Bap1fl/fl and PRC1CPM.
Figure 3.
Figure 3.
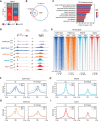
BAP1 counteracts pervasive H2AK119ub1 to promote Ser5 phosphorylation on the CTD of RNA Pol II at gene regulatory elements. (A) Heat maps illustrating cChIP-seq signal for total Pol II occupancy and its Ser5 phosphorylation (S5P) at gene promoters, as well as Pol II Ser2 phosphorylation (S2P) over gene bodies in Bap1fl/fl ESCs (untreated and OHT-treated). Also shown are the log2 fold changes in cChIP-seq signal after BAP1 removal (LFC OHT/UNT) and the log2 fold changes in the abundance of Ser5P and Ser2P relative to total Pol II levels (S5P/Total and S2P/Total). Genes were segregated into those that show a significant reduction (Down, n = 2828) or no change (No Change, n = 17,203) in expression following BAP1 removal based on cnRNA-seq analysis (P-adj < 0.05 and >1.5-fold). Intervals were sorted by total Pol II cChIP-seq signal in untreated Bap1fl/fl ESCs. (B) Heat maps illustrating cChIP-seq signal for total Pol II occupancy, as well as its Ser5P and Ser2P forms, at active enhancers in Bap1fl/fl ESCs (untreated and OHT-treated). As in A, the log2 fold changes in cChIP-seq signal after BAP1 removal (LFC OHT/UNT) are shown together with the log2 fold changes in the abundance of Ser5P and Ser2P relative to total Pol II levels (S5P/Total and S2P/Total). Intervals were sorted by total Pol II cChIP-seq signal in untreated Bap1fl/fl ESCs. (C) Violin plots comparing log2 fold changes in cChIP-seq signal for total Pol II, as well as its Ser5P and Ser2P forms, following OHT treatment in Bap1fl/fl ESCs at the promoters and over the bodies of genes that show a significant reduction (Down, n = 2828) in expression after BAP1 removal based on cnRNA-seq analysis (P-adj < 0.05 and >1.5-fold). P-values denote the result of a one-tailed Student's t-test. (***) P < 10−10, (**) P < 10−5, (ns) P > 0.05. For comparisons of Ser5P/Ser2P with total Pol II, the alternative hypothesis was that the log2 fold change in Ser5P/Ser2P was smaller. For the comparison of Ser5P with Ser2P, the alternative hypothesis was that the log2 fold change in Ser5P was smaller. (D) Violin plots comparing log2 fold changes in the abundance of Ser5P and Ser2P relative to total Pol II levels (S5P/Total and S2P/Total) following OHT treatment in Bap1fl/fl ESCs at the promoters and over the bodies of genes defined in C. P-values denote the result of a one-sample one-tailed Student's t-test to determine whether the log2 fold changes were significantly smaller than 0. (**) P < 10−5, (ns) P > 0.05. (E) Metaplots of total and Ser5P Pol II cChIP-seq signal at active gene promoters in Bap1fl/fl ESCs (untreated and OHT-treated). (F) Violin plots comparing log2 fold changes in total and Ser5P Pol II cChIP-seq signal at active gene promoters in Bap1fl/fl ESCs following OHT treatment. P-value denotes the result of a one-tailed Student's t-test with the alternative hypothesis that the log2 fold change in Ser5P was smaller. (****) P < 10−100. (G) As in E but for active enhancers. (H) As in F but for active enhancers. P-value denotes the result of a one-tailed Student's t-test with the alternative hypothesis that the log2 fold change in Ser5P was smaller. (***) P < 10−10.
Figure 4.
Figure 4.
Aberrant accumulation of H2AK119ub1 compromises transcription-associated histone modifications but not chromatin accessibility at gene regulatory elements. (A) Heat maps illustrating H3K27ac, H3K4me3, and H3K4me1 cChIP-seq signal at gene promoters in Bap1fl/fl ESCs (untreated and OHT-treated). cATAC-seq is shown as a measure of chromatin accessibility. Also shown are the log2 fold changes in cChIP-seq and cATAC-seq signal after BAP1 removal (LFC OHT/UNT). Genes were segregated into those that show a significant reduction (Down, n = 2828) or no change (No Change, n = 17,203) in expression following BAP1 removal based on cnRNA-seq analysis (P-adj < 0.05 and >1.5-fold). Intervals were sorted by total Pol II cChIP-seq signal in untreated Bap1fl/fl ESCs. (B) As in A but for active enhancers. (C) Violin plots comparing log2 fold changes in cChIP-seq signal for H3K27ac, H3K4me3, and H3K4me1 at active gene promoters in Bap1fl/fl ESCs following OHT treatment. P-values denote the result of a one-sample one-tailed Student's t-test to determine whether the log2 fold changes were significantly smaller than 0. (****) P < 10−100, (ns) P > 0.05. (D) As in C but for active enhancers. P-values denote the result of a one-sample one-tailed Student's t-test to determine whether the log2 fold changes were significantly smaller than 0. (****) P < 10−100, (*) P < 0.05. (E) A chromosome density plot showing chromatin accessibility across chromosome 18 as measured by cATAC-seq in Bap1fl/fl ESCs (untreated and OHT-treated). This illustrates a widespread increase in cATAC-seq signal throughout the genome following BAP1 removal. (F) Box plots comparing log2 fold changes in cATAC-seq signal at gene regulatory elements (enhancers and promoters), gene bodies, and intergenic regions in Bap1fl/fl ESCs following OHT treatment.
Figure 5.
Figure 5.
BAP1 indirectly supports repression of a subset of Polycomb target genes by counteracting pervasive H2AK119ub1 to focus Polycomb complex occupancy at target sites. (A) A bar plot illustrating the distribution of different gene classes among genes that become significantly derepressed (P-adj < 0.05 and >1.5-fold) following OHT treatment in Bap1fl/fl ESCs. (PcG) Polycomb-occupied genes, (Non-PcG) non-Polycomb-occupied genes, (Non-NMI) genes lacking a nonmethylated CGI (NMI) at their promoter. (B) A Venn diagram showing the overlap between genes that become significantly derepressed (P-adj < 0.05 and >1.5-fold) following OHT treatment in Bap1fl/fl (red) or PRC1CKO (blue) ESCs. P-value denotes the result of a Fisher's exact test. (****) P < 10−100. (C) A gene ontology (GO) analysis of biological process term enrichment for genes that become significantly derepressed (P-adj < 0.05 and >1.5-fold) in Bap1fl/fl cells following OHT treatment. (D) Snapshots of Polycomb target genes that become significantly derepressed (P-adj < 0.05 and >1.5-fold) following BAP1 removal, showing gene expression (cnRNA-seq) and cChIP-seq for H2AK119ub1, H3K27me3, RING1B (PRC1), and SUZ12 (PRC2) in Bap1fl/fl ESCs (untreated and OHT-treated). (E) Heat maps of cChIP-seq signal for H2AK119ub1, H3K27me3, RING1B (PRC1), and SUZ12 (PRC2) across Polycomb chromatin domains at the promoters of Polycomb-occupied genes in Bap1fl/fl ESCs (untreated and OHT-treated). Intervals were sorted by RING1B occupancy in untreated Bap1fl/fl ESCs. (F) Metaplots of H2AK119ub1 cChIP-seq signal in Bap1fl/fl ESCs (untreated and OHT-treated) at the promoters of Polycomb-occupied genes that become significantly derepressed (Up, n = 421) or do not change in expression (No Change, n = 4075) following BAP1 removal based on cnRNA-seq analysis (P-adj < 0.05 and >1.5-fold). (G) As in F for H3K27me3 cChIP-seq. (H) As in F for RING1B cChIP-seq. (I) As in F for SUZ12 cChIP-seq.
Figure 6.
Figure 6.
A model illustrating how BAP1 can regulate gene expression by constraining pervasive H2AK119ub1. (A) BAP1 facilitates gene expression by constraining the pervasive sea of H2AK119ub1 that covers the genome. Inducible removal of BAP1 (+OHT) results in a broad accumulation of H2AK119ub1 throughout the genome. Elevated H2AK119ub1 indiscriminately counteracts Ser5 phosphorylation (S5P) on the CTD of Pol II at gene regulatory elements ([P] promoters, [E] enhancers), and causes widespread reductions in transcription and gene expression. This explains why disruption of BAP1 and other PR-DUB subunits can lead to Trithorax group (TrxG)-like phenotypes. (B) BAP1 also indirectly supports repression of a subset of Polycomb target genes by counteracting pervasive H2AK119ub1 and focusing high levels of Polycomb complexes at target gene promoters. In the absence of BAP1, PRC1/PRC2 occupancy at Polycomb target sites is reduced, presumably due to the increased binding of these complexes to elevated H2AK119ub1 elsewhere in the genome. This leads to derepression of a subset of Polycomb target genes that appear to rely on high-level Polycomb complex occupancy for their silencing, providing a potential molecular rationale for why the BAP1 ortholog in Drosophila has been originally characterized as a Polycomb group (PcG) gene.

Similar articles

Cited by

References

    1. Aihara H, Nakagawa T, Mizusaki H, Yoneda M, Kato M, Doiguchi M, Imamura Y, Higashi M, Ikura T, Hayashi T, et al. 2016. Histone H2A T120 phosphorylation promotes oncogenic transformation via upregulation of cyclin D1. Mol Cell 64: 176–188. 10.1016/j.molcel.2016.09.012 - DOI - PubMed
    1. Amemiya HM, Kundaje A, Boyle AP. 2019. The ENCODE blacklist: identification of problematic regions of the genome. Sci Rep 9: 9354. 10.1038/s41598-019-45839-z - DOI - PMC - PubMed
    1. Andersson R, Sandelin A. 2020. Determinants of enhancer and promoter activities of regulatory elements. Nat Rev Genet 21: 71–87. 10.1038/s41576-019-0173-8 - DOI - PubMed
    1. Aquila L, Atanassov BS. 2020. Regulation of histone ubiquitination in response to DNA double strand breaks. Cells 9: 1699. 10.3390/cells9071699 - DOI - PMC - PubMed
    1. Arrigoni R, Alam SL, Wamstad JA, Bardwell VJ, Sundquist WI, Schreiber-Agus N. 2006. The Polycomb-associated protein Rybp is a ubiquitin binding protein. FEBS Lett 580: 6233–6241. 10.1016/j.febslet.2006.10.027 - DOI - PubMed

Publication types