

Histone Deacetylase 6 Regulates the Activation of M1 Macrophages by the Glycolytic Pathway During Acute Liver Failure
- PMID: 33883923
- PMCID: PMC8055295
- DOI: 10.2147/JIR.S302391
Histone Deacetylase 6 Regulates the Activation of M1 Macrophages by the Glycolytic Pathway During Acute Liver Failure
Abstract
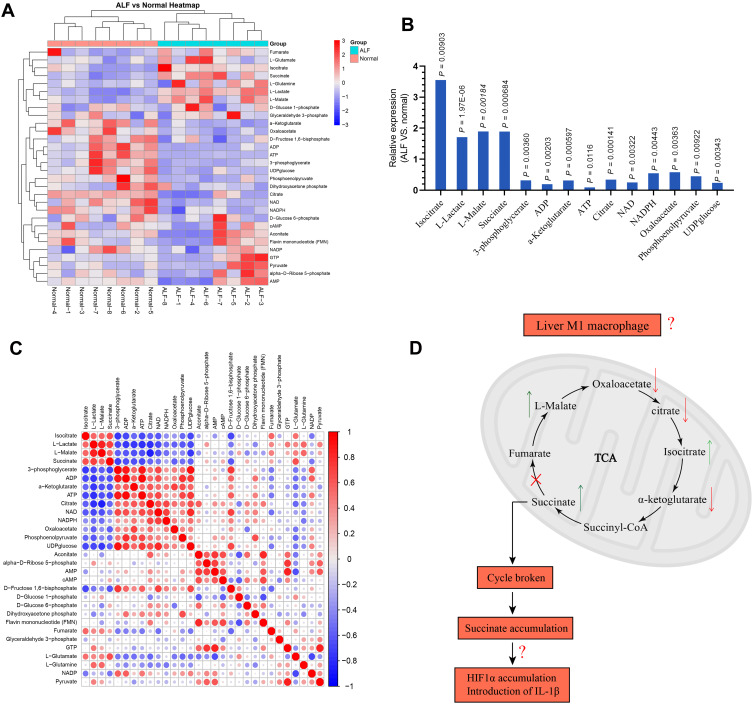
Background: The glycolysis pathway of M1 macrophages is a key factor affecting the inflammatory response. The aim of this article is to investigate the role of histone deacetylase 6 (HDAC6) in the M1 macrophage glycolysis pathway during acute liver failure (ALF).
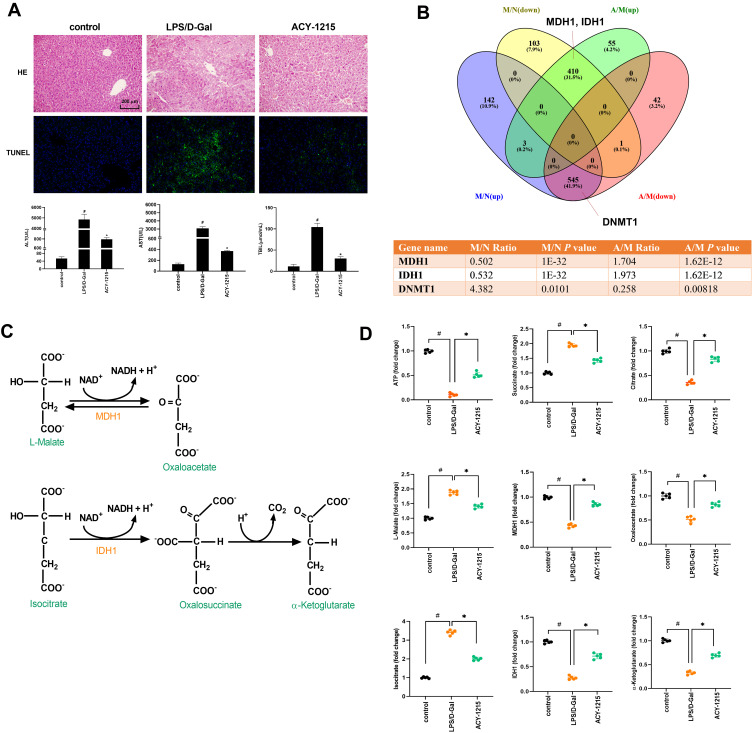
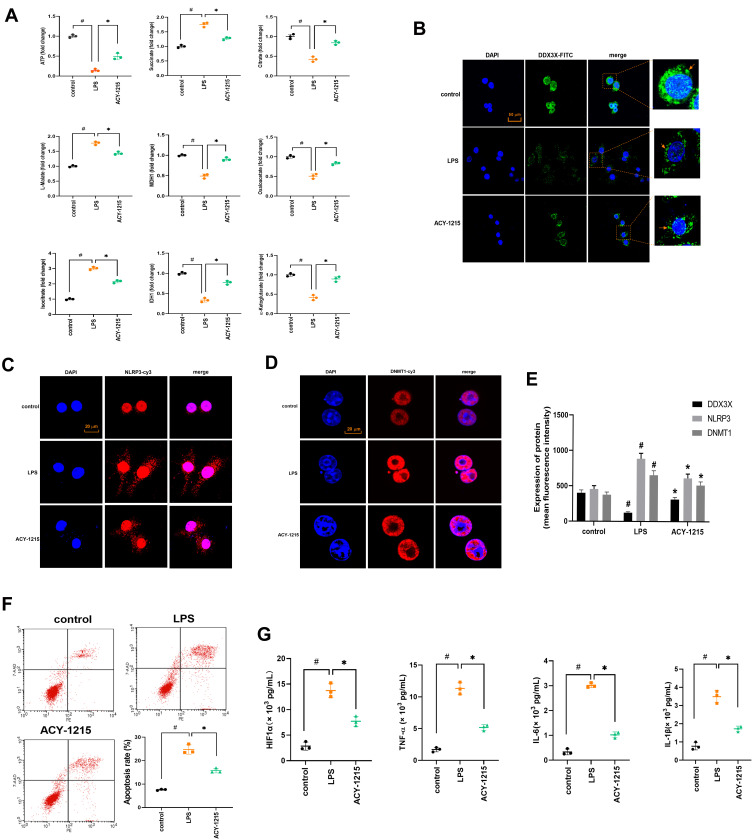
Methodology: Targeted metabolomics for quantitative analysis of energy metabolites technology was used to detect the characteristics of energy metabolism for 8 ALF patients and 8 normal volunteers. The ALF mice model was intervened with HDAC6 inhibitor ACY-1215. iTRAQ/TMT quantitative proteomics was used to detect protein expression in livers in different mice groups. The liver function, energy metabolites, M1 macrophages, cytokines, and pathological structure, DDX3X, NLRP3 and DNMT1 in liver tissue were detected. The changes of the above molecules were verified in cell groups.
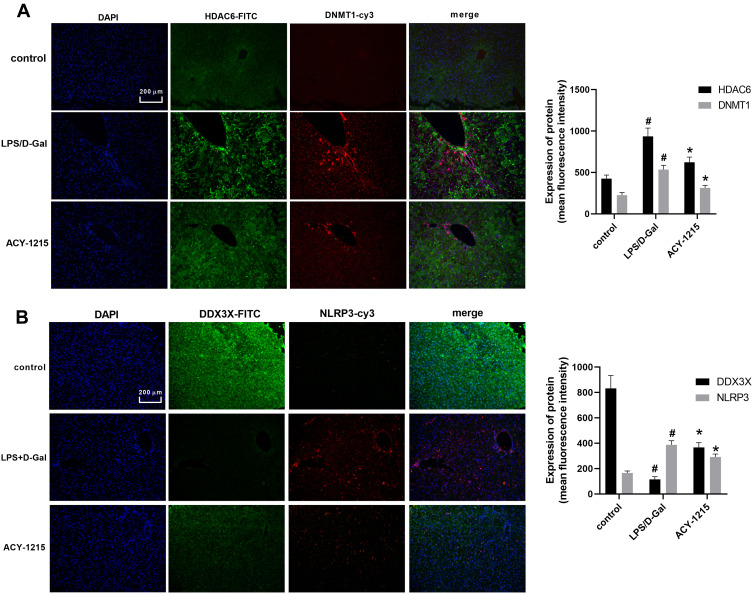
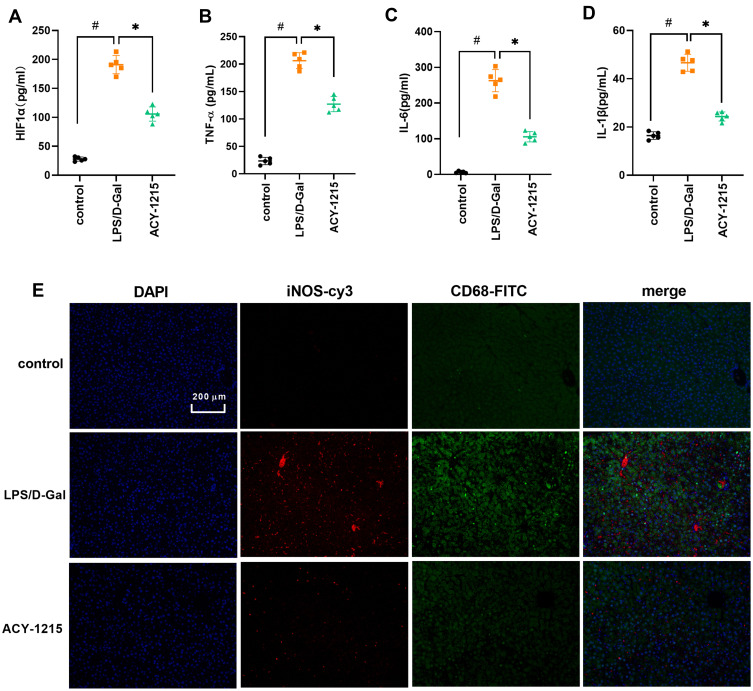
Results: ALF patients and mice have significant energy metabolism disorders, accompanied by activation of M1 macrophages. After the intervention of ACY-1215, the activated M1 macrophages and cytokines levels in the mouse liver were reduced. The levels of IDH1, MDH1, and ATP were significantly increased. The expression of DDX3X increased, while the expression of NLRP3 and DNMT1 decreased. ACY-1215 could reduce the model cell apoptosis level and inflammatory response, and improve energy metabolism. It could also promote the expression of DDX3X, and inhibit the expression of NLRP3 and DNMT1.
Conclusion: ACY-1215 could inhibit the activation of M1 macrophages by improving the glycolytic pathway through regulating DNMT1 and DDX3X/NLRP3 signals to alleviate ALF.
Keywords: HDAC6; M1 macrophage; acute liver failure; metabolic reprogramming.
© 2021 Wang et al.
Conflict of interest statement
The authors declare that they have no conflicts of interest for this work.
Figures
Similar articles
-
Histone deacetylase 6 inhibitor ACY-1215 protects against experimental acute liver failure by regulating the TLR4-MAPK/NF-κB pathway.Biomed Pharmacother. 2018 Jan;97:818-824. doi: 10.1016/j.biopha.2017.10.103. Epub 2017 Nov 6. Biomed Pharmacother. 2018. PMID: 29112935
-
Quantitative Proteomic Analysis Reveals the Sites Related to Acetylation and Mechanism of ACY-1215 in Acute Liver Failure Mice.Front Pharmacol. 2019 Jun 11;10:653. doi: 10.3389/fphar.2019.00653. eCollection 2019. Front Pharmacol. 2019. PMID: 31244662 Free PMC article.
-
Inhibition of HDAC6 attenuates LPS-induced inflammation in macrophages by regulating oxidative stress and suppressing the TLR4-MAPK/NF-κB pathways.Biomed Pharmacother. 2019 Sep;117:109166. doi: 10.1016/j.biopha.2019.109166. Epub 2019 Jun 27. Biomed Pharmacother. 2019. PMID: 31255993
-
The acetylation of MDH1 and IDH1 is associated with energy metabolism in acute liver failure.iScience. 2024 Apr 6;27(5):109678. doi: 10.1016/j.isci.2024.109678. eCollection 2024 May 17. iScience. 2024. PMID: 38660411 Free PMC article.
-
Metabolic evolutionary roots of the macrophage immune response in amoeba-bacteria interactions: The conserved role of hypoxia-induced Factor and AMP kinase.Acta Biochim Pol. 2021 Aug 10;68(3):457-476. doi: 10.18388/abp.2020_5683. Acta Biochim Pol. 2021. PMID: 34374500 Review.
Cited by
-
Nafamostat mesilate prevented caerulein-induced pancreatic injury by targeting HDAC6-mediated NLRP3 inflammasome activation.Inflamm Res. 2023 Sep;72(9):1919-1932. doi: 10.1007/s00011-023-01794-0. Epub 2023 Sep 19. Inflamm Res. 2023. PMID: 37725105
-
Role of Selective Histone Deacetylase 6 Inhibitor ACY-1215 in Cancer and Other Human Diseases.Front Pharmacol. 2022 May 16;13:907981. doi: 10.3389/fphar.2022.907981. eCollection 2022. Front Pharmacol. 2022. PMID: 35652048 Free PMC article. Review.
-
Deacetylated MDH1 and IDH1 aggravates PANoptosis in acute liver failure through endoplasmic reticulum stress signaling.Cell Death Discov. 2024 Jun 8;10(1):275. doi: 10.1038/s41420-024-02054-8. Cell Death Discov. 2024. PMID: 38851781 Free PMC article.
-
The Role of HDAC6 in Autophagy and NLRP3 Inflammasome.Front Immunol. 2021 Oct 27;12:763831. doi: 10.3389/fimmu.2021.763831. eCollection 2021. Front Immunol. 2021. PMID: 34777380 Free PMC article. Review.
-
The HDAC6 inhibitor AVS100 (SS208) induces a pro-inflammatory tumor microenvironment and potentiates immunotherapy.Sci Adv. 2024 Nov 15;10(46):eadp3687. doi: 10.1126/sciadv.adp3687. Epub 2024 Nov 15. Sci Adv. 2024. PMID: 39546602 Free PMC article.
References
-
- Bernal W, Wendon J. Acute Liver Failure. N Engl J Med. 2013;369(26):2525–2534. - PubMed
LinkOut - more resources
Full Text Sources
Other Literature Sources
Research Materials
Miscellaneous
