

PI3KC2β inactivation stabilizes VE-cadherin junctions and preserves vascular integrity
- PMID: 33880878
- PMCID: PMC8183416
- DOI: 10.15252/embr.202051299
PI3KC2β inactivation stabilizes VE-cadherin junctions and preserves vascular integrity
Abstract
Endothelium protection is critical, because of the impact of vascular leakage and edema on pathological conditions such as brain ischemia. Whereas deficiency of class II phosphoinositide 3-kinase alpha (PI3KC2α) results in an increase in vascular permeability, we uncover a crucial role of the beta isoform (PI3KC2β) in the loss of endothelial barrier integrity following injury. Here, we studied the role of PI3KC2β in endothelial permeability and endosomal trafficking in vitro and in vivo in ischemic stroke. Mice with inactive PI3KC2β showed protection against vascular permeability, edema, cerebral infarction, and deleterious inflammatory response. Loss of PI3KC2β in human cerebral microvascular endothelial cells stabilized homotypic cell-cell junctions by increasing Rab11-dependent VE-cadherin recycling. These results identify PI3KC2β as a potential new therapeutic target to prevent aggravating lesions following ischemic stroke.
Keywords: endosomal trafficking; endothelial hyperpermeability; phosphoinositide 3-kinase C2β; vascular biology; vascular endothelial-cadherin.
© 2021 The Authors.
Conflict of interest statement
B.V. is a consultant for Karus Therapeutics (Oxford, UK), iOnctura (Geneva, Switzerland), and Venthera (Palo Alto, US) and has received speaking fees from Gilead. The other authors have no competing financial interest to declare.
Figures
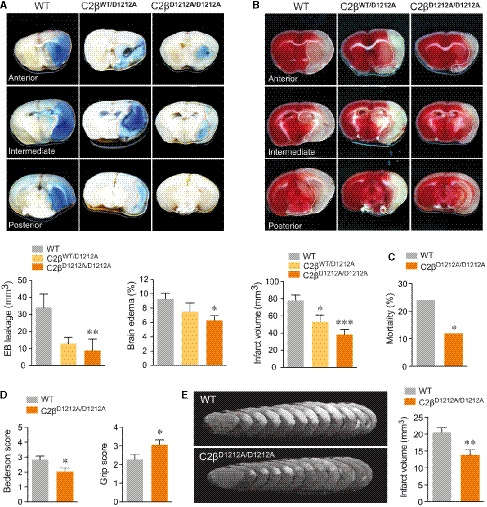
- A–D
WT, heterozygous (C2βWT/D1212A) and C2βD1212A/D1212A mice were subjected to tMCAO (1 h ischemia followed by 24 h reperfusion). (A) Representative photographs of coronal brain sections and graph quantification of Evans blue (EB) dye leakage (dashed orange line) and edema volume. Data represent mean ± SEM (EB leakage: n = 5–16 mice per group; edema volume: n = 14–30 mice per group; *P < 0.05, **P < 0.01 Mann–Whitney test). (B) Representative photographs of coronal brain section stained with TTC (dashed white line) and graph quantification of infarct volume measurements. Data represent mean ± SEM (n = 14–27 mice per group; *P < 0.05; ***P < 0.001, unpaired t‐test). (C) Mortality between day 0 and day 1 after tMCAO (n = 30–39 mice per group; *P < 0.05, Fisher's test). (D) Neurological scores evaluated 24 h after reperfusion by Bederson test (left panel) and grip test (right panel) based on a five point system. Data represent mean ± SEM (n = 14–27 mice per group; *P < 0.05, unpaired t‐test).
- E
WT and C2βD1212A/D1212A mice were subjected to thromboembolic stroke model. Representatives T2‐weighted MRI of coronal section taken 24 h after the onset of in situ clot formation by α‐thrombin are shown. Graph quantification of infarct volume measurements. Data represent mean ± SEM (n = 23–25 mice per group; **P < 0.01, unpaired t‐test).
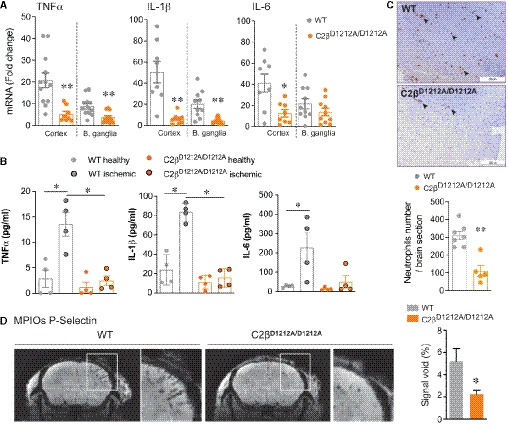
- A–C
WT and C2βD1212A/D1212A mice were subjected to tMCAO followed by 24h of reperfusion. (A) Gene expression of TNFα, IL‐1β, and IL‐6 in the cortex and basal ganglia (B. ganglia). The mRNA levels are given as the fold change normalized to rps29 relative to the corresponding contralateral (healthy) hemisphere. Data represent mean ± SEM (n = 8–10 mice per group; *P = 0.05 and **P < 0.01, unpaired t‐test with Welch's correction). (B) Protein expression of TNFα, IL‐1β, and IL‐6. Data represent mean ± SEM (n = 4 mice per group; *P = 0.05; Mann–Whitney test). (C) Representative immunohistochemistry of neutrophils (arrowheads) in ischemic hemisphere (scale bar 200 µm) and graph quantification. Data represent mean ± SEM (n = 5–7 mice per group; **P < 0.01; Mann–Whitney test).
- D
Representative T2‐weighted MRI of WT and C2βD1212A/D1212A mice taken 24 h after clot formation and graph quantification of area stained by P‐selectin using MPIOs in ipsilateral (ischemic) normalize to contralateral (healthy) cortex in percentage. Data represent mean ± SEM (n = 10–11 mice per group; *P < 0.05; unpaired t‐test with Welch's correction).
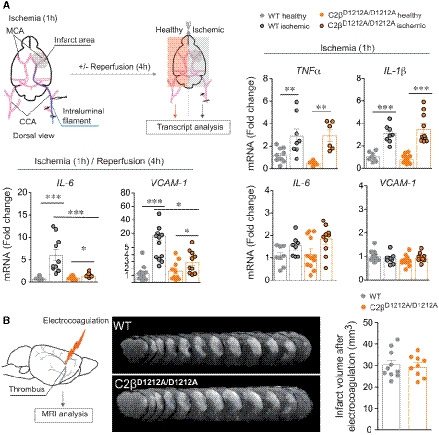
Gene expression of TNFα (n = 8–10 mice for WT and n = 6 mice for C2βD1212A/D1212A), IL‐1β (n = 8 mice for WT and n = 10–12 mice for C2βD1212A/D1212A), IL‐6 (n = 8 mice for WT and n = 10–12 mice for C2βD1212A/D1212A), and VCAM‐1 (n = 8–10 mice for WT and n = 10 mice for C2βD1212A/D1212A) after 1 h of ischemia without reperfusion (right panel). Gene expression of IL‐6 (n = 10–12 mice for WT and n = 8 mice for C2βD1212A/D1212A) and VCAM‐1 (n = 12 mice for WT and n = 10 mice for C2βD1212A/D1212A) after 1 h of ischemia followed by 4 h of reperfusion (bottom, left panel) on WT and C2βD1212A/D1212A mice. The mRNA levels are given as the fold increase normalized to PGK1 relative to the healthy contralateral hemisphere of WT mice. Data represent mean ± SEM (***P < 0.001, **P < 0.01, and *P < 0.05, Mann–Whitney test or unpaired t‐test, as accordance).
Representative photographs of T2‐weighted MRI of WT and C2βD1212A/D1212A mice and graph quantification of ischemic lesion after 24 h permanent MCAO (electrocoagulation model). Data represent mean ± SEM (n = 9–10 mice per group; ns, unpaired t‐test).
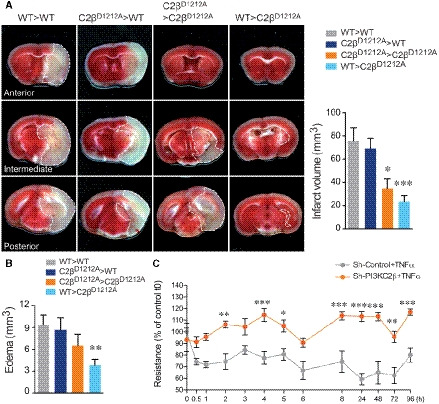
- A, B
Representative photographs of coronal brain sections and graph quantification of infarct volume (dashed white line) measurements (A) and edema volume (B) in bone marrow (BM) chimeric mice 24 h after tMCAO. WT > WT: transplantation of WT BM into WT hosts; C2βD1212A > WT: transplantation of C2βD1212A/D1212A BM into WT hosts; C2βD1212A > C2βD1212A: transplantation of C2βD1212A/D1212A BM into C2βD1212A/D1212A hosts; and WT > C2βD1212A: transplantation of WT BM into kinase‐dead hosts. Data represent mean ± SEM; n = 13–16 mice per group; *P < 0.05; **P < 0.01; ***P < 0.001 vs WT > WT, Mann–Whitney test or unpaired t‐test, as accordance.
- C
Sh‐control or sh‐PI3KC2β hCMEC/D3 cells were cultured on Transwell and stimulated with TNFα over the time. Trans‐endothelial electrical resistance (TEER) was measured with a voltohmeter Millicell ERS‐2 at the indicated time. Data are shown in percentage of control at t0 ± SEM (n = 4 independent experiments). ***P < 0.001; **P < 0.01; *P < 0.05, significance differences from control, two‐way ANOVA with Bonferroni post‐test.
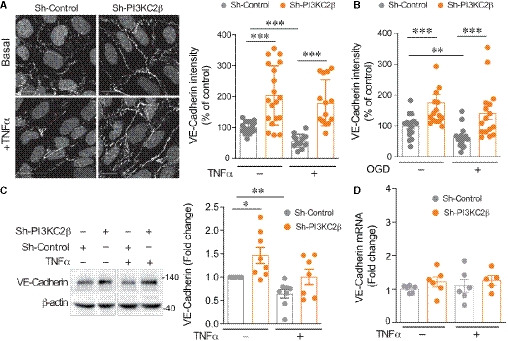
Representative VE‐cadherin staining and graph quantification of fluorescence intensity normalized to total number of cells per field (DAPI labeling) in sh‐control and sh‐PI3KC2β hCMEC/D3 in resting condition and after 24 h activation with 25 ng/ml of TNFα. Control normalized to 100%. Scale bar, 15 µm. Data represent mean ± SEM of cell fields randomly selected (dots n = 14–19). Data are collected from four to five independent experiments; ***P < 0.001, unpaired t‐test.
Graph quantification of fluorescence intensity of VE‐cadherin normalized to total cell number per field (DAPI labeling) in control condition and after 5 h in oxygen‐glucose deprivation (OGD) condition. Control normalized to 100%. Data represent mean ± SEM of cell fields randomly selected (dots n = 16). Data were collected from five independent experiments; ***P < 0.001; **P < 0.01, Mann–Whitney test.
Representative Western blot and graph quantification of VE‐cadherin from resting or activated (TNFα) cells. Lanes were run on the same gel but were noncontiguous. Densitometric measurements (mean ± SEM) normalized to actin; control normalized to 1 (n = 7–8 independent experiments); **P < 0.01; *P < 0.05, one‐sample t‐test.
Gene expression of VE‐cadherin (CDH5) from sh‐control and sh‐PI3KC2β hCMEC/D3 cells in resting condition or after 6 h of stimulation with TNFα. The mRNA levels are given as fold change to resting control hCMEC/D3 cells normalized to PGK1. Data represent mean ± SEM of n = 3 independent experiments in duplicate; for sh‐PI3KC2β + TNFα, n = 3 independent experiments with only two experiments in duplicate. No significant changes between conditions were noted (Mann–Whitney test).
- A
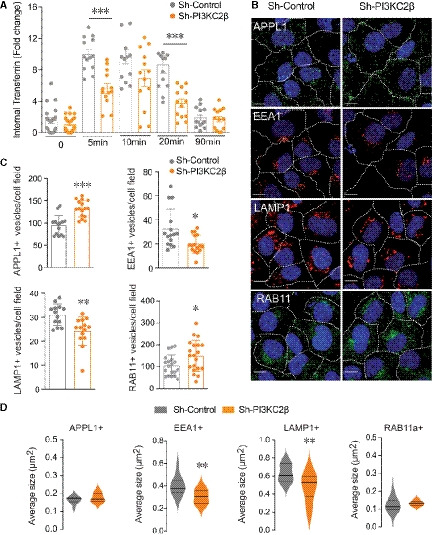
Quantification of internal transferrin in sh‐control or sh‐PI3KC2β cells at different incubation time points (ImageJ software). Results are expressed as fold change of internalized Alexa Fluor®546‐transferrin. Data represent mean ± SEM of cell fields randomly selected (dots n = 13–20). Data are collected from 4 independent experiments. ***P < 0.001 Mann–Whitney test.
- B
Analysis of APPL1, EEA1, LAMP1, and Rab11a staining in sh‐control and sh‐PI3KC2β hCMEC/D3 cells. White dotted lines delineate cells; scale bar, 10 µm; nuclei are shown in blue (DAPI).
- C, D
Quantification was performed to determine number (C) and average size (D) of positive vesicles per cell (ImageJ software). Nuclei are shown in blue (DAPI). Data represent mean ± SEM of cell fields randomly selected (n = 13–20 for (C) and n = 11–20 for (D)). Data are collected from at least 3–4 independent experiments. For violin plots (D), thick lines represent median and thin lines interquartile; ***P < 0.001; **P < 0.01; *P < 0.05, unpaired t‐test or Mann–Whitney, as accordance.
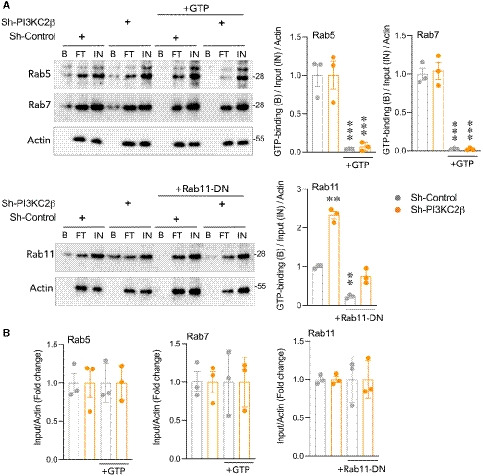
Impact of PI3KC2β on Rab5, Rab7, and Rab11 activity by monitoring pull‐down assay. Lysates extracted from sh‐control and sh‐PI3KC2β were pulled down with GTP‐agarose beads and the precipitate proteins with the beads were analyzed by immunoblotting with anti‐Rab5, anti‐Rab7, and anti‐Rab11 antibodies. As control, excess of GTP or dominant‐negative form of Rab11a (Rab11‐DN) were used. FT: Flow through, IN: total extracts (input); and B, beads (activate form of GTPase). Results are from three independent experiments for both genotypes. A representative experiment is shown. Data represent mean ± SEM of n = 3 independent experiments. ***P < 0.001, **P < 0.01, one‐sample t‐test.
Protein level of Rab5, Rab7, and Rab11 in the total cell lysate (input, IN). Data represent mean ± SEM (n = 3 independent experiments).
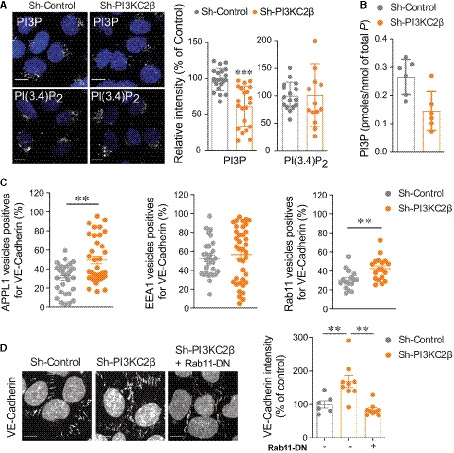
Representative images of PI3P and PI(3,4)P2 labeling and quantification using mCherry‐FYVEHRS and GFP‐PH(TAPP1) probes, respectively, in sh‐control or sh‐PI3KC2β hCMEC/D3. Scale bar, 10 µm. Nuclei are shown in blue (DAPI). Staining intensity was quantified by ImageJ software and normalized to total number of cells (DAPI labeling) per field. Data represent mean ± SEM of cell fields randomly selected for PI3P (dots n = 21) and for PI(3,4)P2 (dots n = 14–16). Data were collected from at least five independent experiments; ***P < 0.001, unpaired t‐test with Welch's correction.
Quantification of total cellular PI3P levels in sh‐control or sh‐PI3KC2β hCMEC/D3 cells by mass assay. Results are expressed as pmoles of PI3P/nmoles of total phosphore. Data represent mean ± SD (n = 2 independent experiments in triplicate).
Graph quantification of APPL1, EEA1, and Rab11 endosomes colocalized with mCitrin‐VE‐cadherin in sh‐control and sh‐PI3KC2β hCMEC/D3 cells. Data are shown as percentage of total count endosomes per cell. Data are expressed as mean ± SEM (n = 33–35 cells for APPL1 and EEA1 endosomes and n = 16–18 cells for Rab11 endosomes; three independent experiments); **P < 0.001, Mann–Whitney test or unpaired t‐test, as accordance.
Representative confocal microscopic images of VE‐cadherin immunostaining in sh‐control cells, sh‐PI3KC2β cells or sh‐PI3KC2β cells transduced with Rab11S25N (Rab11‐DN). Graph quantification of VE‐cadherin; control normalized to 100%. Scale bar, 10 µm. Data represent mean ± SEM of cell fields randomly selected (dots n = 6–9). Data are collected from at least three independent experiments; **P < 0.01 Mann–Whitney test.
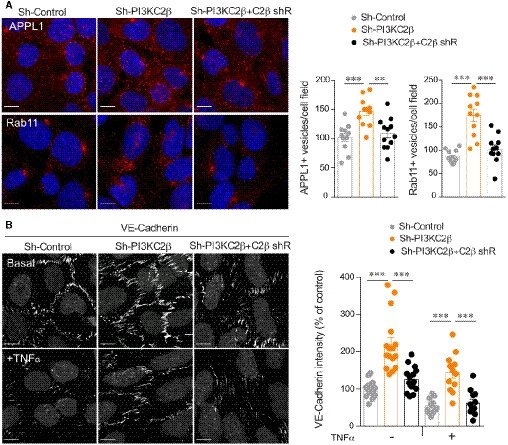
Representative APPL1 and Rab11 endosomes staining and quantification of fluorescence intensity normalized to total number of cells per field (DAPI labeling) in sh‐control, sh‐PI3KC2β and sh‐PI3KC2β hCMEC/D3 re‐expressing PI3KC2β (sh‐PI3KC2β + C2β shR). Control normalized to 100%. Scale bar, 10 µm. Data represent mean ± SEM cell fields randomly selected (dots n = 11–12). Data are collected from at least three independent experiments; ***P < 0.001; **P < 0.01, unpaired t‐test.
Representative VE‐cadherin staining and graph quantification of fluorescence intensity normalized to total number of cells per field (DAPI labeling) in sh‐control, sh‐PI3KC2β, and sh‐PI3KC2β hCMEC/D3 re‐expressing PI3KC2β (sh‐PI3KC2β + C2β shR) in resting condition and after 24 h activation with 25 ng/ml of TNFα. Control normalized to 100%. Scale bar, 10 µm. Data represent mean ± SEM of cell fields randomly selected (dots n = 12–16). Data are collected from at least three independent experiments; ***P < 0.001, unpaired t‐test.
Similar articles
-
Rab11a Mediates Vascular Endothelial-Cadherin Recycling and Controls Endothelial Barrier Function.Arterioscler Thromb Vasc Biol. 2016 Feb;36(2):339-49. doi: 10.1161/ATVBAHA.115.306549. Epub 2015 Dec 10. Arterioscler Thromb Vasc Biol. 2016. PMID: 26663395 Free PMC article.
-
CD93 maintains endothelial barrier function by limiting the phosphorylation and turnover of VE-cadherin.FASEB J. 2023 Apr;37(4):e22894. doi: 10.1096/fj.202201623RR. FASEB J. 2023. PMID: 36961390
-
SCUBE2 regulates adherens junction dynamics and vascular barrier function during inflammation.Cardiovasc Res. 2024 Nov 5;120(13):1636-1649. doi: 10.1093/cvr/cvae132. Cardiovasc Res. 2024. PMID: 38870316
-
Rap1 Small GTPase Regulates Vascular Endothelial-Cadherin-Mediated Endothelial Cell-Cell Junctions and Vascular Permeability.Biol Pharm Bull. 2021;44(10):1371-1379. doi: 10.1248/bpb.b21-00504. Biol Pharm Bull. 2021. PMID: 34602545 Review.
-
Endothelial permeability and VE-cadherin: a wacky comradeship.Cell Adh Migr. 2014;8(2):158-64. doi: 10.4161/cam.29026. Cell Adh Migr. 2014. PMID: 25422846 Free PMC article. Review.
Cited by
-
Targeting Class I-II-III PI3Ks in Cancer Therapy: Recent Advances in Tumor Biology and Preclinical Research.Cancers (Basel). 2023 Jan 27;15(3):784. doi: 10.3390/cancers15030784. Cancers (Basel). 2023. PMID: 36765741 Free PMC article. Review.
-
Beyond PI3Ks: targeting phosphoinositide kinases in disease.Nat Rev Drug Discov. 2023 May;22(5):357-386. doi: 10.1038/s41573-022-00582-5. Epub 2022 Nov 14. Nat Rev Drug Discov. 2023. PMID: 36376561 Free PMC article. Review.
-
Ischemia Reperfusion Injury Induced Blood Brain Barrier Dysfunction and the Involved Molecular Mechanism.Neurochem Res. 2023 Aug;48(8):2320-2334. doi: 10.1007/s11064-023-03923-x. Epub 2023 Apr 5. Neurochem Res. 2023. PMID: 37017889 Review.
-
Nanofiber/hydrogel core-shell scaffolds with three-dimensional multilayer patterned structure for accelerating diabetic wound healing.J Nanobiotechnology. 2022 Jan 8;20(1):28. doi: 10.1186/s12951-021-01208-5. J Nanobiotechnology. 2022. PMID: 34998407 Free PMC article.
-
Advances in brain barriers and brain fluids research in 2021: great progress in a time of adversity.Fluids Barriers CNS. 2022 Jun 9;19(1):48. doi: 10.1186/s12987-022-00343-x. Fluids Barriers CNS. 2022. PMID: 35681151 Free PMC article.
References
-
- Ades EW, Candal FJ, Swerlick RA, George VG, Summers S, Bosse DC, Lawley TJ (1992) HMEC‐1: establishment of an immortalized human microvascular endothelial cell line. J Invest Dermatol 99: 683–690 - PubMed
-
- Bederson JB, Pitts LH, Tsuji M, Nishimura MC, Davis RL, Bartkowski H (1986) Rat middle cerebral artery occlusion: evaluation of the model and development of a neurologic examination. Stroke 17: 472–476 - PubMed
-
- Bilanges B, Posor Y, Vanhaesebroeck B (2019) PI3K isoforms in cell signalling and vesicle trafficking. Nat Rev 20: 515–534 - PubMed
-
- Braeuninger S, Kleinschnitz C, Nieswandt B, Stoll G (2012) Focal cerebral ischemia. Methods Mol Biol 788: 29–42 - PubMed
Publication types
MeSH terms
Substances
Grants and funding
LinkOut - more resources
Full Text Sources
Other Literature Sources
Molecular Biology Databases
Research Materials
