. 2021 Apr 5:2021:8871308.
doi: 10.1155/2021/8871308. eCollection 2021.

Different Neurogenic Potential in the Subnuclei of the Postnatal Rat Cochlear Nucleus

Affiliations

Different Neurogenic Potential in the Subnuclei of the Postnatal Rat Cochlear Nucleus

Johannes Voelker et al. Stem Cells Int. .

Abstract

In patients suffering from hearing loss, the reduced or absent neural input induces morphological changes in the cochlear nucleus (CN). Neural stem cells have recently been identified in this first auditory relay. Afferent nerve signals and their impact on the immanent neural stem and progenitor cells already impinge upon the survival of early postnatal cells within the CN. This auditory brainstem nucleus consists of three different subnuclei: the anteroventral cochlear nucleus (AVCN), the posteroventral cochlear nucleus (PVCN), and the dorsal cochlear nucleus (DCN). Since these subdivisions differ ontogenetically and physiologically, the question arose whether regional differences exist in the neurogenic niche. CN from postnatal day nine Sprague-Dawley rats were microscopically dissected into their subnuclei and cultivated in vitro as free-floating cell cultures and as whole-mount organ cultures. In addition to cell quantifications, immunocytological and immunohistological studies of the propagated cells and organ preparations were performed. The PVCN part showed the highest mitotic potential, while the AVCN and DCN had comparable activity. Specific stem cell markers and the ability to differentiate into cells of the neural lineage were detected in all three compartments. The present study shows that in all subnuclei of rat CN, there is a postnatal neural stem cell niche, which, however, differs significantly in its potential. The results can be explained by the origin from different regions in the rhombic lip, the species, and the various analysis techniques applied. In conclusion, the presented results provide further insight into the neurogenic potential of the CN, which may prove beneficial for the development of new regenerative strategies for hearing loss.


Conflict of interest statement

We declare that we have no financial interests that might be relevant to the submitted work.

Figures

Figure 1
Figure 1
The dissected CN subnuclei form neurospheres in free-floating cell cultures in NSC medium. (a) Schematic overview of the topographical arrangement of the CN subnuclei, the auditory nerve, and the cochlea (AVCN = anteroventral cochlear nucleus; PVCN = posteroventral cochlear nucleus; DCN = dorsal cochlear nucleus). The tonotopic organization of the N.VIII fibers is maintained in all subnuclei. (b) Microscopic reflected light image of a PND 9 CN preparation and labeling of the subnuclei and the cochlear nerve (N.VIII) before dissection. (c) Dissociated cells of the CN subnuclei form neurospheres in free-floating cell cultures under the influence of EGF and bFGF. The quantitative evaluation after 30 days showed that the PVCN has the significantly greatest potential for the formation of neurospheres with 17.9 ± 1.9 (n = 5; mean ± SD) spheres per 1000 initially cultured single cells. (d) Evaluation of the neurosphere diameters after 4 weeks in free-floating cultures. The diameters averaged 101.2-122.6 μm. No significant differences were found between the subnuclei. Box plots show the median with the upper and lower quartiles, and whiskers mark the upper and lower maximum values; asterisks indicate the significance level: p < 0.05, ∗∗p < 0.005, ∗∗∗p < 0.001, and ∗∗∗∗p < 0.0001.
Figure 2
Figure 2
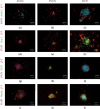
Neurospheres from all CN subnuclei contain neural progenitor cells. These spheres adhered to glass coverslips, coated with poly-d-lysine and laminin-1. After 48 h in NSC medium, these showed centrifugally outgrowing branches and emigrating cells, stained for β-tubulin. Cells in the neurospheres of all subnuclei showed a positive staining for the transcription factors Atoh-1 (a–c) and Sox-2 (d–f). (g–i) Neural stem cells were identified by the markers DCX (doublecortin) and nestin (j–l). Cell nuclei were stained with DAPI.
Figure 3
Figure 3
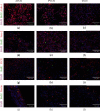
Neural stem cells of all CN subnuclei can differentiate into the cell forms of the neuroectodermal line. (a–c) Undifferentiated cells showed a positive staining for the progenitor cell marker nestin. (d–f) Neuronally differentiated cells were identified by β-III-tubulin staining (red). These cells had slim, spindle-shaped, neuron-typical somata with bi- and multipolar formations. (g–i) Astrocytes were identified by GFAP staining (glial fibrillary acidic protein). These cells showed an astrocyte-typical stellate-shaped formation with multipolar branches. (j–l) Oligodendrocytes were stained with MBP (myelin basic protein). These showed a beginning myelinization of the peripheral processes, while the still unmyelinated cell bodies were stained β-tubulin (β-T) positive. Cell nuclei were stained with DAPI.
Figure 4
Figure 4
Propagated stem cells of all subnuclei express markers of the neuroectodermal lines after an eight-day differentiation phase. It was examined whether there are relevant differences in differentiation in cultures of the different regions. The marker β-III-tubulin identifies neuronally differentiated cells. Astrocytes show expression of GFAP, and oligodendrocytes can be identified immunohistochemically by MBP. (a) AVCN, PVCN, and DCN showed, on average, 26-32% β-III-tubulin-positive neurons (mean; n = 3). (b) The majority of the cells were glial differentiated and GFAP positively stained (38-39%) (mean; n = 3). (c) MBP-positive labeled oligodendrocytes were present in 28-31% of the cells of the subnuclei (mean; n = 3). There were no significant differences in the rates of neural stem cell differentiation between the CN subnuclei. (d–f) Intraindividual analysis of the relations of differentiation markers. Significant variances in differentiation were found in progenitor cells from AVCN and PVCN. Most of the cells expressed the glial cell marker GFAP, followed by oligodendrocytes (MBP). The smallest part of the cells showed neuronal differentiation with β-III-tubulin expression. The same tendency emerged in the area of the DCN. Box plots show the median with the upper and lower quartiles, and whiskers mark the upper and lower maximum values; asterisks indicate the significance level: p < 0.05, ∗∗p < 0.005, ∗∗∗p < 0.001, and ∗∗∗∗p < 0.0001.
Figure 5
Figure 5
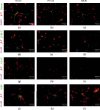
Neurogenesis in the CN subnuclei. Preparations from PND 9 animals were incubated as whole-mount organ cultures for 48 h in stem cell medium and the S phase marker BrdU. The immunohistological analysis showed the expression of neural stem cell markers and mitotic activity of individual cells. The transcription factors Atoh-1 and Sox-2 as well as the neural stem cell markers DCX and nestin were detected in preparations from all subnuclei. All whole-mount organ cultures showed a BrdU uptake of individual cells after an incubation period of 48 h. Cell nuclei were stained with DAPI.
Figure 6
Figure 6
The whole-mount organ cultures of CN subnuclei showed a different mitotic capacity in the BrdU assay. A positive BrdU staining of individual cells was demonstrated in all examined preparations. The AVCN had an average of 4.7 ± 1.5 BrdU (+) cells/106μm3. The PVCN had with 9 ± 3.9 BrdU (+) cells significantly the highest mitotic activity (mean ± SD); the DCN contained 3.1 ± 1.4 BrdU (+) cells/106μm3 (n = 9). Box plots demonstrate the median with the upper and lower quartiles, and whiskers mark the upper and lower maximum values; asterisks indicate the significance level: p < 0.05, ∗∗p < 0.005, ∗∗∗p < 0.001, and ∗∗∗∗p < 0.0001.
Figure 7
Figure 7
Representative illustration of the flow cytometry analysis with propidium iodide and anti-phospho-histone-H3 from AVCN, PVCN, and DCN NSCs. (a–c) Population of vital cells (P1) in the plot according to width by the area of propidium iodide's fluorescence intensity. P2 shows the population with double DNA content of the G2 and M phases. (d–f) Plot of the population of viable cells gated according to propidium iodide (width) by phospho-histone-H3 (height). P3 shows the population of viable cells with double DNA content—simultaneously stained positively with anti-phospho-histone-H3. (g–i) Histogram of the propidium iodide fluorescence (height) in the viable cell population for quantifying the cell cycle: P4 corresponds to the G0/G1 phase, P5 corresponds to the S phase, and P6 corresponds to the G2 /M phase.
Figure 8
Figure 8
Quantification of flow cytometry analyses from CN NSCs—divided into AVCN, PVCN, and DCN. (a) Quantification of propidium iodide cytometry populations: G2/M, S, and G0/G1 phase. The significantly largest proportion of cells in the G0/S1 phase was determined in the DCN, and the smallest proportion in the AVCN. There were no significant differences between the fractions in the S phase. The largest proportion of cells in the G2/M phase was found in the AVCN, and the smallest in the DCN. (b) Quantification of the G2/M phase population and the proportion of anti-phospho-histone-H3-positive cells. Within the G2/M phase populations, the PVCN showed the significantly largest proportion of cells in which the mitotic marker phospho-histone-H3 was stained positively. The smallest share was in the AVCN. The bar graphs demonstrate the median values; asterisks indicate the significance level: p < 0.05, ∗∗p < 0.005, ∗∗∗p < 0.001, and ∗∗∗∗p < 0.0001; n = 3.
Figure 9
Figure 9
Propagated single cells of all CN subnuclei express neural stem cell markers. Analysis of the distribution of neural stem cell markers of single-cell cultures of CN subnuclei—obtained from neurosphere cultures over 4 weeks. The graphs show the proportions of cells positively marked after 24 h. The β-tubulin-positive cells were evaluated as absolute cell numbers. (a) Atoh-1 was stained positively on average in 50–82% of the grown single cells of AVCN, PVCN, and DCN (n = 3; mean). There were no significant differences between the subnuclei. (b) On average, 6% of the single cells of the AVCN, 28% of the PVCN, and 74% of the DCN were labeled Sox-2-positive (n = 3). The expression of this transcription factor was shown most frequently in dissociated cells of the DCN cultures. (c) The progenitor cell marker doublecortin (DCX) was expressed on average from 54–58% of the plated single cells—without significant differences among the subnuclei (n = 3). (d) The neural stem cell marker nestin was expressed on average by 58% of the plated single cells of the AVCN, by 84% of the PVCN, and by 37% of the DCN. The PVCN significantly showed the highest proportion of positively labeled single cells (n = 3). Box plots show the median with the upper and lower quartiles, and whiskers mark the upper and lower maximum values; asterisks indicate the significance level: p < 0.05, ∗∗p < 0.005, ∗∗∗p < 0.001, and ∗∗∗∗p < 0.0001.

Similar articles

Cited by

References

    1. Illing R. B. Activity-dependent plasticity in the adult auditory brainstem. Audiology & Neuro-Otology. 2001;6(6):319–345. doi: 10.1159/000046844. - DOI - PubMed
    1. Moore J. K., Niparko J. K., Miller M. R., Linthicum F. H. Effect of profound hearing loss on a central auditory nucleus. The American Journal of Otology. 1994;15(5):588–595. - PubMed
    1. Kandel E., Schwartz J., Jessell T., Siegelbaum S., Hudspeth A. J. Principles of Neural Science. McGraw-Hill Professional: Fifth Edition; 2012.
    1. Fitzakerley J. L., Schweitzer L. Morphology of neurons cultured from subdivisions of the mouse cochlear nucleus. Cell and Tissue Research. 2003;311(2):145–158. doi: 10.1007/s00441-002-0690-0. - DOI - PubMed
    1. Campagnola L., Manis P. B. A map of functional synaptic connectivity in the mouse anteroventral cochlear nucleus. Journal of Neuroscience: The Official Journal of the Society for Neuroscience. 2014;34(6):2214–2230. doi: 10.1523/JNEUROSCI.4669-13.2014. - DOI - PMC - PubMed

LinkOut - more resources