How accurately can we assess zoonotic risk?
- PMID: 33878111
- PMCID: PMC8057571
- DOI: 10.1371/journal.pbio.3001135
How accurately can we assess zoonotic risk?
Abstract
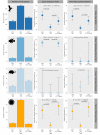
Identifying the animal reservoirs from which zoonotic viruses will likely emerge is central to understanding the determinants of disease emergence. Accordingly, there has been an increase in studies attempting zoonotic "risk assessment." Herein, we demonstrate that the virological data on which these analyses are conducted are incomplete, biased, and rapidly changing with ongoing virus discovery. Together, these shortcomings suggest that attempts to assess zoonotic risk using available virological data are likely to be inaccurate and largely only identify those host taxa that have been studied most extensively. We suggest that virus surveillance at the human-animal interface may be more productive.
Conflict of interest statement
The authors have declared that no competing interests exist
Figures


Similar articles
-
Host and viral traits predict zoonotic spillover from mammals.Nature. 2017 Jun 29;546(7660):646-650. doi: 10.1038/nature22975. Epub 2017 Jun 21. Nature. 2017. PMID: 28636590 Free PMC article.
-
Spillover and pandemic properties of zoonotic viruses with high host plasticity.Sci Rep. 2015 Oct 7;5:14830. doi: 10.1038/srep14830. Sci Rep. 2015. PMID: 26445169 Free PMC article.
-
Targeting surveillance for zoonotic virus discovery.Emerg Infect Dis. 2013 May;19(5):743-7. doi: 10.3201/eid1905.121042. Emerg Infect Dis. 2013. PMID: 23647732 Free PMC article.
-
Public health awareness of emerging zoonotic viruses of bats: a European perspective.Vector Borne Zoonotic Dis. 2006 Winter;6(4):315-24. doi: 10.1089/vbz.2006.6.315. Vector Borne Zoonotic Dis. 2006. PMID: 17187565 Review.
-
An ecological and conservation perspective on advances in the applied virology of zoonoses.Viruses. 2011 Apr;3(4):379-397. doi: 10.3390/v3040379. Epub 2011 Apr 15. Viruses. 2011. PMID: 21994738 Free PMC article. Review.
Cited by
-
Animal alphacoronaviruses found in human patients with acute respiratory illness in different countries.Emerg Microbes Infect. 2022 Dec;11(1):699-702. doi: 10.1080/22221751.2022.2040341. Emerg Microbes Infect. 2022. PMID: 35156544 Free PMC article. Review.
-
Characterizing and Evaluating the Zoonotic Potential of Novel Viruses Discovered in Vampire Bats.Viruses. 2021 Feb 6;13(2):252. doi: 10.3390/v13020252. Viruses. 2021. PMID: 33562073 Free PMC article.
-
Estimation of Ebola's spillover infection exposure in Sierra Leone based on sociodemographic and economic factors.PLoS One. 2022 Sep 1;17(9):e0271886. doi: 10.1371/journal.pone.0271886. eCollection 2022. PLoS One. 2022. PMID: 36048780 Free PMC article.
-
The one health perspective to improve environmental surveillance of zoonotic viruses: lessons from COVID-19 and outlook beyond.ISME Commun. 2022;2(1):107. doi: 10.1038/s43705-022-00191-8. Epub 2022 Oct 30. ISME Commun. 2022. PMID: 36338866 Free PMC article. Review.
-
RNA Viruses, Pandemics and Anticipatory Preparedness.Viruses. 2022 Sep 30;14(10):2176. doi: 10.3390/v14102176. Viruses. 2022. PMID: 36298729 Free PMC article. Review.
References
Publication types
MeSH terms
Grants and funding
LinkOut - more resources
Full Text Sources
Other Literature Sources
Medical

