. 2021 Jun 16;89(7):e0009421.
doi: 10.1128/IAI.00094-21. Epub 2021 Jun 16.

Inclusion Membrane Growth and Composition Are Altered by Overexpression of Specific Inclusion Membrane Proteins in Chlamydia trachomatis L2

Affiliations

Inclusion Membrane Growth and Composition Are Altered by Overexpression of Specific Inclusion Membrane Proteins in Chlamydia trachomatis L2

Macy G Olson-Wood et al. Infect Immun. .

Abstract

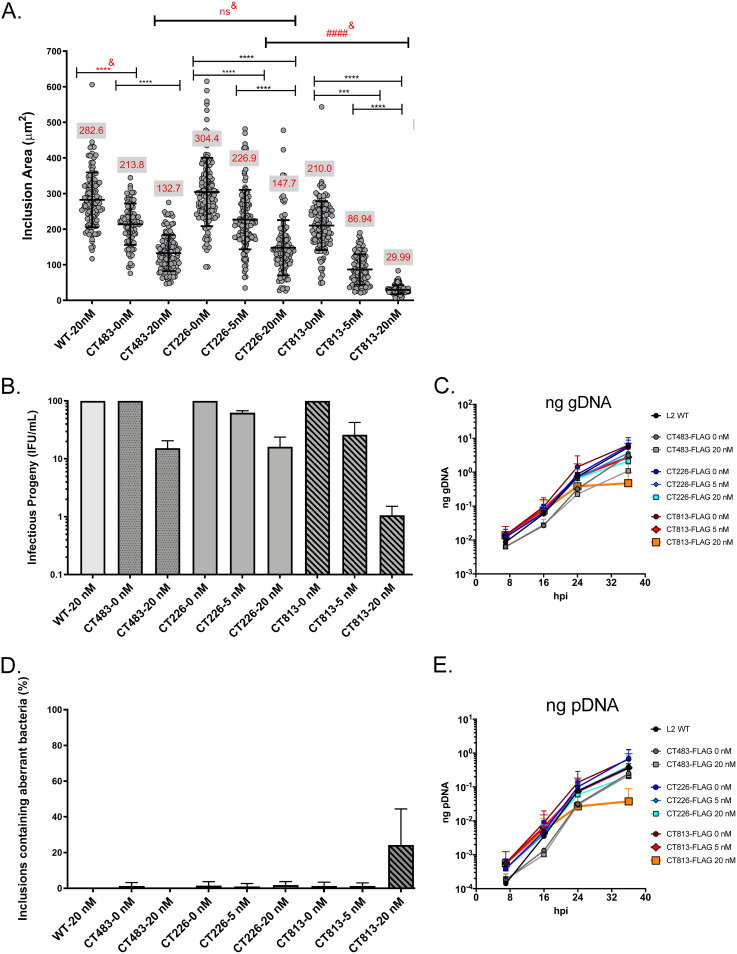
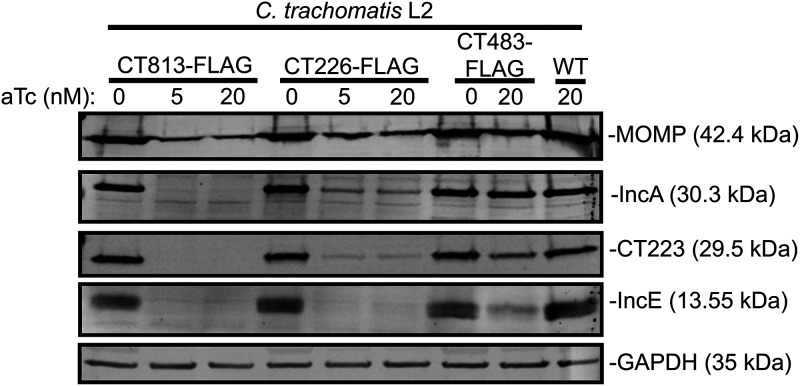
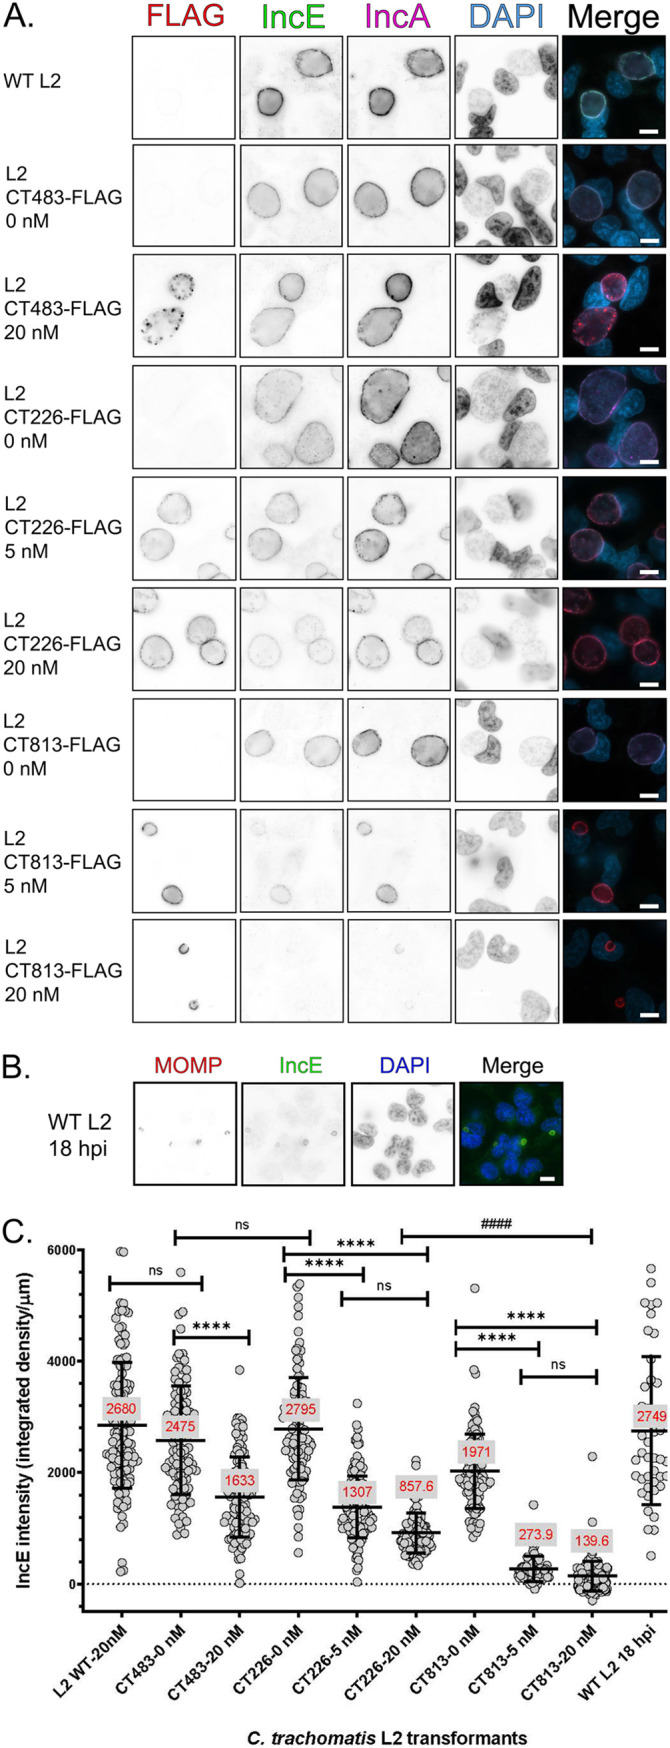
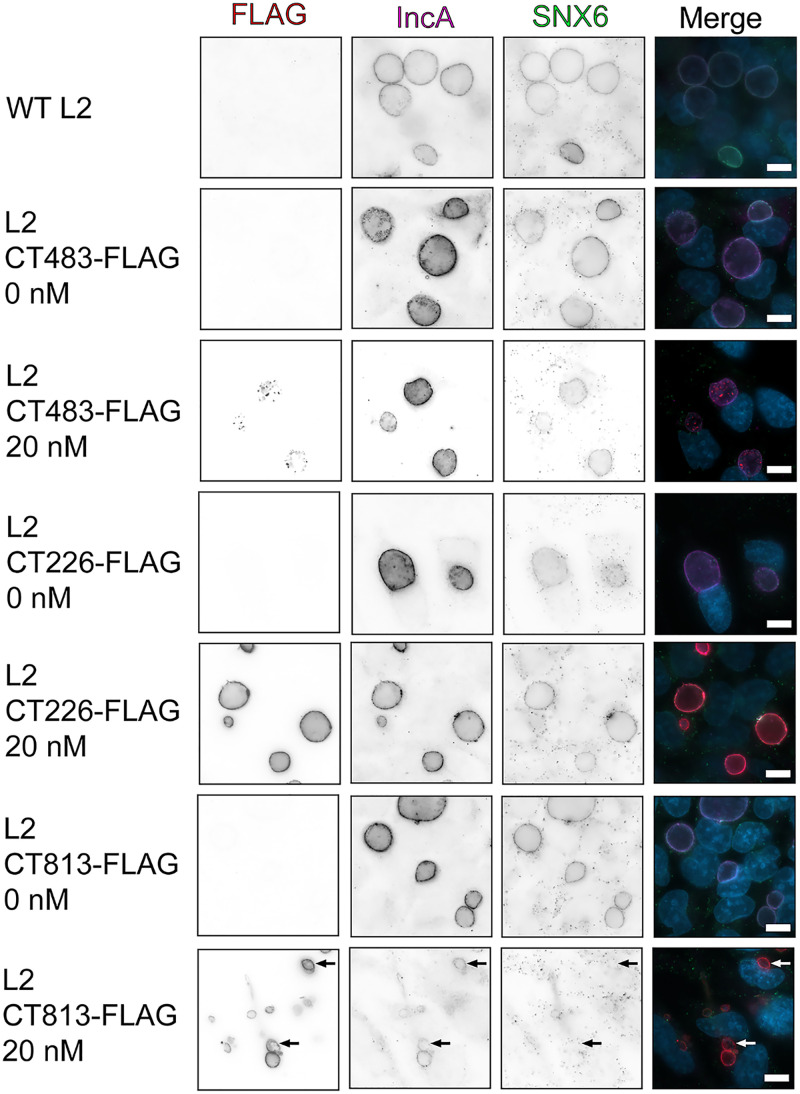
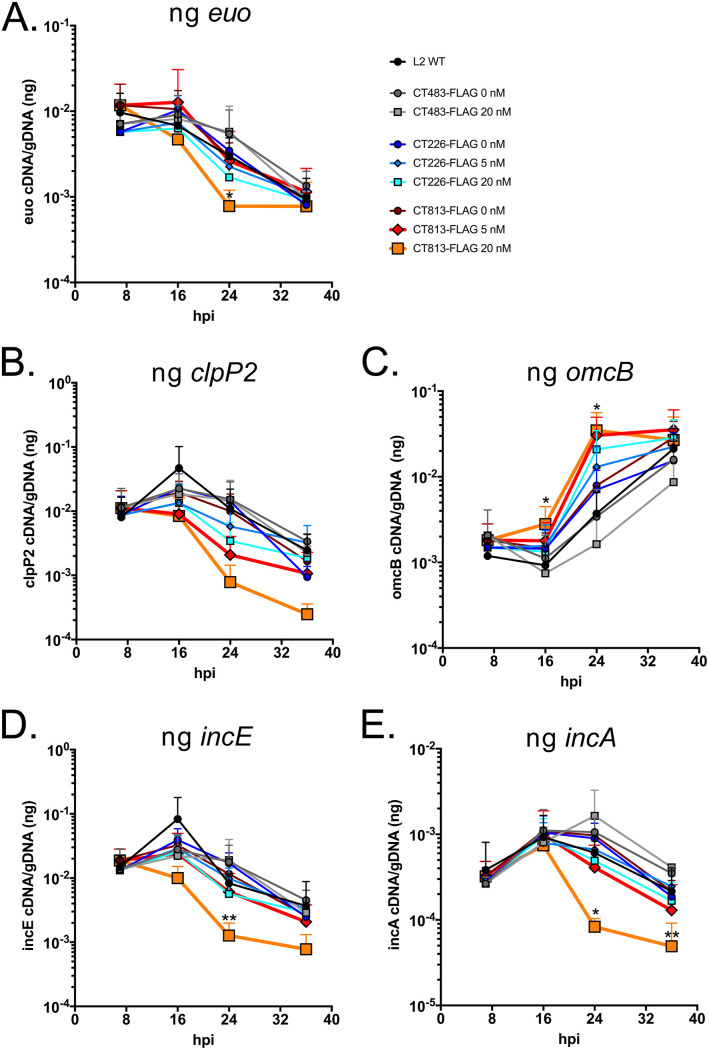
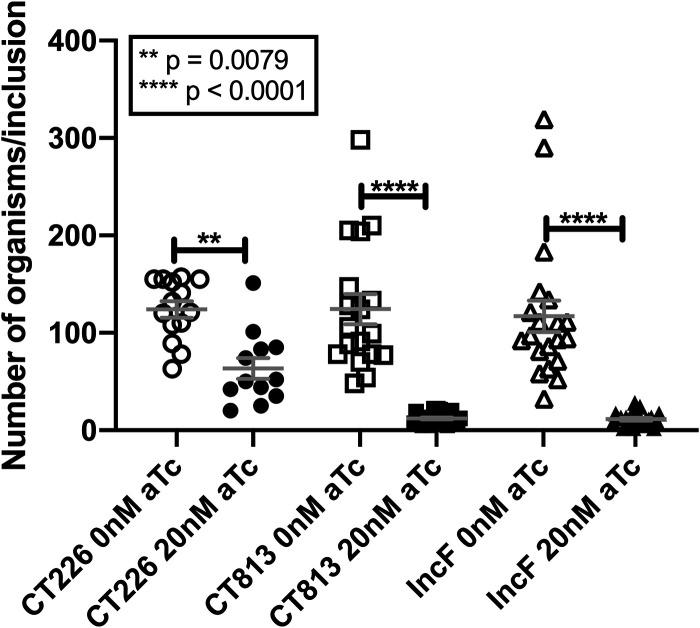
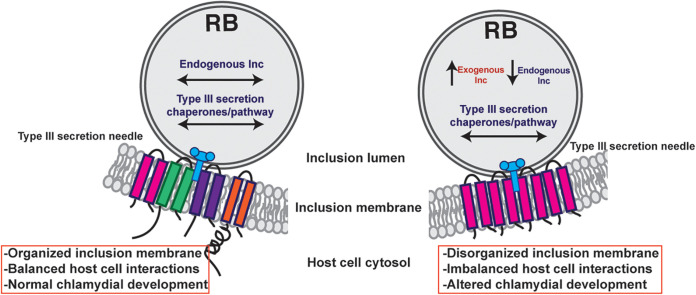
Chlamydia trachomatis is the leading cause of bacterial sexually transmitted infections. This obligate intracellular bacterium develops within a membrane-bound vacuole called an inclusion, which sequesters the chlamydiae from the host cytoplasm. Host-pathogen interactions at this interface are mediated by chlamydial inclusion membrane proteins (Incs). However, the specific functions of most Incs are poorly characterized. Previous work from our laboratories indicated that expressing an IncF fusion protein at high levels in C. trachomatis L2 negatively impacted inclusion expansion and progeny production. We hypothesize that some Incs function in the structure and organization of the inclusion membrane and that overexpression of those Incs will alter the composition of endogenous Incs within the inclusion membrane. Consequently, inclusion biogenesis and chlamydial development are negatively impacted. To investigate this, C. trachomatis L2 was transformed with inducible expression plasmids encoding IncF-, CT813-, or CT226-FLAG. Overexpression of IncF-FLAG or CT813-FLAG, but not CT226-FLAG, altered chlamydial development, as demonstrated by smaller inclusions, fewer progeny, and increased plasmid loss. The overexpression of CT813-FLAG reduced the detectable levels of endogenous IncE and IncG in the inclusion membrane. Notably, recruitment of sorting nexin-6, a eukaryotic protein binding partner of IncE, was also reduced after CT813 overexpression. Gene expression studies and ultrastructural analysis of chlamydial organisms demonstrated that chlamydial development was altered when CT813-FLAG was overexpressed. Overall, these data indicate that disrupting the expression of specific Incs changed the composition of Incs within the inclusion membrane and the recruitment of associated host cell proteins, which negatively impacted C. trachomatis development.

Keywords: Chlamydia trachomatis; Inc; chlamydia; developmental cycle; inclusion membrane; type III secretion.


Figures

FIG 1
FIG 1
Overexpression of CT813-FLAG from C. trachomatis L2 negatively impacts inclusion growth and progeny production. (A) HeLa cells seeded on coverslips were infected with C. trachomatis L2 CT813-FLAG, CT226-FLAG, or CT483-FLAG transformed strains or wild-type L2 and induced at 7 hpi with 5 or 20 nM aTc or not induced. Coverslips were methanol fixed at 36 hpi and stained for immunofluorescence to determine the inclusion area. The inclusion areas (μm2) with standard deviations were plotted and analyzed for statistical significance by an ordinary one-way ANOVA with Tukey’s multiple-comparison test using GraphPad Prism 8.4.0. These data are combined from three biological replicates. ####& indicates a significant difference between C. trachomatis L2 transformed strains induced with 20 nM aTc. ****&, P < 0.0001; ***, P = 0.0004; all P values reflect comparison to the control (wild-type and uninduced strains); ns, not significant. The red values in the gray box in panel A are the average inclusion area for each C. trachomatis L2 transformed strain. (B) Duplicate wells of HeLa cells were infected as described for panel A. At 36 hpi, infected monolayers were lysed, serially diluted, and infected onto a fresh monolayer of HeLa cells (i.e., secondary infection) in medium containing penicillin to enumerate infectious progeny (inclusion-forming units [IFU]/ml). Infectious progeny (IFU/ml) (normalized to uninduced strains and expressed as a percentage of uninduced from three biological replicates and standard deviation) were plotted and statistically analyzed (ordinary one-way ANOVA with Tukey’s multiple-comparison test using GraphPad Prism 8.4.0). Only inclusions containing normal (not aberrant) bacteria were enumerated. (C and E) HeLa cells were infected with C. trachomatis L2 CT813-FLAG, CT226-FLAG, or CT483-FLAG transformed strains, or wild-type C. trachomatis L2, and either not induced or induced at 7 hpi (5 nM or 20 nM aTc). DNA collected from separate wells of a 6-well plate at 7, 16, 24, and 36 hpi was processed as described in Materials and Methods. The genomic DNA (gDNA; ng) (C) and plasmid DNA (pDNA; ng) (E) data sets from three biological replicates were plotted using GraphPad Prism 8.4.0. The data are representative of three independent experiments. (D) Plasmid loss was indicated by inclusions containing aberrant bacteria in medium containing penicillin (i.e., sensitivity due to the loss of the plasmid-borne bla resistance gene). To enumerate the percentage of inclusions containing aberrant bacteria, the number of inclusions with aberrant bacteria was divided by the total number of inclusions counted (B) from three biological replicates and the standard deviation was plotted and statistically analyzed as described for panels A and B using GraphPad Prism 8.4.0. Differences were not statistically significant.
FIG 2
FIG 2
The overexpression of CT813-FLAG from C. trachomatis L2 results in decreased detectable IncA, CT223, and IncE. HeLa cells were infected with C. trachomatis L2 CT813-FLAG, CT226-FLAG, or CT483-FLAG transformed strains, or wild-type C. trachomatis L2, and either not induced or induced at 7 hpi (5 nM or 20 nM aTc). At 48 hpi, infected monolayers were lysed in 8 M urea supplemented with 1% SDS, 10 mM Tris-HCl (pH 7.4), 2.5% β-mercaptoethanol, and nuclease. Lysates were normalized for equal protein content, separated by SDS-PAGE, and transferred to PVDF to blot for chlamydial proteins, MOMP, IncA, CT223, and IncE. GAPDH was used as a loading control. These data are representative of three independent experiments.
FIG 3
FIG 3
The overexpression of CT813-FLAG from C. trachomatis L2 results in loss of detectable endogenous IncE in the inclusion membrane. (A) HeLa cells infected with C. trachomatis L2 transformed strains or wild-type L2 were induced with 5 or 20 nM aTc or not induced at 7 hpi. Coverslips were methanol fixed at 36 hpi and stained for immunofluorescence to observe expression of the constructs (FLAG; red), IncE (green), IncA (pink), or DNA (DAPI; blue) and imaged at ×63 magnification using the same exposure for each sample. Scale bar, 10 μm. Individual panels were converted to black and white and inverted to visualize the loss of IncE staining. These data are from three biological replicates. (B) C. trachomatis L2-infected HeLa cells were fixed at 18 hpi and stained for immunofluorescence to observe IncE (green), MOMP (red), and DNA (blue). Coverslips were imaged using the same exposure for each sample at ×63 magnification. Scale bar, 10 μm. (C) The intensity of IncE was measured using ImageJ from a minimum of 80 inclusions per experiment (see Materials and Methods). For each image, the background integrated density was subtracted from individual images, and the intensity was normalized to the inclusion perimeter (integrated density/μm). The mean integrated density/μm is reported in red for each sample measured. The intensity (integrated density/μm) and standard deviation were plotted using GraphPad Prism 8.4.0. Samples were analyzed for statistical significance using a one-way ANOVA and Tukey’s multiple-comparison test. ****, P < 0.0001 between C. trachomatis L2 transformed strains; ####, P < 0.0001 between C. trachomatis L2 transformed strains.
FIG 4
FIG 4
The overexpression of CT813-FLAG from C. trachomatis L2 results in reduced localization of endogenous SNX6 to the inclusion membrane. HeLa cells infected with C. trachomatis L2 transformed strains or wild-type L2 were induced at 7 hpi with 5 or 20 nM aTc or were not induced. Coverslips were methanol fixed at 30 hpi and stained for immunofluorescence to observe expression of the Inc-FLAG constructs (FLAG; red), SNX6 (green), IncA (pink), or DNA (DAPI; blue). Coverslips were imaged at ×63 magnification using the same exposure (scale bar, 10 μm). Arrows indicate C. trachomatis L2 CT813-FLAG inclusions that do not have SNX6. These data are representative of three independent experiments.
FIG 5
FIG 5
The overexpression of CT813-FLAG from C. trachomatis L2 results in reduced transcription of early and midcycle genes. HeLa cells were infected with C. trachomatis L2 CT813-FLAG, CT226-FLAG, or CT483-FLAG transformed strains, or wild-type C. trachomatis L2, and either not induced or induced at 7 hpi (5 nM or 20 nM aTc). RNA and DNA collected from separate wells of a 6-well plate at 7, 16, 24, and 36 hpi were processed as described in Materials and Methods. Normalized RNA was reverse transcribed to cDNA, and inc expression was measured by quantitative PCR. cDNA (ng) was normalized to genomic DNA (ng) for three biological replicates (except for clpP2, n = 2), and then these data were plotted using GraphPad Prism 8.4.0. Transcript profiles of early gene euo (A), midcycle gene clpP2 (B), late gene omcB (C), an early expressed inc gene, incE (D), and a midcycle inc gene, incA (E), are shown. Normalized transcripts from wild-type and C. trachomatis L2 CT813-FLAG were log transformed and then analyzed for statistical significance using a paired two-tailed Student's t test. Samples that were statistically analyzed were wild type and CT813 at 16 hpi (for omcB only), 24 hpi (all genes), and 36 hpi (all genes). Asterisks denote statistical significance: **, P ≤ 0.01; *, P ≤ 0.05.
FIG 6
FIG 6
The overexpression of CT813 and IncF from C. trachomatis L2 results in fewer organisms per inclusion. HeLa cells were infected with C. trachomatis L2, CT226-FLAG, CT813-FLAG, or IncF-FLAG transformed strains and either not induced or induced at 7 hpi (5 nM or 20 nM aTc). At 36 hpi, cells were fixed and processed for transmission electron microscopy as previously described (68). The graphed results are the mean with standard error of the mean and are combined data from two biological replicates with the following total numbers of inclusions analyzed: 14 for CT226–0 nM aTc, 12 for CT226–20 nM aTc, 18 for CT813–0 nM aTc, 27 for CT813–20 nM aTc, 20 for IncF–0 nM aTc, and 23 for IncF–20 nM aTc. The data were statistically analyzed in GraphPad Prism (version 8.4.3) using an ordinary one-way ANOVA with Tukey’s multiple-comparison test.
FIG 7
FIG 7
Model of the consequences of inc overexpression. In wild-type Chlamydia, inc expression is temporal, which results in an inclusion membrane that can expand with the growing number of organisms and optimal host-Chlamydia interactions that maximizes the amount of infectious progeny produced. When certain Incs, like IncF and CT813, are produced at high amounts, they are type III secreted and inserted in the inclusion membrane. It is unknown at this point if these exogenous Incs “flood” the type III secretion system at the expense of endogenous Incs, which causes a decrease in endogenous inc transcripts. The ultimate result is a disorganized inclusion membrane that has altered interactions with the host cell (e.g., loss of SNX6 recruitment) and, thus, altered chlamydial development. These data indicate that inclusion membrane dynamics, which includes inclusion membrane organization and the resulting Inc-host interactions, contributes to optimal chlamydial development.

Similar articles

Cited by

References

    1. CDC. 2017. Sexually transmitted disease surveillance 2017. CDC, Atlanta, GA.
    1. van Ooij C, Apodaca G, Engel J. 1997. Characterization of the Chlamydia trachomatis vacuole and its interaction with the host endocytic pathway in HeLa cells. Infect Immun 65:758–766. 10.1128/IAI.65.2.758-766.1997. - DOI - PMC - PubMed
    1. Heinzen RA, Scidmore MA, Rockey DD, Hackstadt T. 1996. Differential interaction with endocytic and exocytic pathways distinguish parasitophorous vacuoles of Coxiella burnetii and Chlamydia trachomatis. Infect Immun 64:796–809. 10.1128/IAI.64.3.796-809.1996. - DOI - PMC - PubMed
    1. Taraska T, Ward DM, Ajioka RS, Wyrick PB, Davis-Kaplan SR, Davis CH, Kaplan J. 1996. The late chlamydial inclusion membrane is not derived from the endocytic pathway and is relatively deficient in host proteins. Infect Immun 64:3713–3727. 10.1128/IAI.64.9.3713-3727.1996. - DOI - PMC - PubMed
    1. Rockey DD, Rosquist JL. 1994. Protein antigens of Chlamydia psittaci present in infected cells but not detected in the infectious elementary body. Infect Immun 62:106–112. 10.1128/IAI.62.1.106-112.1994. - DOI - PMC - PubMed

Publication types

MeSH terms

LinkOut - more resources