. 2021 Sep 20;49(16):9154-9173.
doi: 10.1093/nar/gkab217.

RbAp46/48LIN-53 and HAT-1 are required for initial CENP-AHCP-3 deposition and de novo holocentromere formation on artificial chromosomes in Caenorhabditis elegans embryos

Affiliations

RbAp46/48LIN-53 and HAT-1 are required for initial CENP-AHCP-3 deposition and de novo holocentromere formation on artificial chromosomes in Caenorhabditis elegans embryos

Zhongyang Lin et al. Nucleic Acids Res. .

Abstract

Foreign DNA microinjected into the Caenorhabditis elegans syncytial gonad forms episomal extra-chromosomal arrays, or artificial chromosomes (ACs), in embryos. Short, linear DNA fragments injected concatemerize into high molecular weight (HMW) DNA arrays that are visible as punctate DAPI-stained foci in oocytes, and they undergo chromatinization and centromerization in embryos. The inner centromere, inner kinetochore and spindle checkpoint components, including AIR-2, CENP-AHCP-3, Mis18BP1KNL-2 and BUB-1, respectively, assemble onto the nascent ACs during the first mitosis. The DNA replication efficiency of ACs improves over several cell cycles, which correlates with the improvement of kinetochore bi-orientation and proper segregation of ACs. Depletion of condensin II subunits, like CAPG-2 and SMC-4, but not the replicative helicase component, MCM-2, reduces de novo CENP-AHCP-3 level on nascent ACs. Furthermore, H3K9ac, H4K5ac and H4K12ac are highly enriched on newly chromatinized ACs. RbAp46/48LIN-53 and HAT-1, which affect the acetylation of histone H3 and H4, are essential for chromatinization, de novo centromere formation and segregation competency of nascent ACs. RbAp46/48LIN-53 or HAT-1 depletion causes the loss of both CENP-AHCP-3 and Mis18BP1KNL-2 initial deposition at de novo centromeres on ACs. This phenomenon is different from centromere maintenance on endogenous chromosomes, where Mis18BP1KNL-2 functions upstream of RbAp46/48LIN-53.


Figures

Figure 1.
Figure 1.
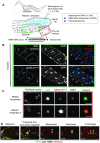
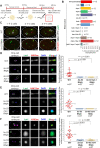
Chromatinization and de novo CENP-AHCP-3 formation in foreign HMW DNA arrays to form artificial chromosomes (ACs) in fertilized one-cell embryos. (A) A schematic diagram showing the delivery of short, linearized p64xLacO plasmid (L64xLacO) DNA into C. elegans gonad by microinjection. The foreign DNA are concatemerized to form HMW DNA arrays, which are then further chromatinized and centromerized to form artificial chromosomes (ACs). (B) In oocytes, DAPI stained six condensed bivalent endogenous chromosomes and multiple HMW DNA arrays, appearing as DAPI foci. Representative fluorescence images of the H2B::mCherry and immunofluorescence images of CENP-AHCP-3 on bivalent chromosomes. Yellow arrowheads indicate the HMW foreign DNA arrays without histone staining. Scale bar represents 10 μm. (C) Representative immunofluorescence images show that nascent artificial chromosomes (ACs) assembled from the HMW DNA arrays contain detectable CENP-AHCP-3 signals in one-cell embryos at meiosis I and II, respectively. White dash circles show the paternal and maternal DNA, and * represents the polar body. Scale bar represents 5 μm. A higher-magnification view of the representative AC (white square) is shown on the right, in which the scale bar represents 2 μm. (D) Time-lapse images following an AC (white arrowhead), which segregated during the first mitosis, but lagged, in one-cell embryos. The time lapses are shown (mm:ss). Scale bar represents 5 μm.
Figure 2.
Figure 2.
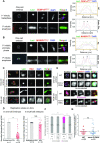
Impaired DNA replication causes centromere disorganization on ACs and anaphase bridges. (A andB) Immunofluorescence staining of ACs (LacI), inner kinetochore proteins, (A) CENP-AHCP-3 or (B) M18BP1KNL-2, and chromatin (DAPI) at metaphase and anaphase in one-cell embryos. Scale bar represents 5 μm. The selected white region is magnified on the right. A 3-μm line is drawn across the metaphase plate in the high magnification panels, and the signal intensities of CENP-AHCP-3 and M18BP1KNL-2 were measured across the AC (yellow line) and the endogenous chromosomes (white line). Scale bar in magnified panels represents 2 μm. The plot shows the line-scan signal intensities from each channel along the line. Green line: LacI; Red line: (A) CENP-AHCP-3 or (B) M18BP1KNL-2; Blue line: DAPI. The black arrowheads indicate the poleward bi-orientation of CENP-AHCP-3 on endogenous chromosomes. CENP-AHCP-3 on the AC lacks such bi-orientation at metaphase. (C) EdU staining of nascent ACs (LacI) in one-cell embryos at interphase, prophase and telophase, respectively, and in a multi-cell embryo. (D) Comparison of the average uptake of EdU after 15 min of incubation on endogenous chromosomes and nascent ACs in mitotic one-cell and multi-cell embryos, respectively. n equals the number of ACs or endogenous chromosomes together in one-cell or multi-cell embryos for calculating the mean of EdU integrated density. The bar chart shows the mean EdU signal (normalized to DAPI) on ACs relative to that on endogenous chromosomes. The error bars represent standard deviation (SD). Significant differences are analyzed by the Student’s t-test (**, P < 0.01; NS, not significant). (E) Immunofluorescence staining of CENP-AHCP-3 on ACs in untreated wild-type (WT) or mcm-2 RNAi-treated one-cell and multi-cell stage embryos during prometaphase. Scale bar represents 2 μm. CENP-AHCP-3 distributing on the entire AC is described as ‘un-bi-oriented’, while CENP-AHCP-3 on the poleward sides of the AC is described as ‘bi-oriented’. (F) Quantification of the percentage of ACs with un-bi-oriented or bi-oriented CENP-AHCP-3 in one-cell and multi-cell stage WT or mcm-2 RNAi-treated embryos. The number of ACs (n) analyzed was indicated. Significant differences are analyzed by the Fisher’s exact test (**, P < 0.01). (G) A scatter plot shows the quantification of integrated density of CENP-AHCP-3 signal on nascent ACs in WT and in mcm-2 RNAi-treated one-cell embryos. The number of ACs (n) analyzed was indicated. The error bars represent standard deviation (SD). Significant differences are analyzed by the Student’s t-test (NS, not significant).
Figure 3.
Figure 3.
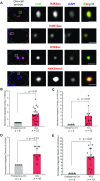
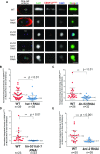
Depletion of condensin II reduces de novo CENP-AHCP-3 level on nascent ACs. (A andB) Immunofluorescence of CENP-AHCP-3 on ACs in WT and (A) smc-4 RNAi-treated and (B) cpag-1 or cpag-2 RNAi-treated one-cell embryos. Embryos were stained with antibodies against LacI (green), CENP-AHCP-3 (red) and DAPI (blue). Scale bar represents 5 μm. A higher magnification view of the AC (white square) is shown on the right. Scale bar represents 2 μm for the magnified images. (C andD) Scatter plots show the quantification of normalized integrated density of CENP-AHCP-3 signal on ACs in WT and (C) smc-4 RNAi-treated and (D) cpag-1 or cpag-2 RNAi-treated one-cell embryos. The integrated density was normalized with that of DAPI. The number of samples (n) analyzed is indicated. The error bars represent SD. Significant differences are analyzed by the Student’s t-test, **, P < 0.01.
Figure 4.
Figure 4.
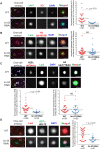
Profiling of histone post-translational modifications (PTMs) on nascent ACs in one-cell embryos by immunofluorescence staining. (A) Representative immunofluorescence images of H4K5ac, H4K12ac, H3K9ac and H4K20me1, on endogenous chromosomes and newly formed ACs in one-cell embryos. Embryos were stained with antibody against LacI (green), antibodies against a histone PTM (red) and DAPI (blue). Scale bar represents 5 μm. A higher-magnification view of the ACs (white square) is shown on the right. Scale bar represents 2 μm for the magnified images. The box plot shows the quantification result of the normalized integrated density of (B) H4K5ac, (C) H4K12ac, (D) H3K9ac or (E) H4K20me1 signal on endogenous chromosomes and on ACs in one-cell embryos. Only quantifications of the enriched PTMs are shown. Other PTM levels are summarized in Table 1. For quantification of PTMs on ACs and endogenous chromosomes, the signal density of each PTM was normalized with that of DAPI. The number of samples (n) analyzed is indicated. The error bars represent SD. Significant differences are analyzed by the Student’s t-test (*, P < 0.05; **, P < 0.01).
Figure 5.
Figure 5.
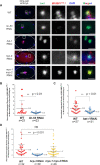
RbAp46/48LIN-53 is essential for chromatinization of nascent ACs. Representative images of immunofluorescence of (A) histone H3 and (B) histone H4 (ab10158), (C) mCherry::H2B and H4 (ab177840) and (D) GFP::HIS-72 (H3.3) on nascent ACs in WT and lin-53 RNAi-treated one-cell embryos. Embryos were stained with antibody against LacI (green), antibodies against histone H4 (ab10158: red; ab177840: white) and DAPI (blue). A higher-magnification view of the AC (white square) is shown on the right. Scale bar represents 2 μm for the magnified images. Scatter plots show the quantification of normalized integrated density of (A) H3, (B) H4 (ab10158) (C) mCherry::H2B and H4 (ab177840) and (D) GFP::HIS-72 on nascent ACs. The integrated density of each histone was normalized to that of DAPI. The number of samples (n) analyzed is indicated. The error bars represent SD. Significant differences are analyzed by Student’s t-test (**, P < 0.01; NS, not significant).
Figure 6.
Figure 6.
The segregation ability of nascent ACs and the enrichment of H4K5ac, H4K12ac and H3K9ac on ACs depend on RbAp46/48LIN-53 and HAT-1. (A) A schematic diagram of the experimental approach used to identify factors responsible for nascent AC segregation by RNAi and live-cell imaging. (B) Quantification of AC segregation rates in WT (untreated), hat-1, mys-1, mys-2, cbp-1, lin-53, hda-1, set-1, hat-1 mys-1 double, hat-1 mys-2 double, mys-1 mys-2 double, hat-1 lin-53 double, mys-4 lsy-12 double and hat-1 mys-1 mys-2 triple RNAi-treated one-cell embryos. Significant differences are analyzed by the Fisher’s exact test (*, P < 0.05; **, P < 0.01). The number of samples (n) analyzed was indicated. (C) Representative live-cell imaging of a nascent AC that was attempting to segregate (even with anaphase bridges) in WT (untreated) and in lin-53 RNAi-treated one-cell embryos. The time-lapses are shown (mm:ss). Scale bar represents 5 μm. Immunofluorescence of (D) H4K5ac, (E) H4K12ac and (F) H3K9ac on nascent ACs in WT, lin-53 RNAi-treated and lin-53 hat-1 double RNAi-treated one-cell embryos. Embryos were stained with antibody against LacI (green), antibodies against a histone PTM (red) and DAPI (blue). A higher-magnification view of the AC (white square) is shown on the right. Scale bar represents 2 μm for the magnified images. Scatter plots show the quantification of normalized integrated density of (D) H4K5ac, (E) H4K12ac and (F) H3K9ac on ACs. The integrated density of each PTM was normalized to DAPI. The number of samples (n) analyzed is indicated. The error bars represent SD. Significant differences are analyzed by Student’s t-test (***, P < 0.001).
Figure 7.
Figure 7.
HAT-1 assists RbAp46/48LIN-53 in de novo CENP-AHCP-3 deposition on nascent ACs. (A) Immunofluorescence of CENP-AHCP-3 on ACs in WT, hat-1 RNAi, lin-53, lin-53 hat-1 double and knl-2 RNAi-treated one-cell embryos. A higher-magnification view of the ACs (white square) is shown on the right. Scale bars in whole embryo images and in the magnified images represent 5 and 2 μm, respectively. (B–E) Scatter plots show the quantification of the normalized integrated density of CENP-AHCP-3 signal on ACs in (B) hat-1, (C) lin-53, (D) lin-53 hat-1 double and (E) knl-2 RNAi-treated one-cell embryos, compared with that in WT embryos. The integrated density of CENP-AHCP-3 was normalized to DAPI. The number of samples (n) analyzed is indicated. The error bars represent SD. Significant differences are analyzed by the Student’s t-test (**, P < 0.01).
Figure 8.
Figure 8.
RbAp46/48LIN-53-initiated de novo CENP-AHCP-3 deposition is required for Mis18BP1KNL-2 localization. (A) Immunofluorescence of M18BP1KNL-2 on ACs in WT, lin-53, hcp-3 and mys-1 mys-2 double RNAi-treated one-cell embryos. A higher-magnification view of the ACs (white square) is shown on the right. Scale bars in whole embryo images and in the magnified images represent 5 and 2 μm, respectively. (B–D) Scatter plots show the quantification result of the normalized integrated density of M18BP1KNL-2 signal on ACs in (B) lin-53, (C) hat-1, and (D) hcp-3 and mys-1 mys-2 double RNAi-treated one-cell embryos, compared with that in WT embryos. The integrated density of M18BP1KNL-2 was normalized to that of DAPI. The number of samples (n) analyzed is indicated. The error bars represent SD. Significant differences are analyzed by the Student’s t-test (**, P < 0.01; ***, P < 0.001).
Figure 9.
Figure 9.
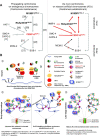
A model of de novo centromere formation in C. elegans embryos. (A) A schematic diagram of the centromeric protein localization dependency during centromere maintenance on endogenous chromosomes and in de novo centromere formation on nascent ACs in C. elegans. A→B means B’s localization is dependent on A. Gray arrows indicate the findings from other studies. Red arrows indicate the findings from this study. Dashed arrows indicate that the dependency is predicted, but not confirmed. The line between two factors indicates that they have physical interaction. (B) The proposed process of artificial chromosome formation in C. elegans gonad. 1. First, small foreign DNA fragments from microinjection concatemerize into HMW DNA arrays in the oocytes. RbAp46/48LIN-53-HAT-1 complex acetylates H3-H4 and CENP-A-H4 pre-nucleosomes at H4K5, H4K12 and H3K9ac, which contribute to the hyperacetylation of nascent ACs. 2. Second, RbAp46/48LIN-53 initiates chromatinization, de novo CENP-AHCP-3 and H3 deposition, and RbAp46/48LIN-53 is required for M18BP1KNL-2 localization on HMW DNA; Condensin II complex also facilitates CENP-AHCP-3 deposition. Chromatinization and centromerization of the HMW DNA generates nascent ACs. Nascent ACs have DNA replication defects and lack bi-oriented sister kinetochores, which could lead to merotelic attachments to the mitotic spindle and chromosome bridging (in early embryonic cells). 3. Finally, DNA replication efficiency gradually improves on ACs, and ACs ‘mature’ in late embryonic stage. In matured ACs, bi-oriented sister kinetochores allow amphitelic attachment of spindles and proper segregation.

Similar articles

Cited by

References

    1. Van Hooser A.A., Ouspenski I.I., Gregson H.C., Starr D.A., Yen T.J., Goldberg M.L., Yokomori K., Earnshaw W.C., Sullivan K.F., Brinkley B.R.. Specification of kinetochore-forming chromatin by the histone H3 variant CENP-A. J. Cell Sci. 2001; 114:3529–3542. - PubMed
    1. Marshall O.J., Chueh A.C., Wong L.H., Choo K.H.. Neocentromeres: new insights into centromere structure, disease development, and karyotype evolution. Am. J. Hum. Genet. 2008; 82:261–282. - PMC - PubMed
    1. Catania S., Pidoux A.L., Allshire R.C.. Sequence features and transcriptional stalling within centromere DNA promote establishment of CENP-A chromatin. PLos Genet. 2015; 11:e1004986. - PMC - PubMed
    1. Harrington J.J., Van Bokkelen G., Mays R.W., Gustashaw K., Willard H.F.. Formation of de novo centromeres and construction of first-generation human artificial microchromosomes. Nat. Genet. 1997; 15:345–355. - PubMed
    1. Hahnenberger K.M., Baum M.P., Polizzi C.M., Carbon J., Clarke L.. Construction of functional artificial minichromosomes in the fission yeast Schizosaccharomyces pombe. Proc. Natl. Acad. Sci. USA. 1989; 86:577–581. - PMC - PubMed

Publication types

MeSH terms

Substances