. 2021 Apr 16;12(1):2308.
doi: 10.1038/s41467-021-22589-z.

Classical MHC expression by DP thymocytes impairs the selection of non-classical MHC restricted innate-like T cells

Affiliations

Classical MHC expression by DP thymocytes impairs the selection of non-classical MHC restricted innate-like T cells

Hristo Georgiev et al. Nat Commun. .

Abstract

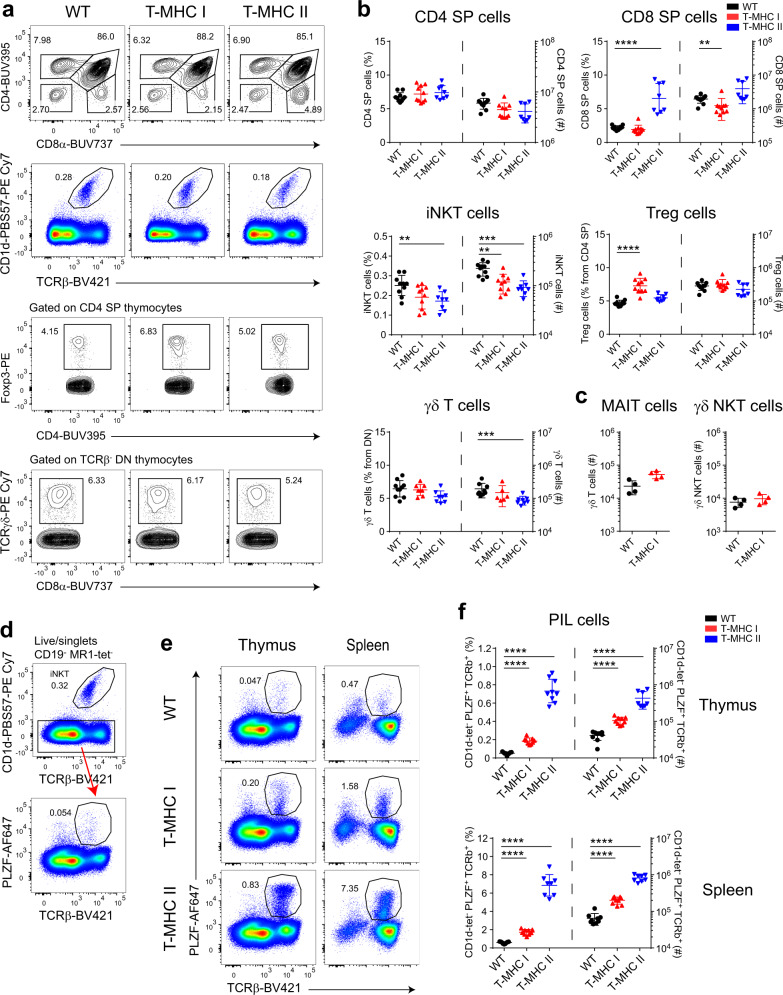
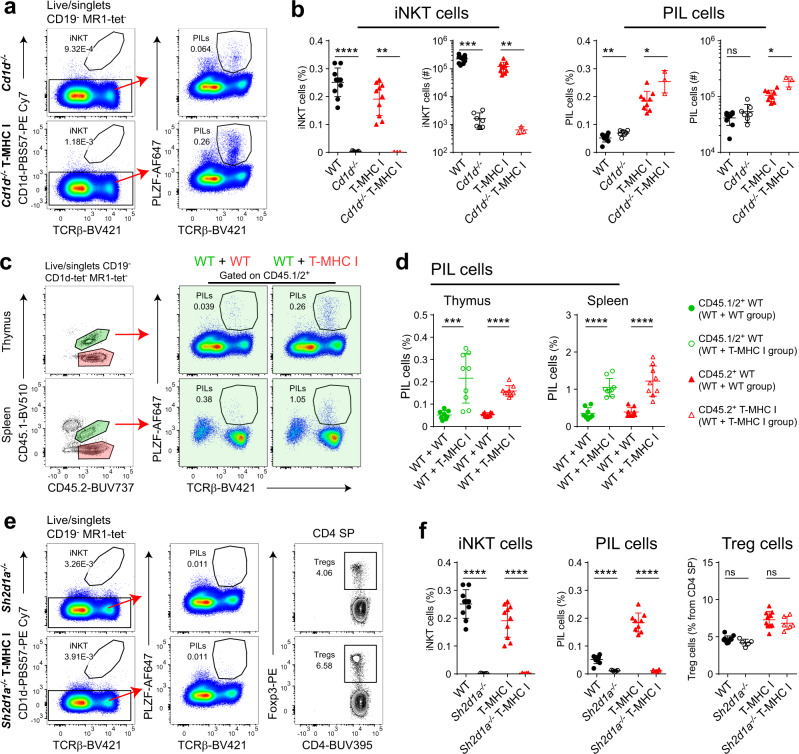
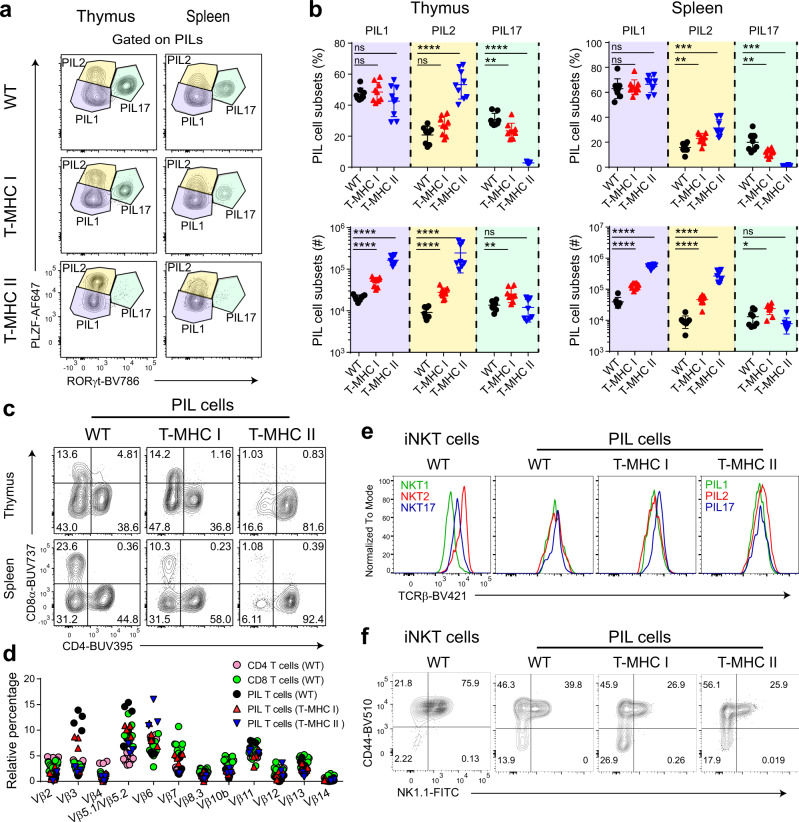
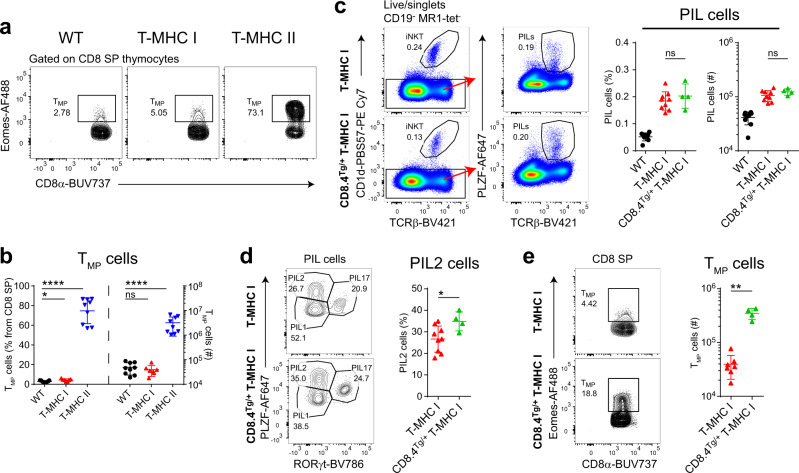
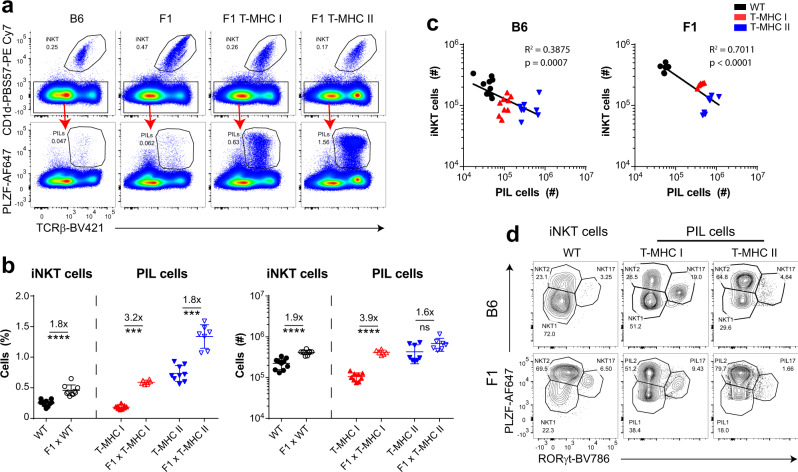
Conventional T cells are selected by peptide-MHC expressed by cortical epithelial cells in the thymus, and not by cortical thymocytes themselves that do not express MHC I or MHC II. Instead, cortical thymocytes express non-peptide presenting MHC molecules like CD1d and MR1, and promote the selection of PLZF+ iNKT and MAIT cells, respectively. Here, we report an inducible class-I transactivator mouse that enables the expression of peptide presenting MHC I molecules in different cell types. We show that MHC I expression in DP thymocytes leads to expansion of peptide specific PLZF+ innate-like (PIL) T cells. Akin to iNKT cells, PIL T cells differentiate into three functional effector subsets in the thymus, and are dependent on SAP signaling. We demonstrate that PIL and NKT cells compete for a narrow niche, suggesting that the absence of peptide-MHC on DP thymocytes facilitates selection of non-peptide specific lymphocytes.


Conflict of interest statement

The authors declare no competing interests.

Figures

Fig. 1
Fig. 1. An inducible Nlrc5 (CITA) approach to force DP thymocytes to express MHC Class I molecules.
a Schematic representation of positive selection of innate-like T cells on DP thymocytes. b mRNA expression level of murine Nlrc5 in different T-cell subsets from B6 WT mice. Data were obtained from ImmGen. c Flow cytometry analysis of HEK 293 cells transduced with lentivirus expression vector encoding the murine Nlrc5 coding sequence (CDS) or with empty virus as a control. As additional controls, non-transduced cells and isotype control staining are shown. Cells are analyzed 48 h post transduction. d Structure of the wild-type (WT) Rosa26 and the targeted allele of the transgenic mouse (Nlrc5-stopflox). e Flow cytometry evaluation of MHC I and MHC II expression on T cells from WT, CD4-Cre × Nlrc5-stopflox (T-MHC I), and Plck-CIITA (T-MHC II) transgenic mice. Data are representative of five independent experiments, n ≥ 5 mice per experimental group. Source data are provided as a Source Data file.
Fig. 2
Fig. 2. Expression of MHC I on DP thymocytes increased PLZF+ innate-like T cells (PILs) and decreased NKT cell numbers.
a Representative flow cytometry plots of total thymocytes from WT, T-MHC I, and T-MHC II mice. b Data quantification according to the gating strategy displayed in a. Cell frequencies are plotted on the left axis and numbers on the right axis. c Total cell counts of MAIT cells and γδNKT cells in the thymus of WT and T-MHC I mice. d Representative plots of flow cytometry strategy for the identification of PIL cells in WT thymus. e Representative flow cytometry plots of staining for PIL cells comparing WT with T-MHC I and T-MHC II mice from the thymus and spleen. f Frequency (plotted on the left axis) and number (plotted on the right axis) of PIL cells from WT, T-MHC I, and T-MHC II mice defined by the flow cytometry strategy depicted in d. b, c, f Each point represents one animal: n = 10 animals per group (WT and T-MHC I groups) and n = 8 animals (T-MHC II group) in b, n = 4 animals per group in c and n = 9 animals per group in f. Data are representative of five in a, b and eight in df independent experiments. One experiment was performed in c. Unpaired two-tailed Mann–Whitney test was performed in b, c, f); p ≥ 0.01 are not depicted, **p < 0.01, ***p < 0.001, and ****p < 0.0001. Data are presented as mean values ± SD. Source data are provided as a Source Data file.
Fig. 3
Fig. 3. PIL T cells are SAP dependent and require MHC I in a cell-extrinsic manner.
a Representative flow cytometry plots of total thymocytes from Cd1d−/− and Cd1d−/− T-MHC I mice. b Thymic iNKT and PIL cell frequency and number comparison between WT and Cd1d−/−, and T-MHC I and Cd1d−/− T-MHC I mice. c Representative flow cytometry plots from a set of unequal bone marrow (BM) chimeric mice 8 weeks post transplantation. WT CD45.1+ mice were lethally irradiated and transplanted with a mix of WT CD45.1/2+ and T-MHC I CD45.2+ bone marrow at a ratio of 1 : 10. This experimental group is depicted as WT + T-MHC I group. In the control group, mice were transplanted with a mix of WT CD45.1/2+ and WT CD45.2+ bone marrow at a ratio of 1 : 10. This experimental group is depicted as WT + WT group. Shown are representative flow cytometry plots displaying the gating strategy from WT + WT group (in the left two panels). In the right four panels (in green) are shown representative plots displaying PIL cell frequencies (gated on WT CD45.1/2+) from the WT + WT group (on the left) and WT + T-MHC I group (on the right). PIL cell frequency evaluation is shown in d. e Representative flow cytometry plots of total thymocytes from Sh2d1a/− (SAP deficient) and Sh2d1a−/− T-MHC I mice. iNKT, PIL, and Treg cell frequency are shown in f. b, d, f Each point represents one animal: n = 10 animals per group (WT and T-MHC I groups), n = 7 animals (CD1d−/− group), n = 3 animals (CD1d−/− T-MHC I group), n = 8 animals (WT + WT group), n = 9 animals (WT + T-MHC I group), n = 5 animals (Sh2d1a−/− group), and n = 6 animals (Sh2d1a−/− T-MHC I group). Data are representative of four in a, b, e, f and two in c, d independent experiments. Unpaired two-tailed Mann–Whitney test was performed in b, d and an unpaired two-tailed Student’s t-test was performed in f; ns, not significant (p ≥ 0.05), *p < 0.05, **p < 0.01, ***p < 0.001, and ****p < 0.0001. Data are presented as mean values ± SD. Source data are provided as a Source Data file.
Fig. 4
Fig. 4. Both MHC I and MHC II induced PIL T cells exist in three major subsets, similar to NKT cells.
a Akin to iNKT cells, PIL T cells segregate into three subsets defined by expression pattern of transcription factors PLZF and RORγt. Shown are representative flow cytometry plots comparing PIL T-cell subsets from WT, T-MHC I, and T-MHC II mice. b Comparisons of PIL T-cell subset frequencies (upper row) and numbers (lower row). c Representative flow cytometry plots of staining for CD4 and CD8α on PIL cells from WT, T-MHC I, and T-MHC II mice. d Flow cytometry assessment of the TCR Vβ chain repertoire of thymic PIL T cells from WT, T-MHC I, and T-MHC II mice in comparison to conventional T cells. e Exemplary plots showing staining for TCRβ on iNKT cell subsets compared to PIL T-cell subsets from WT, T-MHC I, and T-MHC II mice. All analyzed animals are F1 generation with BALB/c mice (further characterized in Fig. 6). f CD44 and NK1.1 expression pattern on (from left to right) iNKT, WT PIL, T-MHC I PIL, and T-MHC II PIL T cells. b Each point represents one animal: n = 8 animals per group (WT and T-MHC II groups) and n = 9 animals (T-MHC I group). Data are representative of seven in ac and three in df independent experiments. Unpaired two-tailed Mann–Whitney test was performed in b; ns, not significant (p ≥ 0.05), *p < 0.05, **p < 0.01, ***p < 0.001, and ****p < 0.0001. Data are presented as mean values ± SD. Source data are provided as a Source Data file.
Fig. 5
Fig. 5. MHC II, but not MHC I, drives type 2 cytokine production in PIL T cells and induces memory phenotype CD8 T (TMP)-cell development.
a Representative flow cytometry plots of intracellular staining for Eomes on CD8 SP thymocytes from WT, T-MHC I, and T-MHC II mice. b Number (plotted on the right axis) and frequency (plotted on the left axis) of CD8 TMP cells among CD8 SP cells in the thymus from WT, T-MHC I, and T-MHC II mice, defined by the gating strategy shown in a. c Representative flow cytometry plots of thymocytes comparing PIL T-cell frequency from T-MHC I mice with CD8.4Tg/+ T-MHC I mice. Shown are summary evaluations for PIL T-cell number and frequency (right two panels). d Representative flow cytometry plots and summary evaluation for frequency of PIL2 T-cell subset among thymocytes from T-MHC I and CD8.4Tg/+ T-MHC I mice. Both groups are compared to WT mice. e Exemplarity flow cytometry plots of CD8 TMP cell frequency among CD8 SP cells in the thymus from T-MHC I mice with CD8.4Tg/+ T-MHC I mice (left two panels) and summary evaluation of CD8 TMP cell number (right panel). Each point represents one animal: n = 9 animals per group (WT and T-MHC II groups) in a, b, n = 9 animals (T-MHC I group) in c, d, n = 7 animals (T-MHC I group) in b, e, and n = 4 animals (CD8.4Tg/+ T-MHC I group) in ce. Data are representative of 7 in a, b and 2 in ce independent experiments. Unpaired two-tailed Mann–Whitney test was performed in be; ns, not significant (p ≥ 0.05), *p < 0.05, **p < 0.01, and ****p < 0.0001. Data are presented as mean values ± SD. Source data are provided as a Source Data file.
Fig. 6
Fig. 6. PIL T cells compete with iNKT cells.
a B6 WT, T-MHC I, and T-MHC II mice were crossed to BALB/c mice and F1 generation littermates (labeled as F1, F1 T-MHC I, and F1 T-MHC II) were analyzed by flow cytometry for frequency of iNKT and PIL T cells in the thymus. b Summary evaluation of iNKT and PIL T-cell frequency (left panel) and number (right panel) from WT, T-MHC I, and T-MHC II mice on B6 and F1 background. c Inverse correlation between number of iNKT cells and the number of PIL T cells in the thymus from WT (black dots), T-MHC I (red triangles), and T-MHC II mice (blue inverse triangles) on B6 (left panel) and F1 (right panel) background. d Shown are representative flow cytometry plots comparing iNKT and PIL T-cell subsets from WT, T-MHC I, and T-MHC II mice on B6 (upper row) and F1 (lower row) background. Each point represents one animal: n = 10 animals per group (WT and T-MHC I groups), n = 8 animals (T-MHC II group), n = 9 animals (F1 WT group), n = 6 animals (F1 T-MHC I group), and n = 7 animals (F1 T-MHC II group) in ad. Data are representative of seven independent experiments. Unpaired two-tailed Mann–Whitney test was performed in b; ns, not significant (p ≥ 0.05), ***p < 0.001, and ****p < 0.0001. R2-values and p-values in c were calculated by fitting nonlinear regression and performing a Goodness-of-Fit test and extra-sum-of-squares F test. Data are presented as mean values ± SD. Source data are provided as a Source Data file.

Similar articles

Cited by

References

    1. Edholm ES, Banach M, Robert J. Evolution of innate-like T cells and their selection by MHC class I-like molecules. Immunogenetics. 2016;68:525–536. doi: 10.1007/s00251-016-0929-7. - DOI - PMC - PubMed
    1. Vermijlen D, Prinz I. Ontogeny of innate T lymphocytes - some innate lymphocytes are more innate than others. Front. Immunol. 2014;5:1–12. doi: 10.3389/fimmu.2014.00486. - DOI - PMC - PubMed
    1. Bendelac A, Savage PB, Teyton L. The biology of NKT cells. Annu. Rev. Immunol. 2007;25:297–336. doi: 10.1146/annurev.immunol.25.022106.141711. - DOI - PubMed
    1. Stetson DB, et al. Constitutive cytokine mRNAs mark natural killer (NK) and NK T cells poised for rapid effector function. J. Exp. Med. 2003;198:1069–1076. doi: 10.1084/jem.20030630. - DOI - PMC - PubMed
    1. Crowe NY, et al. Glycolipid antigen drives rapid expansion and sustained cytokine production by NK T cells. J. Immunol. 2003;171:4020–4027. doi: 10.4049/jimmunol.171.8.4020. - DOI - PubMed

Publication types

MeSH terms

Substances