. 2021 May 20;81(10):2246-2260.e12.
doi: 10.1016/j.molcel.2021.03.028. Epub 2021 Apr 15.

A pan-cancer transcriptome analysis of exitron splicing identifies novel cancer driver genes and neoepitopes

Affiliations

A pan-cancer transcriptome analysis of exitron splicing identifies novel cancer driver genes and neoepitopes

Ting-You Wang et al. Mol Cell. .

Abstract

Exitron splicing (EIS) creates a cryptic intron (called an exitron) within a protein-coding exon to increase proteome diversity. EIS is poorly characterized, but emerging evidence suggests a role for EIS in cancer. Through a systematic investigation of EIS across 33 cancers from 9,599 tumor transcriptomes, we discovered that EIS affected 63% of human coding genes and that 95% of those events were tumor specific. Notably, we observed a mutually exclusive pattern between EIS and somatic mutations in their affected genes. Functionally, we discovered that EIS altered known and novel cancer driver genes for causing gain- or loss-of-function, which promotes tumor progression. Importantly, we identified EIS-derived neoepitopes that bind to major histocompatibility complex (MHC) class I or II. Analysis of clinical data from a clear cell renal cell carcinoma cohort revealed an association between EIS-derived neoantigen load and checkpoint inhibitor response. Our findings establish the importance of considering EIS alterations when nominating cancer driver events and neoantigens.

Keywords: GTEx; TCGA; cancer driver genes; checkpoint inhibition immunotherapy; exitron; immunopeptidome; neoantigens; non-canonical splicing; pan-cancer analysis; transcriptome alterations.


Conflict of interest statement

Declaration of interests The authors declare no competing interests.

Figures
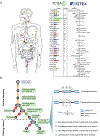
Figure 1.
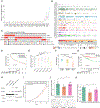
Figure 1.. Samples and workflow for exitron splicing discovery.
(A) Data source for the 33 cancer types in this study. Bar charts describe numbers of tumor and matched normal samples for each cancer type from TCGA (with color) and healthy samples from GTEx (without color). The number of samples with available RNA-Seq data is indicated. (B) Workflow and criteria of exitron detection in TCGA data. Left, the computational pipeline to detect exitron splicing events within annotated protein-coding exons from TCGA RNA-Seq data. Right, the criteria to report an exitron splicing event including the number of supporting reads (indicated by D) and a percent spliced out (PSO) metric.
Figure 2.
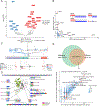
Figure 2.. Detection of dysregulated exitron splicing (EIS) events in cancer.
(A) Count of EIS events across 33 cancer types. For each cancer type, we randomly choose 36 samples for EIS burden evaluation to account for cohort size variations. (B) Pairwise comparison of EIS load in 40 randomly selected pairs of tumor specimens (T) and matched adjacent histologically normal tissues (N) for TCGA cancer types with at least 40 T/N matched samples. The p value is calculated using the Wilcoxon signed-ranks test. (C) Results of differential splicing analysis of exitrons between tumor and normal tissues for 8 cancer types. Rows represent 16 dysregulated exitrons that were found to be differentially spliced after FDR correction. Shading corresponds to −log10(p value). Columns represent cancer types. Genes marked with an asterisk are annotated in the COSMIC cancer gene census. (D) Illustration of the dysregulated EIS events identified in FOXO4 (left) and SPEN (right) and comparison of their splicing between tumor and normal samples for the eight TCGA cancer types. Each dot corresponds to the percent spliced out (PSO) value of the selected EIS in one sample.
Figure 3.
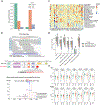
Figure 3.. Detection of genes enriched with tumor-specific exitrons (TSEs).
(A) Number of TSE splicing events for TCGA cohorts. Each dot represents the number of TSE splicing events in a TCGA tumor sample. (B) Top 35 significantly exitron-spliced genes (SEGs). Circle size correlates with the number of samples with spliced TSEs and colored by cancer type. Highly tissue specific SEGs (τ > 0.9) are highlighted. (C) Mutual exclusivity of exitron splicing events in FET genes including EWSR1, FUS and TAF15 in TCGA pan-cancer cohort (****p < 0.0001, Fisher’s exact test). (D) Exitron splicing of FET family genes predicts progression-free survival in TCGA pan-cancer cohort. (E) The expression of the SEG gene NEFH is correlated with Gleason grade in PRAD cohort (n.s., not significant (p > 0.05), *p < 0.05, **p < 0.01, ***p < 0.001, Mann-Whitney rank test). (F) NEFH is downregulated in prostate tumors. NEFH mRNA expression from microarray data set (GSE21032) is compared in benign, localized, and metastatic prostate cancer. The p value is calculated by Kruskal-Wallis test. (G) Low NEFH mRNA expression is associated with poor clinical outcome. Kaplan-Meier analysis of prostate cancer outcome using GSE21032 dataset is shown. Prostate cancer cases are stratified based on their NEFH mRNA expression level and analyzed for biochemical recurrence. The p value is calculated by a log-rank test. (H) Representative western blot against C4-2 stable cell lines expressing Myc-tagged wild-type NEFH and exitron-spliced NEFH. Apoptosis was evaluated by western blot analysis for poly (ADP-ribose) polymerase (PARP) cleavage. (I) CellTiter-Glo growth assays indicate that overexpression of wild-type NEFH, but not exitron-spliced NEFH, significantly inhibited cell growth in C4-2 cells. (J) Overexpressing wild-type NEFH significantly decreased colony-formation ability of C4-2 cells. Cells were fixed and stained with crystal violet. n = 6. The figure is a representative of three experiments with similar results. Quantification was performed by manual counting. (K) BrdU ELISA assay of C4-2 cells overexpressing wild-type NEFH and or exitron-spliced NEFH with 24hrs of BrdU label (n=9). Y axis, absorbance of 450–590 nm relative to empty vector. There was less incorporation of BrdU in cells expressing wild-type NEFH. All p values are calculated using unpaired, two-tailed Student’s t-test. Error bars indicate ± s.d. (*p < 0.05, **p < 0.01, ***p < 0.001).
Figure 4.
Figure 4.. Comparison of TSE splicing and somatic mutations.
(A) Volcano plot shows mutation and TSE splicing frequency difference separating genes as SMGs and SEGs. (B) The frequencies of mutation and exitron splicing events in genes are inversely correlated in the PRAD cohort. DNA mutations and exitron splicing are mutually exclusive in FOXA1, KMT2D, and ZFHX3. Genes of interest are highlighted. (C) DNA mutations and exitron splicing are clustered in the forkhead DNA binding domain of the FOXA1 gene in PRAD. (D) The nucleotide and amino acid changes caused by exitron splicing and somatic mutations are shown against the 3D structure of the FOXA1 forkhead domain. The α-helix and wing regions are highlighted. (E) Comparison on Pfam protein domains affected by somatic mutations versus exitron splicing events. Venn diagram (top panel) shows that Pfam domains affected by somatic mutations or exitron splicing events share extensive overlap. The scatterplot (bottom panel) shows high correlation (Spearman correlation coefficient = 0.7) in the Pfam domains affected by exitron splicing events and somatic mutations. Pfam domains of interest are highlighted. Jaccard similarity is used to measure the similarity between exitron splicing- and mutation-altered gene sets.
Figure 5.
Figure 5.. MsigDB hallmark gene sets affected by exitron splicing in TCGA cohorts.
The size of the circles represents the significance of TSE enrichment measured by FDR. Color indicates the fraction of TSE splicing altered samples per gene set and tumor type.
Figure 6.
Figure 6.. Putative TSE neoantigens and their correlation with immune response.
(A) Comparison of the contribution of TSE splicing, somatic SNVs and indels to CPTAC proteomic-confirmed putative neoantigens in BRCA and OV. (B) RNA-Seq data of ovarian cancer patient OvCa65 showed a 79bp exitron in PRPF8 exon 33 (top panel). Predicted functional domains disrupted by this frameshift exitron splicing event in PRPF8 (middle panel). A predicted neoantigen resulting from this frameshift exitron in PRPF8 was found by mass spectrometry to be presented in the corresponding immunopeptidome (bottom panel). (C) TSE neoantigen burden correlates with individual immune cell types in TCGA tumors. Values displayed are the Spearman correlation of immune cell fractions (rows) with neoantigen count within each tumor type (columns). Red indicates positive correlation (increasing proportion of indicated cell type with increasing neoantigen burden), and blue indicates negative correlation. (D) TSE neoantigen burden is associated with checkpoint inhibitor response in clear cell renal cell carcinoma (ccRCC). (E) Expression of T cell markers (PD-1, CD8A, CD8B), cytolytic activity markers (GZMA and PRF1) and immune-regulatory molecules (PD-L1 and PD-L2) in patients between top quartile TSE neoantigen load (named high group) and bottom quartile TSE neoantigen load (named low group) in OV and KIRC (n.s., not significant (p > 0.05), *p < 0.05, **p < 0.01, ***p < 0.001, ****p < 0.0001, Mann-Whitney rank test).

Similar articles

Cited by

References

    1. Adams EJ, Karthaus WR, Hoover E, Liu D, Gruet A, Zhang Z, Cho H, DiLoreto R, Chhangawala S, Liu Y, et al. (2019). FOXA1 mutations alter pioneering activity, differentiation and prostate cancer phenotypes. Nature. - PMC - PubMed
    1. Aliperti V, Sgueglia G, Aniello F, Vitale E, Fucci L, and Donizetti A (2019). Identification, Characterization, and Regulatory Mechanisms of a Novel EGR1 Splicing Isoform. Int J Mol Sci 20. - PMC - PubMed
    1. Ariyoshi M, and Schwabe JW (2003). A conserved structural motif reveals the essential transcriptional repression function of Spen proteins and their role in developmental signaling. Genes Dev 17, 1909–1920. - PMC - PubMed
    1. Bailey MH, Tokheim C, Porta-Pardo E, Sengupta S, Bertrand D, Weerasinghe A, Colaprico A, Wendl MC, Kim J, Reardon B, et al. (2018). Comprehensive Characterization of Cancer Driver Genes and Mutations. Cell 174, 1034–1035. - PMC - PubMed
    1. Cancer Genome Atlas Research, N. (2008). Comprehensive genomic characterization defines human glioblastoma genes and core pathways. Nature 455, 1061–1068. - PMC - PubMed

Publication types

LinkOut - more resources