Meta-Analysis
. 2021 Apr 16:10:e65774.
doi: 10.7554/eLife.65774.

Heterogeneity in transmissibility and shedding SARS-CoV-2 via droplets and aerosols

Affiliations
Meta-Analysis

Heterogeneity in transmissibility and shedding SARS-CoV-2 via droplets and aerosols

Paul Z Chen et al. Elife. .

Abstract

Background: Which virological factors mediate overdispersion in the transmissibility of emerging viruses remains a long-standing question in infectious disease epidemiology.

Methods: Here, we use systematic review to develop a comprehensive dataset of respiratory viral loads (rVLs) of SARS-CoV-2, SARS-CoV-1 and influenza A(H1N1)pdm09. We then comparatively meta-analyze the data and model individual infectiousness by shedding viable virus via respiratory droplets and aerosols.

Results: The analyses indicate heterogeneity in rVL as an intrinsic virological factor facilitating greater overdispersion for SARS-CoV-2 in the COVID-19 pandemic than A(H1N1)pdm09 in the 2009 influenza pandemic. For COVID-19, case heterogeneity remains broad throughout the infectious period, including for pediatric and asymptomatic infections. Hence, many COVID-19 cases inherently present minimal transmission risk, whereas highly infectious individuals shed tens to thousands of SARS-CoV-2 virions/min via droplets and aerosols while breathing, talking and singing. Coughing increases the contagiousness, especially in close contact, of symptomatic cases relative to asymptomatic ones. Infectiousness tends to be elevated between 1 and 5 days post-symptom onset.

Conclusions: Intrinsic case variation in rVL facilitates overdispersion in the transmissibility of emerging respiratory viruses. Our findings present considerations for disease control in the COVID-19 pandemic as well as future outbreaks of novel viruses.

Funding: Natural Sciences and Engineering Research Council of Canada (NSERC) Discovery Grant program, NSERC Senior Industrial Research Chair program and the Toronto COVID-19 Action Fund.

Keywords: COVID-19; emerging pathogens; epidemiology; global health; infectious disease; influenza; microbiology; none; overdispersion; superspreading.

Plain language summary

To understand how viruses spread scientists look at two things. One is – on average – how many other people each infected person spreads the virus to. The other is how much variability there is in the number of people each person with the virus infects. Some viruses like the 2009 influenza H1N1, a new strain of influenza that caused a pandemic beginning in 2009, spread pretty uniformly, with many people with the virus infecting around two other people. Other viruses like SARS-CoV-2, the one that causes COVID-19, are more variable. About 10 to 20% of people with COVID-19 cause 80% of subsequent infections – which may lead to so-called superspreading events – while 60-75% of people with COVID-19 infect no one else. Learning more about these differences can help public health officials create better ways to curb the spread of the virus. Chen et al. show that differences in the concentration of virus particles in the respiratory tract may help to explain why superspreaders play such a big role in transmitting SARS-CoV-2, but not the 2009 influenza H1N1 virus. Chen et al. reviewed and extracted data from studies that have collected how much virus is present in people infected with either SARS-CoV-2, a similar virus called SARS-CoV-1 that caused the SARS outbreak in 2003, or with 2009 influenza H1N1. Chen et al. found that as the variability in the concentration of the virus in the airways increased, so did the variability in the number of people each person with the virus infects. Chen et al. further used mathematical models to estimate how many virus particles individuals with each infection would expel via droplets or aerosols, based on the differences in virus concentrations from their analyses. The models showed that most people with COVID-19 infect no one because they expel little – if any – infectious SARS-CoV-2 when they talk, breathe, sing or cough. Highly infectious individuals on the other hand have high concentrations of the virus in their airways, particularly the first few days after developing symptoms, and can expel tens to thousands of infectious virus particles per minute. By contrast, a greater proportion of people with 2009 influenza H1N1 were potentially infectious but tended to expel relatively little infectious virus when the talk, sing, breathe or cough. These results help explain why superspreaders play such a key role in the ongoing pandemic. This information suggests that to stop this virus from spreading it is important to limit crowd sizes, shorten the duration of visits or gatherings, maintain social distancing, talk in low volumes around others, wear masks, and hold gatherings in well-ventilated settings. In addition, contact tracing can prioritize the contacts of people with high concentrations of virus in their airways.


Conflict of interest statement

PC, NB, ZP, MK, DF, FG No competing interests declared

Figures
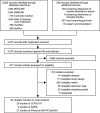
Figure 1.
Figure 1.. Development of the systematic dataset.
Figure 2.
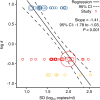
Figure 2.. Association of overdispersion in SARS-CoV-2, SARS-CoV-1 and A(H1N1)pdm09 transmissibility with heterogeneity in respiratory viral load (rVL).
Meta-regression of dispersion parameter (k) with the standard deviation (SD) of rVLs from contributing studies with low risk of bias (Pearson’s r = −0.73). Pooled estimates of k were determined from the literature for each infection. Blue, red and yellow circles denote A(H1N1)pdm09 (N = 22), COVID-19 (N = 24) and SARS (N = 7) studies, respectively. Circle sizes denote weighting in the meta-regression. The p-value was obtained using the meta-regression slope t-test.
Figure 2—figure supplement 1.
Figure 2—figure supplement 1.. Meta-regression between dispersion in SARS-CoV-2, SARS-CoV-1 and A(H1N1)pdm09 transmissibility and heterogeneity in respiratory viral load (rVL).
Meta-regression of dispersion parameter (k) with the standard deviation (SD) of rVLs from all contributing studies (Pearson’s r = −0.26). Pooled estimates of k were determined from the literature. Blue, red and yellow circles denote A(H1N1)pdm09 (N = 27), COVID-19 (N = 29) and SARS (N = 8) studies, respectively. Circle sizes denote weighting in the meta-regression. The p-value was obtained using the meta-regression slope t-test.
Figure 2—figure supplement 2.
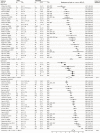
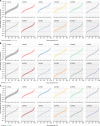
Figure 2—figure supplement 2.. Meta-analysis of respiratory viral loads (rVLs) of SARS-CoV-2, SARS-CoV-1 and influenza A(H1N1)pdm09 during the estimated infectious period.
Random-effects meta-analyses comparing the expected rVLs for COVID-19, SARS and A(H1N1)pdm09 cases during the infectious period. Quantitative specimen measurements were used to estimate rVLs, which refer to virus concentrations in the respiratory tract. Case types: hospitalized (H), not admitted (N), community (C), adult (A), pediatric (P), symptomatic (S), presymptomatic (Ps) and asymptomatic (As). Specimen types: endotracheal aspirate (ETA), nasopharyngeal aspirate (NPA), nasopharyngeal swab (NPS), oropharyngeal swab (OPS), posterior oropharyngeal saliva (POS) and sputum (Spu). Dashes denote case numbers that were not obtained. Box sizes denote weighting in the overall estimates. Between-study heterogeneity was assessed using the p-value from Cochran’s Q test and the I2 statistic. One-sided Welch’s t-tests compared the expected SARS-CoV-2 rVL with those of SARS-CoV-1 and A(H1N1)pdm09 (non-significance, p>0.05).
Figure 3.
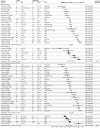
Figure 3.. Subgroup analyses of SARS-CoV-2 respiratory viral load (rVL) during the infectious period.
Random-effects meta-analyses comparing the expected rVLs of adult (≥18 years old) COVID-19 cases with pediatric (<18 years old) ones (top) and symptomatic/presymptomatic infections with asymptomatic ones (bottom) during the infectious period. Quantitative rVLs refer to virus concentrations in the respiratory tract. Case types: hospitalized (H), not admitted (N), community (C), adult (A), pediatric (P), symptomatic (S), presymptomatic (Ps) and asymptomatic (As). Specimen types: endotracheal aspirate (ETA), nasopharyngeal aspirate (NPA), nasopharyngeal swab (NPS), oropharyngeal swab (OPS), posterior oropharyngeal saliva (POS) and sputum (Spu). Dashes denote case numbers that were not obtained. Box sizes denote weighting in the overall estimates. Between-study heterogeneity was assessed using the p-value from Cochran’s Q test and the I2 statistic. One-sided Welch’s t-tests compared expected rVLs between the COVID-19 subgroups (non-significance, p>0.05).
Figure 3—figure supplement 1.
Figure 3—figure supplement 1.. Risk-of-bias sensitivity analysis of between-study heterogeneity for SARS-CoV-2 respiratory viral load (rVL) during the estimated infectious period.
Random-effects meta-analyses, based on the risk of bias of contributing studies, of the expected rVLs of COVID-19 cases during the infectious period. Quantitative rVLs refer to virus concentrations in the respiratory tract. Case types: hospitalized (H), not admitted (N), community (C), adult (A), pediatric (P), symptomatic (S), presymptomatic (Ps) and asymptomatic (As). Specimen types: endotracheal aspirate (ETA), nasopharyngeal aspirate (NPA), nasopharyngeal swab (NPS), oropharyngeal swab (OPS), posterior oropharyngeal saliva (POS) and sputum (Spu). Dashes denote case numbers that were not obtained. Box sizes denote weighting in the overall estimates. One-sided Welch’s t-test for difference (non-significance, p>0.05). Between-study heterogeneity was assessed using the p-value from Cochran’s Q test (non-significance, p>0.05) and the I2 statistic (I2 < 30% indicates low between-study heterogeneity).
Figure 3—figure supplement 2.
Figure 3—figure supplement 2.. Risk-of-bias sensitivity analysis of between-study heterogeneity for SARS-CoV-1 respiratory viral load (rVL) during the estimated infectious period.
Random-effects meta-analyses, based on the risk of bias of contributing studies, of the expected rVLs of SARS cases during the infectious period. Quantitative rVLs refer to virus concentrations in the respiratory tract. Case types: hospitalized (H), adult (A) and symptomatic (S). Specimen types: nasopharyngeal aspirate (NPA) and nasopharyngeal swab (NPS). Dashes denote case numbers that were not obtained. Box sizes denote weighting in the overall estimates. One-sided Welch’s t-test for difference, non-significance (p>0.05). Between-study heterogeneity was assessed using the p-value from Cochran’s Q test (non-significance, p>0.05) and the I2 statistic (I2 < 30% indicates low between-study heterogeneity).
Figure 3—figure supplement 3.
Figure 3—figure supplement 3.. Risk-of-bias sensitivity analysis of between-study heterogeneity for A(H1N1)pdm09 respiratory viral load (rVL) during the estimated infectious period.
Random-effects meta-analyses, based on the risk of bias of contributing studies, of the expected rVLs of A(H1N1)pdm09 cases during the infectious period. Quantitative rVLs refer to virus concentrations in the respiratory tract. Case types: hospitalized (H), not admitted (N), community (C), adult (A), pediatric (P), symptomatic (S), presymptomatic (Ps) and asymptomatic (As). Specimen types: nasopharyngeal aspirate (NPA), nasopharyngeal swab (NPS) and oropharyngeal swab (OPS). Dashes denote case numbers that were not obtained. Box sizes denote weighting in the overall estimates. One-sided Welch’s t-test for difference (non-significance, p>0.05). Between-study heterogeneity was assessed using the p-value from Cochran’s Q test (non-significance, p>0.05) and the I2 statistic (I2 < 30% indicates low between-study heterogeneity).
Figure 3—figure supplement 4.
Figure 3—figure supplement 4.. Risk-of-bias sensitivity analysis of between-study heterogeneity for SARS-CoV-2 respiratory viral load (rVL) for adult COVID-19 cases during the estimated infectious period.
Random-effects meta-analyses, based on the risk of bias of contributing studies, of the expected rVLs of adult (≥18 years old) COVID-19 cases during the infectious period. Quantitative rVLs refer to virus concentrations in the respiratory tract. Case types: hospitalized (H), not admitted (N), community (C), adult (A), pediatric (P), symptomatic (S), presymptomatic (Ps) and asymptomatic (As). Specimen types: endotracheal aspirate (ETA), nasopharyngeal aspirate (NPA), nasopharyngeal swab (NPS), oropharyngeal swab (OPS), posterior oropharyngeal saliva (POS) and sputum (Spu). Dashes denote case numbers that were not obtained. Box sizes denote weighting in the overall estimates. One-sided Welch’s t-test for difference (non-significance, p>0.05). Between-study heterogeneity was assessed using the p-value from Cochran’s Q test (non-significance, p>0.05) and the I2 statistic (I2 <30% indicates low between-study heterogeneity).
Figure 3—figure supplement 5.
Figure 3—figure supplement 5.. Risk-of-bias sensitivity analysis of between-study heterogeneity for SARS-CoV-2 respiratory viral load (rVL) for symptomatic/presymptomatic COVID-19 cases during the estimated infectious period.
Random-effects meta-analyses, based on the risk of bias of contributing studies, of the expected rVLs of symptomatic/presymptomatic (≥18 years old) COVID-19 cases during the infectious period. Quantitative rVLs refer to virus concentrations in the respiratory tract. Case types: hospitalized (H), not admitted (N), community (C), adult (A), pediatric (P), symptomatic (S), presymptomatic (Ps) and asymptomatic (As). Specimen types: endotracheal aspirate (ETA), nasopharyngeal swab (NPS), oropharyngeal swab (OPS), posterior oropharyngeal saliva (POS) and sputum (Spu). Dashes denote case numbers that were not obtained. Box sizes denote weighting in the overall estimates. One-sided Welch’s t-test for difference (non-significance, p>0.05). Between-study heterogeneity was assessed using the p-value from Cochran’s Q test (non-significance, p>0.05) and the I2 statistic the I2 statistic (I2 < 30% indicates low between-study heterogeneity).
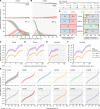
Figure 4.
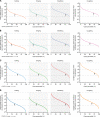
Figure 4.. Heterogeneity and kinetics of SARS-CoV-2 respiratory viral load (rVL).
(A) Estimated distribution of rVL for SARS-CoV-2 (N = 3834 samples from N = 26 studies) and A(H1N1)pdm09 (N = 512 samples from N = 10 studies) throughout the infectious periods. (B, C) Estimated distribution of SARS-CoV-2 rVL for adult (N = 3575 samples from N = 20 studies) and pediatric (N = 198 samples from N = 9 studies) (B) and symptomatic/presymptomatic (N = 1574 samples from N = 22 studies) and asymptomatic (N = 2221 samples from N = 7 studies) (C) COVID-19 cases. (D) SARS-CoV-2 rVLs fitted to a mechanistic model of viral kinetics (black curve, r2 = 0.84 for mean estimates). Filled circles and bars depict mean estimates and 95% confidence intervals. Open circles show the entirety of individual sample data over days from symptom onset (DFSO) (left to right, N = 3, 15, 50, 63, 71, 75, 85, 93, 105, 136, 123, 128 and 115 samples from N = 21 studies). (E) Estimated distributions of SARS-CoV-2 rVL across DFSO. Weibull distributions were fitted on the entirety of individual sample data for the virus, subgroup or DFSO in the systematic dataset. Arrows denote 90th case percentiles for SARS-CoV-2 rVL distributions.
Figure 4—figure supplement 1.
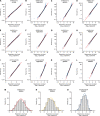
Figure 4—figure supplement 1.. Respiratory viral loads for SARS-CoV-2, SARS-CoV-1 and A(H1N1)pdm09 best conform to Weibull distributions.
(AD) Normal (p≤0.01) (A), lognormal (p≤0.01) (B), gamma (p≤0.005) (C) and Weibull (p>0.10, not significant [NS]) (D) probability plots for individual sample data of SARS-CoV-2 respiratory viral loads (rVLs) across days from symptom onset in the systematic dataset (N = 941 samples from N = 20 studies). (EH) Normal (p>0.05, NS) (E), lognormal (p≤0.01) (F), gamma (p>0.05, NS) (G) and Weibull (p>0.10, NS) (H) probability plots for individual sample data of SARS-CoV-1 rVLs in the systematic dataset (N = 303 samples from N = 5 studies). (IL) Normal (p≤0.01) (I), lognormal (p≤0.01) (J), gamma (p≤0.005) (K) and Weibull (p>0.10, NS) (L) probability plots for individual sample data of A(H1N1)pdm09 rVLs in the systematic dataset (N = 512 samples from N = 10 studies). These categories included rVL data from positive (above the detection limit) assay measurements. The p-values were determined using the modified Kolmogorov–Smirnov test for the goodness of fit of each distribution. When the null hypothesis is accepted (NS at p>0.05), the probability density function cannot be rejected to describe the distribution of the data. Blue circles, black lines and red lines represent individual sample data, expected distributions and 95% confidence intervals, respectively. (MO) Histograms and fitted Weibull distributions of the above data for SARS-CoV-2 (M), SARS-CoV-1 (N) and A(H1N1)pdm09 (O).
Figure 4—figure supplement 2.
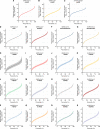
Figure 4—figure supplement 2.. Case heterogeneity in respiratory viral loads (rVLs) across viruses, COVID-19 subgroups and disease course.
(A–C) Estimated rVLs of SARS-CoV-2 (A), SARS-CoV-1 (B) and A(H1N1)pdm09 (C) across case percentile (cp) throughout the infectious periods. (DG) Estimated SARS-CoV-2 rVLs for adult (D), pediatric (E), symptomatic/presymptomatic (F) and asymptomatic (G) cases across cp throughout the infectious period. (HS) Estimated SARS-CoV-2 rVLs across cp on different days from symptom onset (DFSO) during the infectious period. Earlier DFSO were excluded based on limited data. Data ranged between the 1st and 99th cps. Lines and bands represent estimates and 95% confidence intervals, respectively.
Figure 4—figure supplement 3.
Figure 4—figure supplement 3.. Descriptive parameters for respiratory viral loads based on individual sample data.
Figure 4—figure supplement 4.
Figure 4—figure supplement 4.. Model parameters describing SARS-CoV-2 kinetics during respiratory infection.
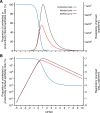
Figure 4—figure supplement 5.
Figure 4—figure supplement 5.. Kinetics of SARS-CoV-2 and airway epithelial cells during respiratory infection.
(A, B) Estimated kinetics of uninfected (blue) and productively infected (red) airway epithelial cells (left axis) and SARS-CoV-2 (right axis) in the respiratory tract, as shown in linear (A) and logarithmic (B) scales.
Figure 5.
Figure 5.. Heterogeneity in shedding SARS-CoV-2 via droplets and aerosols.
(A, B) Estimated likelihood of respiratory particles containing viable SARS-CoV-2 when expelled by the mean (top) or 98th case percentile (cp) (bottom) COVID-19 cases at −1 (A) or 1 (B) days from symptom onset (DFSO). For higher number of virions, some likelihood curves were omitted to aid visualization. When the likelihood for zero virions approaches 0%, particles are expected to contain at least one viable copy. (CF) Rate that the mean and 98th cp COVID-19 cases at 1 DFSO shed viable SARS-CoV-2 by talking, singing, breathing or coughing over particle size. (G) Relative contributions of droplets and aerosols to shedding virions for each respiratory activity (left). Relative contribution of buoyant, long-range and short-range aerosols to shedding virions via aerosols for each respiratory activity (right). (H) Case heterogeneity in the total shedding rate (over all particle sizes) of virions via singing across the infectious period. Earlier presymptomatic days were excluded based on limited data. Data range between the 1st and 99th cps. Lines and bands represent estimates and 95% confidence intervals, respectively, for estimated likelihoods or Poisson means.
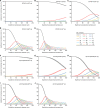
Figure 5—figure supplement 1.
Figure 5—figure supplement 1.. Likelihood of respiratory particles containing SARS-CoV-2 or A(H1N1)pdm09.
(A–E) Estimated likelihood that droplets and aerosols contain viable SARS-CoV-2 when expelled by the 25th case percentile (cp) (A), mean (B), 65th cp (C), 80th cp (D) or 90th cp (E) for COVID-19 cases during the infectious period. (F–J) Estimated likelihood that droplets and aerosols contain viable A(H1N1)pdm09 when expelled by the 25th cp (F), mean (G), 65th cp (H), 80th cp (I) or 90th cp (J) for A(H1N1)pmd09 cases during the infectious period. For higher number of virions, some likelihood curves were omitted to aid visualization. Equilibrium particle diameters were taken to be 0.3 times the hydrated diameter during atomization. When the likelihood for zero virions approaches 0%, particles are expected to contain at least one viable copy. Lines and bands represent estimates and 95% confidence intervals, respectively, for estimated likelihoods.
Figure 5—figure supplement 2.
Figure 5—figure supplement 2.. Rate profiles for particle expelled by respiratory activities.
(A–D) Rate profiles of particles expelled while talking (A), singing (B), breathing (C) and coughing (D). (E) Comparison of the rate profiles of aerosol emission from singing and different amplitudes of talking. The rate profiles were calculated from the normalized concentrations in Johnson et al., 2011 (A, B, D and E) and Morawska et al., 2009 (C) or collected from Asadi et al. (2019) (E). Equilibrium particle diameters were taken to be 0.3 times the hydrated diameter during atomization. Breathing was taken to expel negligible quantities of larger particles based on the bronchiolar fluid film burst mechanism.
Figure 5—figure supplement 3.
Figure 5—figure supplement 3.. Heterogeneity in shedding SAR-CoV-2 via talking, breathing and coughing.
(A–C) Case heterogeneity in the total SARS-CoV-2 shedding rate (over all particle sizes) by talking at a moderate amplitude (A), breathing (B) or coughing (C) for COVID-19 cases across the infectious period. Earlier presymptomatic days were excluded based on low specimen numbers. Data represent estimated rates for viable virus and range between the 1st and 99thcase percentiles. Lines and bands represent estimates and 95% confidence intervals, respectively.
Figure 5—figure supplement 4.
Figure 5—figure supplement 4.. Heterogeneity in infectiousness for COVID-19 and A(H1N1)pmd09 cases during the infectious period.
(A, B) Estimated time for a A(H1N1)pdm09 case to expel one virion via only aerosols (A) or either droplets or aerosols (B) by talking, singing, breathing or coughing. (C, D) Estimated time for a COVID-19 case to expel one SARS-CoV-2 virion via only aerosols (C) or either droplets or aerosols (D) by talking, singing, breathing or coughing. Data represent estimated times to expel viable virus and range between the 1st and 99th case percentiles (cps). Vertical arrows depict the cp expected to shed one virion in 24 hr (talking, singing or breathing) or 100 coughs. Lines and bands represent estimates and 95% confidence intervals, respectively.
Figure 5—figure supplement 5.
Figure 5—figure supplement 5.. Heterogeneity in shedding A(H1N1)pdm09 via droplets and aerosols.
(A–D) Case heterogeneity in the total A(H1N1)pdm09 shedding rates while talking (A), singing (B), breathing (C) and coughing (D) during the infectious period. Data represent estimated rates for viable virus and range between the 1st and 99thcase percentiles. Lines and bands represent estimates and 95% confidence intervals, respectively.

Similar articles

Cited by

References

    1. Adam DC, Wu P, Wong JY, Lau EHY, Tsang TK, Cauchemez S, Leung GM, Cowling BJ. Clustering and superspreading potential of SARS-CoV-2 infections in Hong Kong. Nature Medicine. 2020;26:1714–1719. doi: 10.1038/s41591-020-1092-0. - DOI - PubMed
    1. Argyropoulos KV, Serrano A, Hu J, Black M, Feng X, Shen G, Call M, Kim MJ, Lytle A, Belovarac B, Vougiouklakis T, Lin LH, Moran U, Heguy A, Troxel A, Snuderl M, Osman I, Cotzia P, Jour G. Association of initial viral load in severe acute respiratory syndrome coronavirus 2 (SARS-CoV-2) Patients with outcome and symptoms. The American Journal of Pathology. 2020;190:1881–1887. doi: 10.1016/j.ajpath.2020.07.001. - DOI - PMC - PubMed
    1. Arons MM, Hatfield KM, Reddy SC, Kimball A, James A, Jacobs JR, Taylor J, Spicer K, Bardossy AC, Oakley LP, Tanwar S, Dyal JW, Harney J, Chisty Z, Bell JM, Methner M, Paul P, Carlson CM, McLaughlin HP, Thornburg N, Tong S, Tamin A, Tao Y, Uehara A, Harcourt J, Clark S, Brostrom-Smith C, Page LC, Kay M, Lewis J, Montgomery P, Stone ND, Clark TA, Honein MA, Duchin JS, Jernigan JA. Presymptomatic SARS-CoV-2 infections and transmission in a skilled nursing facility. New England Journal of Medicine. 2020;382:2081–2090. doi: 10.1056/NEJMoa2008457. - DOI - PMC - PubMed
    1. Asadi S, Wexler AS, Cappa CD, Barreda S, Bouvier NM, Ristenpart WD. Effect of voicing and articulation manner on aerosol particle emission during human speech. PLOS ONE. 2020;15:e0227699. doi: 10.1371/journal.pone.0227699. - DOI - PMC - PubMed
    1. Baccam P, Beauchemin C, Macken CA, Hayden FG, Perelson AS. Kinetics of influenza A virus infection in humans. Journal of Virology. 2006;80:7590–7599. doi: 10.1128/JVI.01623-05. - DOI - PMC - PubMed

Publication types

MeSH terms