Predicting tumor response to drugs based on gene-expression biomarkers of sensitivity learned from cancer cell lines
- PMID: 33858332
- PMCID: PMC8048084
- DOI: 10.1186/s12864-021-07581-7
Predicting tumor response to drugs based on gene-expression biomarkers of sensitivity learned from cancer cell lines
Abstract
Background: Human cancer cell line profiling and drug sensitivity studies provide valuable information about the therapeutic potential of drugs and their possible mechanisms of action. The goal of those studies is to translate the findings from in vitro studies of cancer cell lines into in vivo therapeutic relevance and, eventually, patients' care. Tremendous progress has been made.
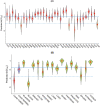
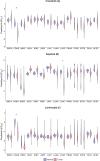
Results: In this work, we built predictive models for 453 drugs using data on gene expression and drug sensitivity (IC50) from cancer cell lines. We identified many known drug-gene interactions and uncovered several potentially novel drug-gene associations. Importantly, we further applied these predictive models to ~ 17,000 bulk RNA-seq samples from The Cancer Genome Atlas (TCGA) and the Genotype-Tissue Expression (GTEx) database to predict drug sensitivity for both normal and tumor tissues. We created a web site for users to visualize and download our predicted data ( https://manticore.niehs.nih.gov/cancerRxTissue ). Using trametinib as an example, we showed that our approach can faithfully recapitulate the known tumor specificity of the drug.
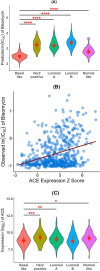
Conclusions: We demonstrated that our approach can predict drugs that 1) are tumor-type specific; 2) elicit higher sensitivity from tumor compared to corresponding normal tissue; 3) elicit differential sensitivity across breast cancer subtypes. If validated, our prediction could have relevance for preclinical drug testing and in phase I clinical design.
Keywords: And CCLE; Cancer cell line; Drug sensitivity; GA/KNN; GDSC; GTEx; RNA-seq; TCGA.
Conflict of interest statement
The authors declare that they have no competing interests.
Figures


Similar articles
-
Predicting breast cancer drug response using a multiple-layer cell line drug response network model.BMC Cancer. 2021 May 31;21(1):648. doi: 10.1186/s12885-021-08359-6. BMC Cancer. 2021. PMID: 34059012 Free PMC article.
-
Identifying anti-cancer drug response related genes using an integrative analysis of transcriptomic and genomic variations with cell line-based drug perturbations.Oncotarget. 2016 Feb 23;7(8):9404-19. doi: 10.18632/oncotarget.7012. Oncotarget. 2016. PMID: 26824188 Free PMC article.
-
Circular RNAs and their associations with breast cancer subtypes.Oncotarget. 2016 Dec 6;7(49):80967-80979. doi: 10.18632/oncotarget.13134. Oncotarget. 2016. PMID: 27829232 Free PMC article.
-
Current progress in the prediction of chemosensitivity for breast cancer.Breast Cancer. 2004;11(1):42-8. doi: 10.1007/BF02968001. Breast Cancer. 2004. PMID: 14718792 Review.
-
Current Trends in Drug Sensitivity Prediction.Curr Pharm Des. 2016;22(46):6918-6927. doi: 10.2174/1381612822666161026154430. Curr Pharm Des. 2016. PMID: 27784247 Review.
Cited by
-
Multiomics analysis identifies oxidative phosphorylation as a cancer vulnerability arising from myristoylation inhibition.J Transl Med. 2024 May 7;22(1):431. doi: 10.1186/s12967-024-05150-6. J Transl Med. 2024. PMID: 38715059 Free PMC article.
-
Development of a polygenic score predicting drug resistance and patient outcome in breast cancer.NPJ Precis Oncol. 2024 Oct 2;8(1):219. doi: 10.1038/s41698-024-00714-7. NPJ Precis Oncol. 2024. PMID: 39358487 Free PMC article.
-
MAPK inhibitor sensitivity scores predict sensitivity driven by the immune infiltration in pediatric low-grade gliomas.Nat Commun. 2023 Jul 27;14(1):4533. doi: 10.1038/s41467-023-40235-8. Nat Commun. 2023. PMID: 37500667 Free PMC article.
-
Computational Screening of Anti-Cancer Drugs Identifies a New BRCA Independent Gene Expression Signature to Predict Breast Cancer Sensitivity to Cisplatin.Cancers (Basel). 2022 May 13;14(10):2404. doi: 10.3390/cancers14102404. Cancers (Basel). 2022. PMID: 35626009 Free PMC article.
-
The Genetic, Pharmacogenomic, and Immune Landscapes Associated with Protein Expression across Human Cancers.Cancer Res. 2023 Nov 15;83(22):3673-3680. doi: 10.1158/0008-5472.CAN-23-0758. Cancer Res. 2023. PMID: 37548539 Free PMC article.
References
MeSH terms
Substances
Grants and funding
LinkOut - more resources
Full Text Sources
Other Literature Sources
Medical

