

Single-Cell Transcriptomics and In Situ Morphological Analyses Reveal Microglia Heterogeneity Across the Nigrostriatal Pathway
- PMID: 33854507
- PMCID: PMC8039119
- DOI: 10.3389/fimmu.2021.639613
Single-Cell Transcriptomics and In Situ Morphological Analyses Reveal Microglia Heterogeneity Across the Nigrostriatal Pathway
Abstract
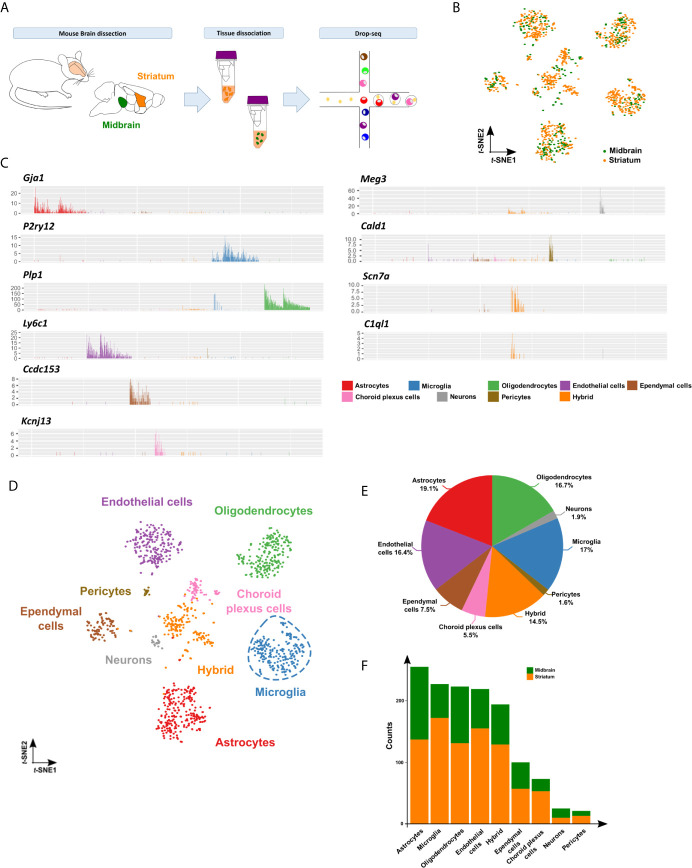
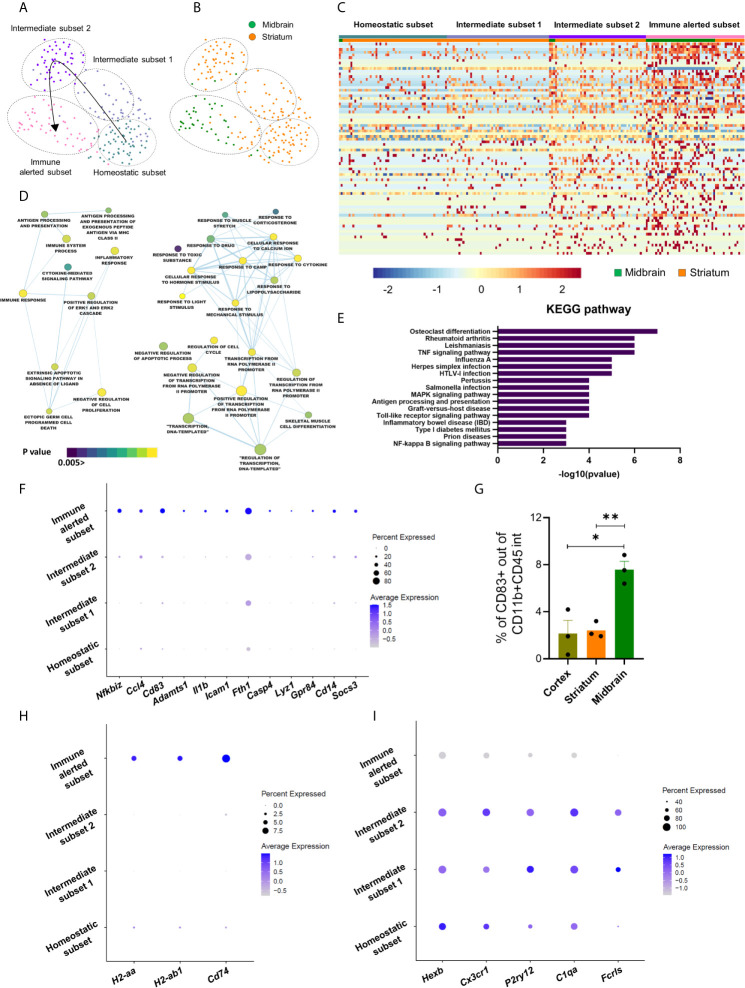
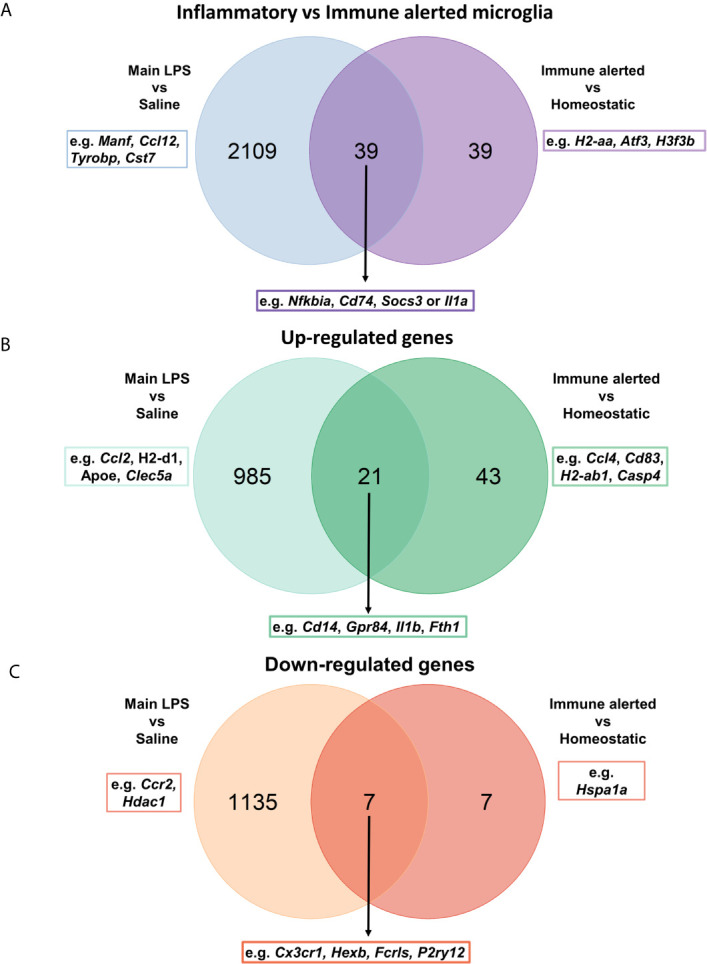
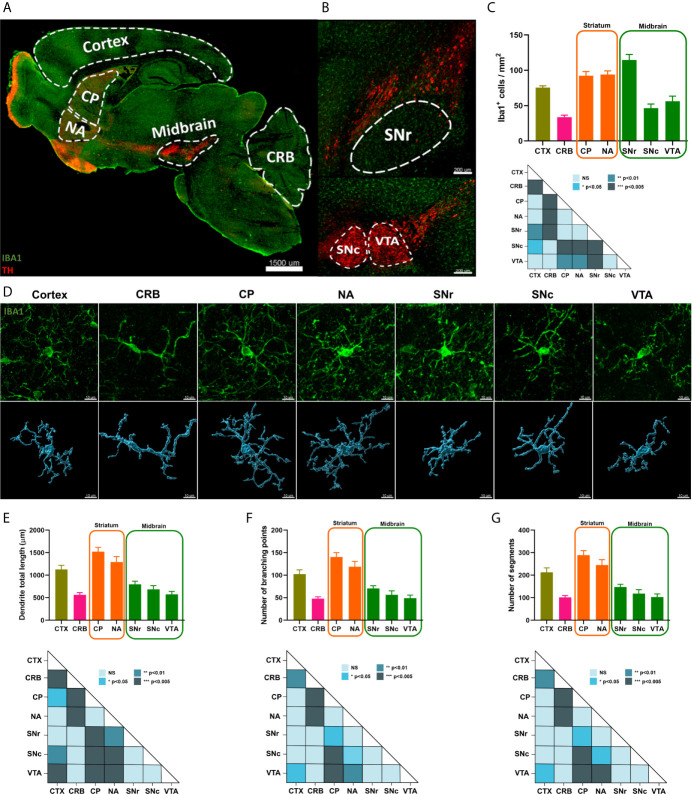
Microglia are the resident immune effector cells of the central nervous system (CNS) rapidly reacting to various pathological stimuli to maintain CNS homeostasis. However, microglial reactions in the CNS may also worsen neurological disorders. Hence, the phenotypic analysis of microglia in healthy tissue may identify specific poised subsets ultimately supporting or harming the neuronal network. This is all the more important for the understanding of CNS disorders exhibiting regional-specific and cellular pathological hallmarks, such as many neurodegenerative disorders, including Parkinson's disease (PD). In this context, we aimed to address the heterogeneity of microglial cells in susceptible brain regions for PD, such as the nigrostriatal pathway. Here, we combined single-cell RNA-sequencing with immunofluorescence analyses of the murine nigrostriatal pathway, the most affected brain region in PD. We uncovered a microglia subset, mainly present in the midbrain, displaying an intrinsic transcriptional immune alerted signature sharing features of inflammation-induced microglia. Further, an in situ morphological screening of inferred cellular diversity showed a decreased microglia complexity in the midbrain when compared to striatum. Our study provides a resource for the identification of specific microglia phenotypes within the nigrostriatal pathway, which may be relevant in PD.
Keywords: Parkinson’s disease; cell morphology; cellular heterogeneity; immune alerted; microglia; nigrostriatal pathway; single-cell transcriptomics.
Copyright © 2021 Uriarte Huarte, Kyriakis, Heurtaux, Pires-Afonso, Grzyb, Halder, Buttini, Skupin, Mittelbronn and Michelucci.
Conflict of interest statement
The authors declare that the research was conducted in the absence of any commercial or financial relationships that could be construed as a potential conflict of interest.
Figures
Similar articles
-
Single-cell transcriptomics reveals distinct inflammation-induced microglia signatures.EMBO Rep. 2018 Nov;19(11):e46171. doi: 10.15252/embr.201846171. Epub 2018 Sep 11. EMBO Rep. 2018. PMID: 30206190 Free PMC article.
-
Single-cell brain atlas of Parkinson's disease mouse model.J Genet Genomics. 2021 Apr 20;48(4):277-288. doi: 10.1016/j.jgg.2021.01.003. Epub 2021 Feb 18. J Genet Genomics. 2021. PMID: 34052184
-
Transcriptional profiling in microglia across physiological and pathological states identifies a transcriptional module associated with neurodegeneration.Commun Biol. 2024 Sep 18;7(1):1168. doi: 10.1038/s42003-024-06684-7. Commun Biol. 2024. PMID: 39294270 Free PMC article.
-
Microglia in Health and Disease: The Strength to Be Diverse and Reactive.Front Cell Neurosci. 2021 Mar 31;15:660523. doi: 10.3389/fncel.2021.660523. eCollection 2021. Front Cell Neurosci. 2021. PMID: 33867943 Free PMC article. Review.
-
Neuroinflammation in Alzheimer's disease and Parkinson's disease: are microglia pathogenic in either disorder?Int Rev Neurobiol. 2007;82:235-46. doi: 10.1016/S0074-7742(07)82012-5. Int Rev Neurobiol. 2007. PMID: 17678964 Review.
Cited by
-
Human iPSC-derived microglia carrying the LRRK2-G2019S mutation show a Parkinson's disease related transcriptional profile and function.Sci Rep. 2023 Dec 13;13(1):22118. doi: 10.1038/s41598-023-49294-9. Sci Rep. 2023. PMID: 38092815 Free PMC article.
-
Microglial expression of CD83 governs cellular activation and restrains neuroinflammation in experimental autoimmune encephalomyelitis.Nat Commun. 2023 Aug 1;14(1):4601. doi: 10.1038/s41467-023-40370-2. Nat Commun. 2023. PMID: 37528070 Free PMC article.
-
Microglia Mediated Neuroinflammation in Parkinson's Disease.Cells. 2023 Mar 25;12(7):1012. doi: 10.3390/cells12071012. Cells. 2023. PMID: 37048085 Free PMC article. Review.
-
Modulation of cannabinoid receptor 2 alters neuroinflammation and reduces formation of alpha-synuclein aggregates in a rat model of nigral synucleinopathy.J Neuroinflammation. 2024 Sep 27;21(1):240. doi: 10.1186/s12974-024-03221-5. J Neuroinflammation. 2024. PMID: 39334169 Free PMC article.
-
The heterogeneity of microglial activation and its epigenetic and non-coding RNA regulations in the immunopathogenesis of neurodegenerative diseases.Cell Mol Life Sci. 2022 Sep 6;79(10):511. doi: 10.1007/s00018-022-04536-3. Cell Mol Life Sci. 2022. PMID: 36066650 Review.
References
Publication types
MeSH terms
Grants and funding
LinkOut - more resources
Full Text Sources
Other Literature Sources
Molecular Biology Databases