

An Analysis of Glucose Effectiveness in Subjects With or Without Type 2 Diabetes via Hierarchical Modeling
- PMID: 33854483
- PMCID: PMC8039510
- DOI: 10.3389/fendo.2021.641713
An Analysis of Glucose Effectiveness in Subjects With or Without Type 2 Diabetes via Hierarchical Modeling
Abstract
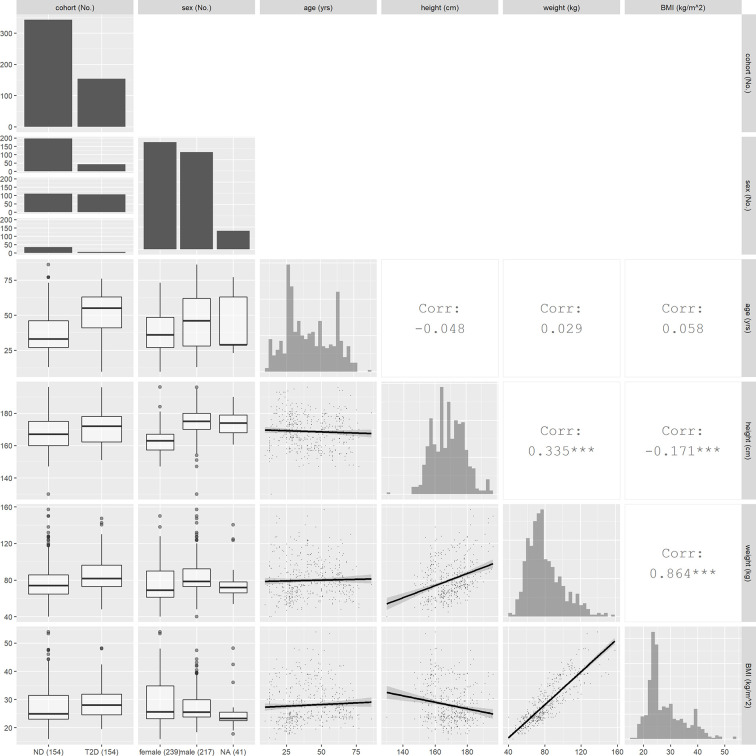
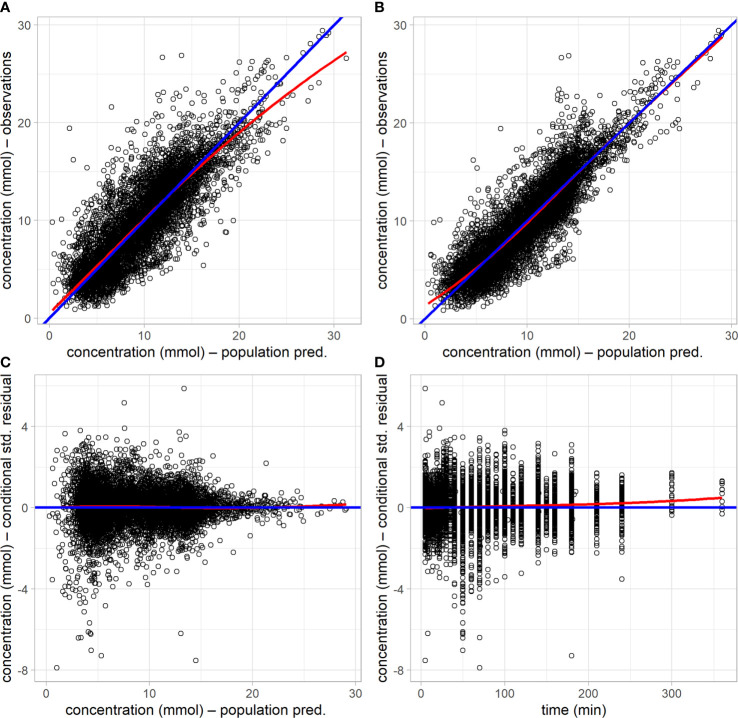
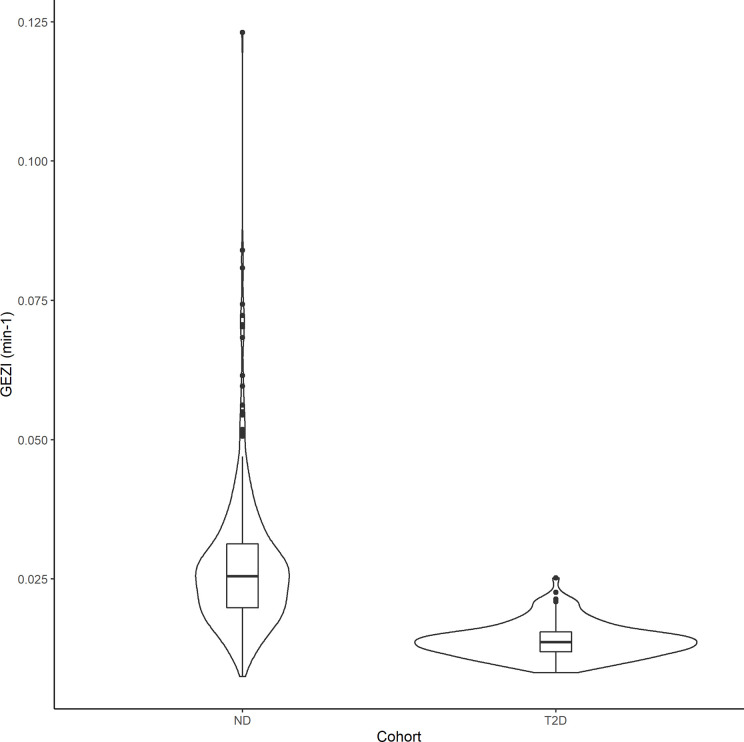
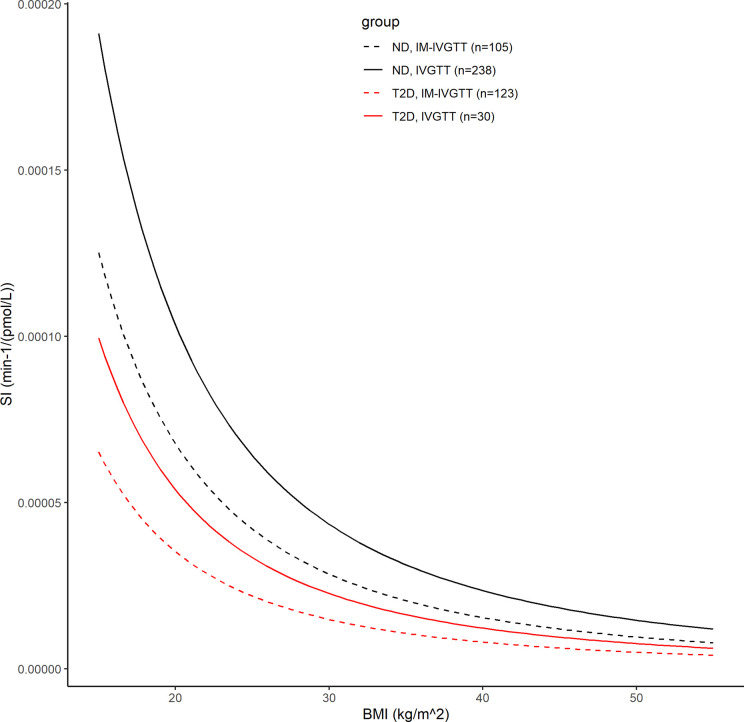
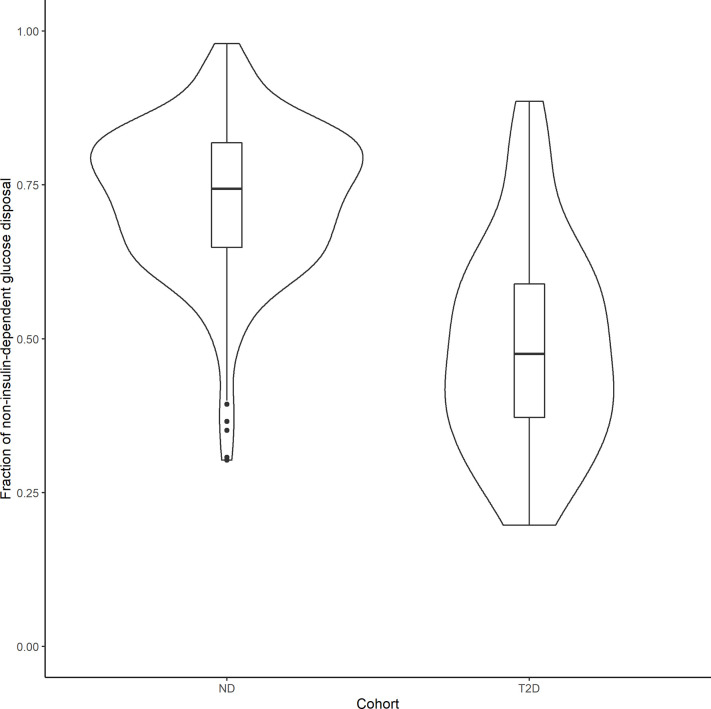
Glucose effectiveness, defined as the ability of glucose itself to increase glucose utilization and inhibit hepatic glucose production, is an important mechanism maintaining normoglycemia. We conducted a minimal modeling analysis of glucose effectiveness at zero insulin (GEZI) using intravenous glucose tolerance test data from subjects with type 2 diabetes (T2D, n=154) and non-diabetic (ND) subjects (n=343). A hierarchical statistical analysis was performed, which provided a formal mechanism for pooling the data from all study subjects, to yield a single composite population model that quantifies the role of subject specific characteristics such as weight, height, age, sex, and glucose tolerance. Based on the resulting composite population model, GEZI was reduced from 0.021 min-1 (standard error - 0.00078 min-1) in the ND population to 0.011 min-1 (standard error - 0.00045 min-1) in T2D. The resulting model was also employed to calculate the proportion of the non-insulin-dependent net glucose uptake in each subject receiving an intravenous glucose load. Based on individual parameter estimates, the fraction of total glucose disposal independent of insulin was 72.8% ± 12.0% in the 238 ND subjects over the course of the experiment, indicating the major contribution to the whole-body glucose clearance under non-diabetic conditions. This fraction was significantly reduced to 48.8% ± 16.9% in the 30 T2D subjects, although still accounting for approximately half of the total in the T2D population based on our modeling analysis. Given the potential application of glucose effectiveness as a predictor of glucose intolerance and as a potential therapeutic target for treating diabetes, more investigations of glucose effectiveness in other disease conditions can be conducted using the hierarchical modeling framework reported herein.
Keywords: EM algorithm; glucose-insulin; insulin sensitivity; intravenous glucose tolerance test; minimal model.
Copyright © 2021 Hu, Lu, Tura, Pacini and D’Argenio.
Conflict of interest statement
The authors declare that the research was conducted in the absence of any commercial or financial relationships that could be construed as a potential conflict of interest.
Figures
Similar articles
-
Assessment of glucose effectiveness from short IVGTT in individuals with different degrees of glucose tolerance.Acta Diabetol. 2018 Oct;55(10):1011-1018. doi: 10.1007/s00592-018-1182-3. Epub 2018 Jun 21. Acta Diabetol. 2018. PMID: 29931422
-
Pathogenic mechanism of type 2 diabetes in Ghanaians--the importance of beta cell secretion, insulin sensitivity and glucose effectiveness.S Afr Med J. 2002 May;92(5):377-84. S Afr Med J. 2002. PMID: 12108171
-
Metabolic predictors of impaired glucose tolerance and type 2 diabetes in a predisposed population--A prospective cohort study.BMC Endocr Disord. 2015 Sep 25;15:51. doi: 10.1186/s12902-015-0048-8. BMC Endocr Disord. 2015. PMID: 26407933 Free PMC article.
-
Modeling the oral glucose tolerance test in normal and impaired glucose tolerant states: a population approach.Curr Med Res Opin. 2017 Feb;33(2):305-313. doi: 10.1080/03007995.2016.1254607. Epub 2016 Dec 31. Curr Med Res Opin. 2017. PMID: 27794624
-
Central Nervous System Control of Glucose Homeostasis: A Therapeutic Target for Type 2 Diabetes?Annu Rev Pharmacol Toxicol. 2022 Jan 6;62:55-84. doi: 10.1146/annurev-pharmtox-052220-010446. Annu Rev Pharmacol Toxicol. 2022. PMID: 34990204 Free PMC article. Review.
Cited by
-
Predictive link between systemic metabolism and cytokine signatures in the brain of apolipoprotein E ε4 mice.Neurobiol Aging. 2023 Mar;123:154-169. doi: 10.1016/j.neurobiolaging.2022.11.015. Epub 2022 Dec 5. Neurobiol Aging. 2023. PMID: 36572594 Free PMC article.
References
Publication types
MeSH terms
Substances
Grants and funding
LinkOut - more resources
Full Text Sources
Other Literature Sources
Medical
Miscellaneous