

The Effects of Asthma on the Association Between Pulmonary Function and Obesity: A 16-Year Longitudinal Study
- PMID: 33854341
- PMCID: PMC8041605
- DOI: 10.2147/JAA.S299186
The Effects of Asthma on the Association Between Pulmonary Function and Obesity: A 16-Year Longitudinal Study
Abstract
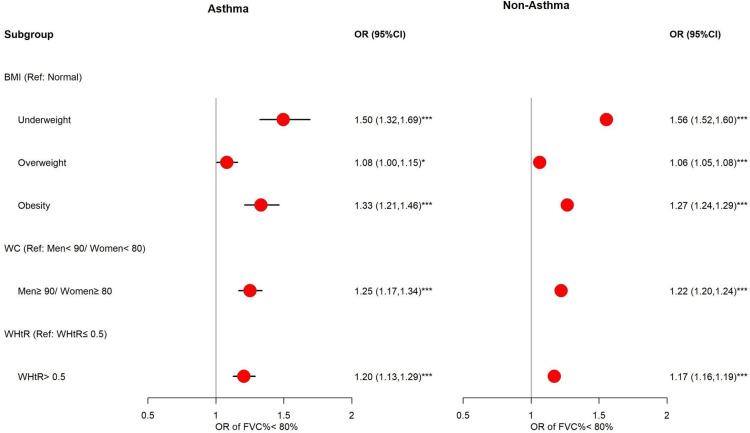
Background: Asthma and obesity are important public health issues around the world. Obesity is considered a risk factor associated with the severity and incidence of asthma. We investigated the relationships between poor pulmonary function (defined by forced vital capacity (FVC) and percentage of predicted FVC (FVC%)) and obesity.
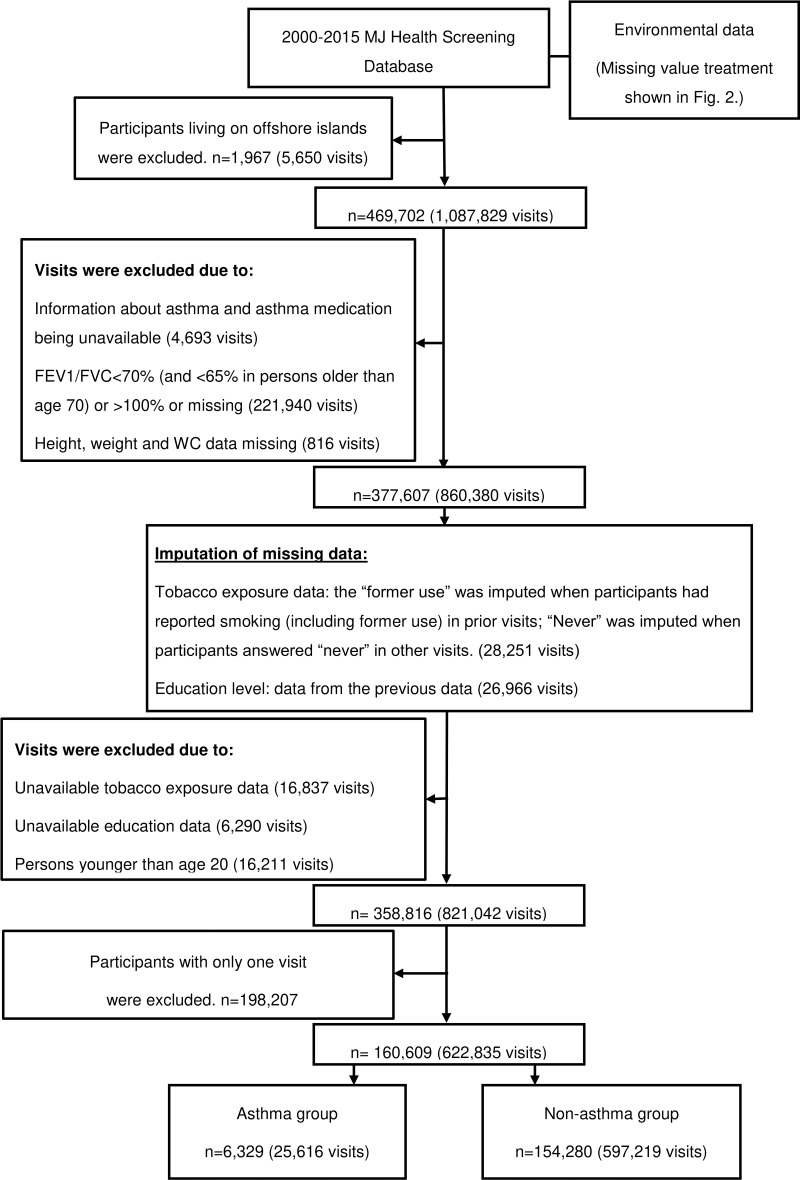
Methods: This is a retrospective longitudinal study using the MJ health examination database in Taiwan from 2000 to 2015. There were 160,609 participants aged ≥20 years with complete obesity indicators and lung function data, and having at least two visits. A generalized estimation equation (GEE) model was applied to estimate the association between lung function and obesity.
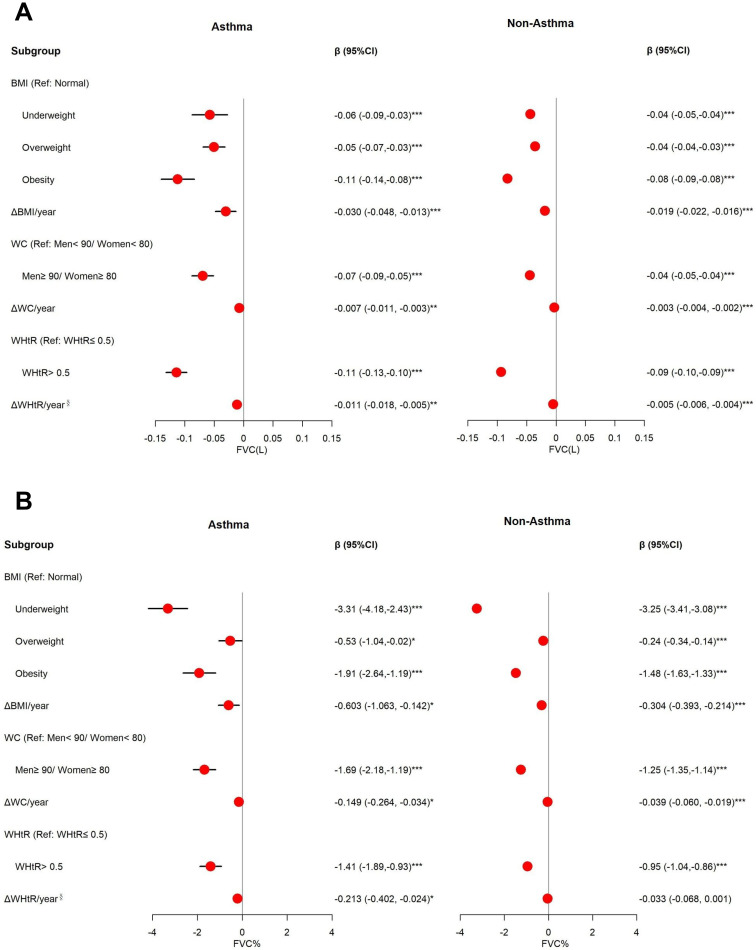
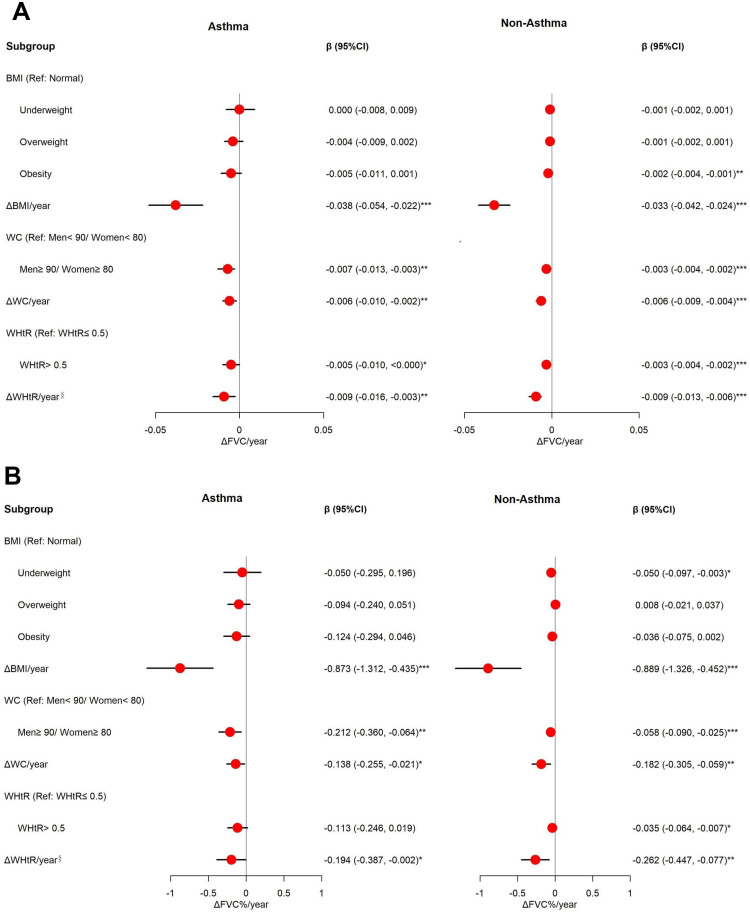
Results: BMI was the best indicator to predict poor pulmonary function for our participants. Results of BMI are presented as an example: Obesity (body mass index (BMI) ≥27.0 kg/m2) is significantly associated with lower FVC [adjusted coefficients (β) for asthmatics: -0.11 L (95% CI: -0.14, -0.08); adjusted β for non-asthmatics: -0.08 L (-0.09, -0.08)] and FVC% [adjusted β for asthmatics: -1.91% (95% CI: -2.64, -1.19); adjusted β for non-asthmatics: 1.48% (-1.63, -1.33)]. Annual change of BMI (ΔBMI/year) is an independent risk factor for decreased FVC [adjusted β for asthmatics: -0.030 L (-0.048, -0.013); adjusted β for non-asthmatics: -0.019 L (-0.022, -0.016)] and FVC% [adjusted β for non-asthmatics: -0.603% (-1.063, -0.142); adjusted β for non-asthmatics: -0.304% (-0.393, -0.214)], and is significantly associated with accelerated FVC decline [adjusted β of ΔFVC/year and ΔFVC %/year for asthmatics: -0.038 L (-0.054, -0.022) and -0.873% (-1.312, -0.435); adjusted β of ΔFVC/year and ΔFVC %/year for non-asthmatics: -0.033 L (-0.042, -0.024) and -0.889% (-1.326, -0.452)].
Conclusion: Obesity is significantly associated with decreased lung function, and asthmatics had a higher risk than non-asthmatics.
Keywords: BMI; FVC; asthma; obesity; pulmonary function.
© 2021 Huang et al.
Conflict of interest statement
The authors declare that they have no conflicts of interest for this work.
Figures
Similar articles
-
Symptoms and lung function decline in a middle-aged cohort of males and females in Australia.Int J Chron Obstruct Pulmon Dis. 2016 May 26;11:1097-103. doi: 10.2147/COPD.S103817. eCollection 2016. Int J Chron Obstruct Pulmon Dis. 2016. PMID: 27307725 Free PMC article.
-
Effect of obesity on asthma phenotype is dependent upon asthma severity.J Asthma. 2011 Feb;48(1):98-104. doi: 10.3109/02770903.2010.534220. Epub 2010 Nov 22. J Asthma. 2011. PMID: 21091180 Free PMC article.
-
Gender differences in effects of obesity and asthma on adolescent lung function: Results from a population-based study.J Asthma. 2017 Apr;54(3):279-285. doi: 10.1080/02770903.2016.1212367. Epub 2016 Jul 19. J Asthma. 2017. PMID: 27435689
-
Association between obesity and lung function changes by sex and age in adults with asthma.J Asthma. 2022 Jan;59(1):59-69. doi: 10.1080/02770903.2020.1839904. Epub 2020 Nov 4. J Asthma. 2022. PMID: 33125287
-
Association of general and abdominal obesity with lung function, FeNO, and blood eosinophils in adult asthmatics: Findings from NHANES 2007-2012.Front Physiol. 2023 Feb 10;14:1019123. doi: 10.3389/fphys.2023.1019123. eCollection 2023. Front Physiol. 2023. PMID: 36846327 Free PMC article.
Cited by
-
Exploring Factors Underlying Poorly-Controlled Asthma in Adults by Integrating Phenotypes and Genotypes Associated with Obesity and Asthma: A Case-Control Study.J Asthma Allergy. 2023 Jan 21;16:135-147. doi: 10.2147/JAA.S397067. eCollection 2023. J Asthma Allergy. 2023. PMID: 36714050 Free PMC article.
-
Impact of obesity on airway remodeling in asthma: pathophysiological insights and clinical implications.Front Allergy. 2024 Mar 18;5:1365801. doi: 10.3389/falgy.2024.1365801. eCollection 2024. Front Allergy. 2024. PMID: 38562155 Free PMC article. Review.
-
Exploring the association between asthma and chronic comorbidities: impact on clinical outcomes.Front Med (Lausanne). 2024 Jan 26;11:1305638. doi: 10.3389/fmed.2024.1305638. eCollection 2024. Front Med (Lausanne). 2024. PMID: 38343638 Free PMC article. Review.
-
Prevalence of Overweight and Obesity and Their Impact on Spirometry Parameters in Patients with Asthma: A Multicentre, Retrospective Study.J Clin Med. 2023 Feb 25;12(5):1843. doi: 10.3390/jcm12051843. J Clin Med. 2023. PMID: 36902630 Free PMC article.
-
Obesity affects pulmonary function in Japanese adult patients with asthma, but not those without asthma.Sci Rep. 2022 Sep 30;12(1):16457. doi: 10.1038/s41598-022-20924-y. Sci Rep. 2022. PMID: 36180514 Free PMC article.
References
-
- World Health Organization (WHO). Asthma; 2020. Available from: https://www.who.int/news-room/fact-sheets/detail/asthma. Accessed September20, 2020.
-
- Taiwan Society of Pulmonary and Critical Care Medicine (TSPCCM), Cochrane Taiwan, Taiwan Health Promotion Administration (THPA). Asthma guideline; 2018. [Updated January25, 2019]. Available from: https://www.tspccm.org.tw/media/5648. Accessed September20, 2020.
-
- Global Initiative for Asthma (GINA). Global strategy for asthma management and prevention; 2020. Available from: https://ginasthma.org/wp-content/uploads/2020/06/GINA-2020-report_20_06_.... Accessed September20, 2020.
-
- Taiwan Health Promotion Administration (THPA). Taiwan’s obesity prevention and management strategy; 2018. Available from: https://www.hpa.gov.tw/File/Attach/10299/File_11744.pdf. Accessed September20, 2020.
Grants and funding
LinkOut - more resources
Full Text Sources
Other Literature Sources
