Neurodegenerative VPS41 variants inhibit HOPS function and mTORC1-dependent TFEB/TFE3 regulation
- PMID: 33851776
- PMCID: PMC8103106
- DOI: 10.15252/emmm.202013258
Neurodegenerative VPS41 variants inhibit HOPS function and mTORC1-dependent TFEB/TFE3 regulation
Abstract
Vacuolar protein sorting 41 (VPS41) is as part of the Homotypic fusion and Protein Sorting (HOPS) complex required for lysosomal fusion events and, independent of HOPS, for regulated secretion. Here, we report three patients with compound heterozygous mutations in VPS41 (VPS41S285P and VPS41R662* ; VPS41c.1423-2A>G and VPS41R662* ) displaying neurodegeneration with ataxia and dystonia. Cellular consequences were investigated in patient fibroblasts and VPS41-depleted HeLa cells. All mutants prevented formation of a functional HOPS complex, causing delayed lysosomal delivery of endocytic and autophagic cargo. By contrast, VPS41S285P enabled regulated secretion. Strikingly, loss of VPS41 function caused a cytosolic redistribution of mTORC1, continuous nuclear localization of Transcription Factor E3 (TFE3), enhanced levels of LC3II, and a reduced autophagic response to nutrient starvation. Phosphorylation of mTORC1 substrates S6K1 and 4EBP1 was not affected. In a C. elegans model of Parkinson's disease, co-expression of VPS41S285P /VPS41R662* abolished the neuroprotective function of VPS41 against α-synuclein aggregates. We conclude that the VPS41 variants specifically abrogate HOPS function, which interferes with the TFEB/TFE3 axis of mTORC1 signaling, and cause a neurodegenerative disease.
Keywords: Autophagy; HOPS complex; TFEB/TFE3; lysosome-associated disorder; mTORC1.
© 2021 The Authors. Published under the terms of the CC BY 4.0 license.
Conflict of interest statement
The authors declare that they have no conflict of interest.
Figures
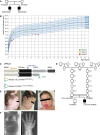
Pedigrees of family 1 affected by recessive mutations in VPS41. Circle = female, square = male, black‐filled shape = individual phenotypically affected.
Head circumference of patients 1 (green), 2 (yellow), and 3 (red) in cm.
Outline of the VPS41 protein depicting distinct domains. The WD40 domain facilitates protein–protein interactions and the CHCR and RING domains enable homo‐oligomerization and are required for HOPS complex formation and regulated secretion. Mutations in VPS41 were identified using whole exome sequencing. The two siblings (patients 1 and 2) bear compound heterozygous mutations; a missense mutation VPS41S285P in the WD40 domain and a nonsense mutation VPS41R662 * at the C‐terminus resulting in a premature stop codon. Patient 3 bears a canonical splicing variant expected to destroy an acceptor site (VPS41c . 1423‐2A>G) in the TPR‐like domain and shares the nonsense mutation (VPS41R662 *) at the C terminus with the other patients.
Pedigree of family 2 affected by recessive mutations in VPS41. Circle = female, square = male, black‐filled shape = individual phenotypically affected, double line = consanguinity.
Patient 3 developed coarse facial features with heavy eyebrows, gingival hypertrophy, protruding tongue, thick lips, and thick ear lobes (I; age 1 year, 7 months, II and III; age 4 years, 10 months).
A spinal X‐ray showed a kyphosis at C3 and hypoplastic distal phalanges on digits 2, 3, and 5 and a short metacarpal 1, bilaterally (IV; age 5 years, V; age 11 years).
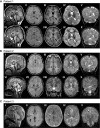
Patient 1 (older sibling) underwent 3 MRI studies, first and last are shown. Top row: 21 months; Bottom row: 4 years 7 months. The corpus callosum is thin on T1‐weighted sagittal images (I, V, VI) with a saber shape (long arrows). The shape remains consistent over time. The vermis is normal in configuration and size initially (I), but demonstrates volume loss on follow‐up (V, VI) examination (short arrows). FLAIR axial image (II) is age appropriate, while (VII) demonstrates periatrial increased signal (arrow). There is delay in myelin maturation present on T1 (III, VIII)‐ and T2 (IV, IX)‐weighted axial images (long arrows) on initial examination, with further slow myelin development over time. There is deficiency of periatrial white matter volume on both T1 (III, VIII)‐ and T2 (IV, IX)‐weighted axial images (short arrows). Coronal T2 image (V) demonstrates abnormally increased signal of the dentate nuclei (arrow), unchanged on follow‐up image (X). Superior vermian atrophy (short arrows) over time.
Patient 2 (younger sibling). Top row: 4 years, 11 months; Bottom row: 9 years, 6 months. The corpus callosum is thin with a saber‐shape (long arrows) configuration on T1‐weighted sagittal (I) and T2‐weighted sagittal (V, VI). The shape remains consistent over time, although the volume decreases slightly. The vermis demonstrates volume loss on both sagittal examinations (short arrows). There is iron deposition in the basal ganglia on FLAIR (VII) and T2‐weighted coronal (VIII) and axial (IX) images at 9 years 8 months of age (arrow). This was not present on earlier imaging. Iron deposition was also present in the subthalamic nuclei (not shown). Myelin maturation is age appropriate on the initial T1‐weighted axial image (III) and minimally delayed on T2‐weighted image (IV) at 4 years 11 months of age (short arrow). Myelin is age appropriate (short arrow) on follow‐up T2‐weighted images (VIII, IX). The dentate nuclei (short arrows) are bright on T2 coronal images (V, VI, X) at both ages. There is progressive cerebellar hemisphere volume loss.
Patient 3, 3 weeks old. Sagittal T1‐weighted image (I) demonstrates a very thin severely hypoplastic remnant of corpus callosum (short arrow), a short cingulate sulcus (long arrow), and slender pons. FLAIR image (II) reveals faintly increased signal (short arrow) in the posterior limb of internal capsule (PLIC). There is lack of myelin maturation in the PLIC (short arrows) on T1‐IR (III)‐ and T2 (IV)‐weighted axial images. Focal widening of the interhemispheric CSF space (arrow) on T2‐weighted image (IV) reflects the absence of rostral fiber tracts. Cingulate gyrus is present (long arrow). No traversing callosal fibers are shown at this level (I).

- A, B
Electron micrographs of Epon sections of VPS41WT/WT fibroblasts.
- C, D
Electron micrographs of Epon sections of VPS41S285P/R662 * fibroblasts.
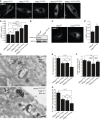
Immunofluorescence microscopy of control, parental, and patient fibroblasts labeled for LAMP‐1. Patient fibroblasts (VPS41S285P/R662 * and VPS41c . 1423‐2A>G/R662 *) show more LAMP‐1 puncta, which are distributed throughout the cell. (A’) Quantification shows a significant increase in the number of LAMP‐1‐positive compartments for both patients. > 15 Cells per condition were quantified (n = 3). Scale bars, 10 µm.
HeLa VPS41 knockout (HeLaVPS41KO) cells made using CRISPR/Cas9 methodology. Western blot analysis confirms a full knockout. The same HeLaWT and HeLaVPS41KO samples were analyzed in Appendix Fig S8C, showing the same actin control.
LAMP‐1 immunofluorescence of HeLaWT and HeLaVPS41KO cells. Similar to patient‐derived fibroblasts, more LAMP‐1‐positive compartments are seen in HeLaVPS41KO cells (quantified in C’). > 10 Cells per cell line per experiment were quantified (n = 3). Scale bars, 10 µm.
Immuno‐electron microscopy of VPS41WT/WT and VPS41S285P/R662 * fibroblasts incubated for 2 h with BSA conjugated to 5 nm gold (BSA‐Au5) and labeled for LAMP‐1 (10 nm gold particles). Lysosomes are recognized by the presence of degraded, electron‐dense material. LE = late endosome, LY = lysosome, PM = plasma membrane. Scale bar, 200 nm.
Morphometrical analysis showing that lysosomes in patient fibroblasts are significantly smaller than in control and parental cells. > 100 Randomly selected lysosomes per condition were quantified.
Relative labeling density of LAMP‐1. Number of LAMP‐1 gold particles per lysosome was divided by the number of grid intersections, representing lysosomal size. No significant difference was found between VPS41WT/WT, VPS41WT/S285P, VPS41WT/R662 * or VPS41S285P/R662 * fibroblasts. > 53 Lysosomes per condition were quantified.
Quantitation of LAMP‐1 gold particles per lysosome. VPS41S285P/R662 * lysosomes have significantly less LAMP‐1 then control and parental cells. > 53 Lysosomes per condition were quantified. Similar results were obtained for LAMP‐2 (Appendix Fig S2).
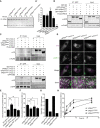
Western blot of primary fibroblasts derived from patient 2 (VPS41S285P/R662 *), his mother (VPS41WT/R662 *), father (VPS41WT/S285P), patient 3 (VPS41 c.1423‐2A>G /R662 *) and an unrelated, healthy control (VPS41WT/WT) (Western blot of longer exposure time shown in Appendix Fig S3A). Full‐length VPS41 (FL VPS41), representing VPS41WT and VPS41S285P, is observed in all cells. Truncated VPS41R662* in patients and maternal fibroblasts is not detectable. VPS41R662* is also not visible in fibroblasts treated with 50 µM MG132 (4 h) to inhibit proteasomal degradation, indicating that the mRNA encoding for this mutant is degraded. (A’) Quantification of VPS41 protein levels show a reduction in both patients compared with VPS41WT/WT, with only 10% remaining VPS41 levels in VPS41 c.1423‐2A>G /R662 * (n = 2).
Immunoprecipitation (IP) on HeLa cells co‐expressing GFP‐empty vector (EV), GFP‐VPS41WT, GFP‐VPS41S285P, or GFP‐VPS41R662* and FLAG‐VPS18. GFP‐VPS41WT and GFP‐VPS41S285P both interact with FLAG‐VPS18 and as shown in Appendix Fig S4A with HA‐VPS33A. Interaction between GFP‐VPS41R662* and FLAG‐VPS18 is strongly reduced. Note that the stop codon in VPS41R662 * leads to a truncated protein of lower molecular weight (n = 3).
IP on Hela cells co‐expressing VPS41WT‐APEX2‐V5, VPS41S285P‐APEX2‐V5, or VPS41R662*‐APEX2‐V5 and FLAG‐RAB7 or GFP‐Arl8b. The IP was performed on FLAG or GFP, respectively. All VPS41 variants interact with Rab7 and Arl8b (n = 3).
HeLaVPS41KO cells transfected with VPS41WT‐APEX2‐V5, VPS41S285P‐APEX2‐V5, or VPS41R662*‐APEX2‐V5 constructs labeled for LAMP‐1 and V5 immunofluorescence microscopy. All VPS41 variants colocalize with LAMP‐1, indicating that VPS41S285P and VPS41R662* are recruited to late endosomes/lysosomes. Scale bars 10 µm; zoom of squared area, 1 µm.
Quantification of endocytosis‐rescue experiments in HeLa cells. HeLaVPS41KO cells transfected with VPS41WT‐APEX2‐V5 show a significant increase in colocalization of endocytosed Dextran‐568 and SiR‐Lysosome cathepsin D (SiR‐Lyso), indicating rescue of the endocytosis phenotype. Neither VPS41 variant rescues this HOPS complex functionality. >13 Cells per cell line per experiment were quantified (n = 3).
Quantification of lysosomal delivery of endocytosed cargo in fibroblasts, based on fluorescent data. VPS41WT/WT, VPS41WT/S285P, VPS41WT/R662 *, and VPS41S285P/R662 * primary fibroblasts were incubated with Dextran‐568 and SiR‐Lysosome cathepsin D (SiR‐Lyso) for 2 and 3 h, respectively. Colocalization representing delivery of Dextran to enzymatically active lysosomes is reduced in VPS41WT/R662 * and VPS41S285P/R662 * cells. >11 Cells per cell line per experiment were quantified (n = 3).
Quantification of lysosomal delivery of endocytosed cargo in fibroblasts, based on EM data. VPS41WT/WT, VPS41WT/S285P, VPS41WT/R662 *, and VPS41S285P/R662 * fibroblasts were incubated with BSA‐Au5 for 2 h and labeled for LAMP‐1 (10 nm gold particles) immuno‐EM (Fig 2D). LAMP‐1‐positive lysosomes were scored for presence of BSA‐Au5, and the ratio between BSA+ and BSA‐ lysosomes was calculated. > 46 Lysosomes per condition were quantified. Both VPS41WT/R662 * and VPS41S285P/R662 * show a strong decrease in BSA‐positive lysosomes indicating a fusion defect between late endosomes and lysosomes.
VPS41WT/WT, VPS41WT/R662 *, and VPS41S285P/R662 * primary fibroblasts incubated with Dextran‐568 for 0.5, 2, 5, 8, and 24 h. Colocalization of Dextran‐568 and SiR‐Lysosome cathepsin D (SiR‐Lyso) reveals a delay in lysosomal delivery in maternal (VPS41WT/R662 *) and patient (VPS41S285P/R662 *) cells at 2 h of Dextran uptake. After 5 h, maternal cells show similar to control colocalization levels. Patient cells show only after 24 h colocalization levels similar to control, indicating a delay rather than a block in late endosome–lysosome fusion. > 10 Cells per cell line were quantified.
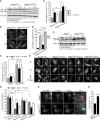
Western blot of LC3 expression levels in control and patient fibroblasts. In steady state conditions (0 h), patient fibroblasts have a higher ratio of lipidated LC3 (LC3II):LC3I than control cells. Induction of autophagy by nutrient starvation (2 h incubation with minimal EBSS medium) results in a raise in LC3II:LC3I ratio in both control and patient cells, but in VPS41S285P/R662 * fibroblasts this increase is only modest (quantified in A’) (n = 2).
Immunofluorescence of LC3 inVPS41WT/WT and VPS41S285P/R662 * fibroblasts under steady state and starved conditions. At steady state conditions (0 h), patient fibroblasts contain more LC3‐positive compartments. Nutrient starvation (2 h) increases the number of LC3‐positive autophagosomes in control fibroblasts 13.4‐fold, and in VPS41S285P/R662 * fibroblasts only 3.8‐fold, indicating a reduced responsiveness to starvation (quantified in B’). > 54 Cells per cell line were quantified. Scale bars, 10 µm.
Western blot analysis of HeLaVPS41KO cells shows a fourfold increase in LC3II protein levels in steady state conditions (0 h) compared with HeLaWT cells. In contrast to control cells, nutrient starvation (2 h) did not increase LC3II protein levels in HeLaVPS41KO cells, indicating irresponsiveness to nutrient availability (quantified in C’) (n = 3).
Rescue experiments. HeLaVPS41KO cells transfected with EV‐APEX2‐V5, VPS41WT‐APEX2‐V5, VPS41S285P‐APEX2‐V5, or VPS41R662*‐APEX2‐V5 and labeled for V5 and LC3 by immunofluorescence microscopy. Rescue with VPS41WT‐APEX2‐V5 decreases the number of LC3‐positive compartments in steady state conditions (0 h) and restores responsiveness to nutrient starvation (2 h) and replenishment (2‐hour starvation followed by 15 min restimulation). Neither of the mutant VPS41 variants rescues this autophagy phenotype (quantified in D’). >15 Cells per condition were quantified (n = 3). Scale bars, 10 µm.
Immunofluorescence of HeLaWT and HeLaVPS41KO cells transfected with LC3GFP/RFP tandem construct. The increased percentage of GFP/RFP‐positive compartments in HeLaVPS41KO cells indicates a block in autophagic flux (quantified in E’). > 12 Cells per cell line were quantified. Scale bars 10 µm; zoom, 1 µm.

Western blot of LC3 protein levels in HeLaWT and HeLaVPS41KO cells with and without Bafilomycin A1 (BafA1) treatment. Cells depleted of VPS41 show increased LC3II protein levels compared with WT cells. BafA1 treatment increases LC3II protein levels in HeLaWT cells, whereas HeLaVPS41KO cells are relatively insensitive (n = 2).
Quantification of LC3II:LC3I levels. Per cell line and per condition the increase in LC3II:LC3I after BafA1 treatment are plotted against non‐treated cells. In contrast to HeLaWT cells, the HeLaVPS41KO cells show only a minor increase (n = 2).
Quantification of LC3II:LC3I levels in HeLaWT BafA1 treated compared with non‐treated HeLaVPS41KO cells in steady state (0 h), starved (2 h) and refeeding (2‐h starvation followed by 15‐min restimulation) conditions. Similar LC3II ratios are observed after starvation and BafA1 treatment of HeLaWT cells, indicating that the elevated LC3 levels in HeLaVPS41KO cells are caused by increased autophagic induction and decreased autophagic flux (n = 2).
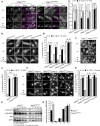
Immunofluorescence of control, parental, and patient fibroblasts labeled for LAMP‐1 and mTOR. In steady state conditions (0 h), VPS41S285P/R662 * fibroblasts show less colocalization between mTOR and LAMP‐1. VPS41WT/WT, VPS41WT/S285P, and VPS41WT/R662 * show an appropriate mTOR response upon nutrient deprivation (2 h) or restimulation (2‐h starvation followed by 15‐min restimulation) (Appendix Fig S5A). > 10 Cells per cell line were quantified (A’). Quantifications are performed relative to colocalization under steady state conditions per cell line (n = 3). Scale bars, 10 µm; zoom, 1 µm.
Immunofluorescence of VPS41WT/WT, VPS41WT/S285P, VPS41WT/R662 *, and VPS41S285P/R662 * fibroblasts labeled for TFE3. In VPS41S285P/R662 * fibroblasts, TFE3 is constitutively localized in the nucleus regardless of nutrient state (quantified in B’). > 25 Cells per condition were quantified (n = 3). Scale bars, 10 µm.
TFE3 immunofluorescence in HeLaWT and HeLaVPS41KO cells. In HeLaVPS41KO cells, TFE3 constitutively localizes in the nucleus (quantified in C’). > 83 Cells per condition were quantified (n = 3). Scale bars, 10 µm.
Rescue experiments of HeLaVPS41KO cells. Expression of VPS41WT‐APEX2‐V5, VPS41S285P‐APEX2‐V5, or VPS41R662*‐APEX2‐V5. Reintroduction of VPS41WT rescues TFE3 localization, whereas expression of mutant VPS41 has no effect (quantified in D’). > 83 Cells per condition were quantified (n = 3). Scale bars, 10 µm.
Western blot of phosphorylated mTORC1 substrates S6K and 4EBP1 after starvation (2 h) and restimulation (10, 30 or 60 min). HeLaVPS41KO cells show comparable levels of phospho‐S6K and phospho‐4EBP1, with no difference in recovery after restimulation (quantified in E’) (n = 3).
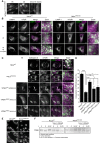
VPS41c . 1423‐2A>G/R662 * fibroblasts show constitutive nuclear localization of TFE3. Scale bars, 10 µm.
HeLaWT and HeLaVPS41KO cells labeled for LAMP‐1 and mTOR immunofluorescence. In HeLaVPS41KO cells, mTOR is dissociated from LAMP‐1‐positive compartments regardless of nutrient state. In HeLaWT cells, mTOR colocalizes with LAMP‐1 in steady state (0 h) and after nutrient restimulation (2‐h starvation followed by 15‐min restimulation). Scale bars, 10 µm; zoom 1 µm.
Rescue experiment of mTOR localization on cathepsin D‐positive lysosomes in HeLaVPS41KO cells transfected with VPS41WT‐APEX2‐V5, VPS41S285P‐APEX2‐V5, or VPS41R662*‐APEX2‐V5. Cells were starved for 2 h and restimulated with full medium for 15 min. Scale bars, 10 µm; zoom, 1 µm.
Quantification of mTOR colocalization with cathepsin D in rescued VPS41KO cells. Reintroducing VPS41WT results in increased colocalization of mTOR with lysosomes. > 15 cells per condition were quantified in this assay (n = 2).
Immunofluorescence of 300 nm thick cryosections of PC12WT and PC12VPS41KO cells labeled for TFE3. PC12VPS41KO cells show constitutive nuclear localization of TFE3. Scale bar, 10 µm.
Western blots of TFEB. In HeLaWT cells, molecular weight shifts are indicative for (de)phosphorylation events dependent on nutrient availability. mTORC1 inhibitor Torin‐1 impairs TFEB phosphorylation and no shift in molecular weight is seen. In VPS41KO cells, no molecular weight shift of TFEB is seen either, indicating impaired phosphorylation of TFEB.
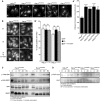
Immunofluorescence microscopy of HeLaWT, HeLaVPS11KO, HeLaVPS18KO, HeLaVPS39KO, and HeLaVPS41KO cells labeled for cathepsin D. All KO cells lines show more cathepsin D‐positive compartments (quantified in A’). > 56 Cells per cell line were quantified (n = 3). Scale bars, 10 µm.
Immunofluorescence microscopy of HeLaVPS11KO and HeLaVPS18KO cells labeled for TFE3 at steady state (0 h), starved (2 h), or restimulated (2‐h starvation followed by 15‐min restimulation) conditions. In both HeLaVPS11KO and HeLaVPS18KO cells, TFE3 is present in the nucleus regardless of nutrient availability, indicating that mTORC1‐dependent regulation of TFE3 is impaired in cells depleted of HOPS subunits (quantified in B’) (n = 3). Scale bars, 10 µm.
Western blot of phosphorylated mTORC1 substrates S6K1 and 4EBP1 after starvation (2 h) and restimulation with full medium for 10, 30, or 60 min in HeLaVPS18KO and HeLaVPS39KO cells. After 30‐min restimulation, both substrates are phosphorylated in both cell lines. These data show that phosphorylation of S6K1 and 4EBP1 is independent of the HOPS complex.
Western blot showing ULK1, a substrate of mTORC1 involved in autophagy initiation, and phosphorylated upon nutrient availability. HeLaWT, HeLaVPS18KO, HeLaVPS39KO, and HeLaVPS41KO cell lines show an appropriate response in (de)phosphorylation of ULK1 upon starvation (2 h) and restimulation (2‐h starvation followed by 30‐min restimulation).

- A
Western blot of pulldown of AP‐3 incubated with HIS‐6 VPS41WT or VPS41S285P. There is no difference in affinity between VPS41WT and VPS41S285P (See Appendix Fig S10 for MBP‐AP‐3 pulldown input).
- B
Western blot on cellular or secreted secretogranin II (SgII) of PC12 cells VPS41KO, or VPS41KO transduced with HA‐VPS41WT or HA‐VPS41S285P lentivirus. Cells were washed and incubated for 30 min in Tyrode’s solution containing 2.5 mM K+ (basal) or 90 mM K+ (stimulated). No difference in secreted SgII levels was observed between VPS41WT and VPS41S285P.
- C, D
Cellular (C) and secreted (D) secretogranin II (SgII) were measured by quantitative fluorescence immunoblotting (n = 3). VPS41S285P rescues intracellular SgII levels and regulated secretion of SgII to the same extent as VPS41WT.
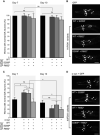
Graph representing the percentage of adult C. elegans animals with 6 normal dopaminergic neurons. Heterozygous expression with hVPS41WT (strains UA386 or UA387) or compound heterozygous expression of hVPS41 variants (strain UA388) does not yield significant changes in neurodegeneration compared with the Pdat‐1::GFP (strain BY250) control at either day 7 or day 10 post‐hatching. n = 30 Adult worms for each of 3 independent experiments for GFP (total of 90 worms) and n = 90 for each independent transgenic strain (30 worms/trial × 3 independent transgenic lines = 270 worms), for each of 3 independent experiments.
Representative images of the neuroprotection assay described in (A), where worms express GFP specifically in the anterior 6 DA neurons. Intact DA neurons are indicated with arrowheads. hVPS41 variant backgrounds are expressed as indicated. Scale bar 20 µm.
Graph representing the percentage of animals with 6 normal dopaminergic neurons in the anterior region of Pdat‐1::GFP; Pdat‐1:: α‐syn (strain UA44) animals with heterozygous expression of hVPS41 variants. Heterozygous expression of hVPS41WT with either variant (strains UA389 or UA390) significantly rescues neurons from α‐synuclein‐induced degeneration at day 7 whereas compound heterozygous expression (strain UA391) fails to rescue neurodegeneration. At day 10, none of the heterozygous backgrounds significantly rescues α‐synuclein‐induced neurodegeneration. n = 30 Adult worms for each of 3 independent experiments for the α‐synuclein (α‐syn) strain (total of 90 worms) and n = 90 for each independent transgenic strain (30 worms/trial × 3 independent transgenic lines = 270 worms) for each of 3 independent experiments.
Representative images of DA neurons from C. elegans expressing Pdat‐1::GFP; Pdat‐1:: α‐syn, with or without hVPS41 variants, as described in (C). Intact DA neurons are indicated with arrowheads and missing neurons are indicated with arrows. Scale bar 20 µm.
Similar articles
-
AMPK-dependent phosphorylation is required for transcriptional activation of TFEB and TFE3.Autophagy. 2021 Dec;17(12):3957-3975. doi: 10.1080/15548627.2021.1898748. Epub 2021 Mar 18. Autophagy. 2021. PMID: 33734022 Free PMC article.
-
AKT inhibition-mediated dephosphorylation of TFE3 promotes overactive autophagy independent of MTORC1 in cadmium-exposed bone mesenchymal stem cells.Autophagy. 2019 Apr;15(4):565-582. doi: 10.1080/15548627.2018.1531198. Epub 2018 Oct 20. Autophagy. 2019. PMID: 30324847 Free PMC article.
-
Phosphorylation of EIF2S1 (eukaryotic translation initiation factor 2 subunit alpha) is indispensable for nuclear translocation of TFEB and TFE3 during ER stress.Autophagy. 2023 Jul;19(7):2111-2142. doi: 10.1080/15548627.2023.2173900. Epub 2023 Feb 9. Autophagy. 2023. PMID: 36719671 Free PMC article.
-
HOPS-associated neurological disorders (HOPSANDs): linking endolysosomal dysfunction to the pathogenesis of dystonia.Brain. 2021 Oct 22;144(9):2610-2615. doi: 10.1093/brain/awab161. Brain. 2021. PMID: 33871597 Review.
-
Past, present, and future perspectives of transcription factor EB (TFEB): mechanisms of regulation and association with disease.Cell Death Differ. 2022 Aug;29(8):1433-1449. doi: 10.1038/s41418-022-01028-6. Epub 2022 Jun 23. Cell Death Differ. 2022. PMID: 35739255 Free PMC article. Review.
Cited by
-
Structure of the HOPS tethering complex, a lysosomal membrane fusion machinery.Elife. 2022 Sep 13;11:e80901. doi: 10.7554/eLife.80901. Elife. 2022. PMID: 36098503 Free PMC article.
-
Patient-specific variants of NFU1/NFU-1 disrupt cholinergic signaling in a model of multiple mitochondrial dysfunctions syndrome 1.Dis Model Mech. 2023 Feb 1;16(2):dmm049594. doi: 10.1242/dmm.049594. Epub 2023 Feb 1. Dis Model Mech. 2023. PMID: 36645076 Free PMC article.
-
Juvenile mucopolysaccharidosis plus disease caused by a missense mutation in VPS33A.Hum Mutat. 2022 Dec;43(12):2265-2278. doi: 10.1002/humu.24479. Epub 2022 Oct 8. Hum Mutat. 2022. PMID: 36153662 Free PMC article.
-
From bugs to bedside: functional annotation of human genetic variation for neurological disorders using invertebrate models.Hum Mol Genet. 2022 Oct 20;31(R1):R37-R46. doi: 10.1093/hmg/ddac203. Hum Mol Genet. 2022. PMID: 35994032 Free PMC article.
-
Consecutive functions of small GTPases guide HOPS-mediated tethering of late endosomes and lysosomes.Cell Rep. 2023 Jan 31;42(1):111969. doi: 10.1016/j.celrep.2022.111969. Epub 2023 Jan 4. Cell Rep. 2023. PMID: 36640308 Free PMC article.
References
-
- Aoyama M, Sun‐Wada GH, Yamamoto A, Yamamoto M, Hamada H, Wada Y (2012) Spatial restriction of bone morphogenetic protein signaling in mouse gastrula through the mVam2‐dependent endocytic pathway. Dev Cell 22, 1163–1175. - PubMed
Publication types
MeSH terms
Substances
Grants and funding
LinkOut - more resources
Full Text Sources
Other Literature Sources
Medical
Molecular Biology Databases
Research Materials

