. 2021 Apr 13;12(1):2217.
doi: 10.1038/s41467-021-22448-x.

A compendium and comparative epigenomics analysis of cis-regulatory elements in the pig genome

Affiliations

A compendium and comparative epigenomics analysis of cis-regulatory elements in the pig genome

Yunxia Zhao et al. Nat Commun. .

Abstract

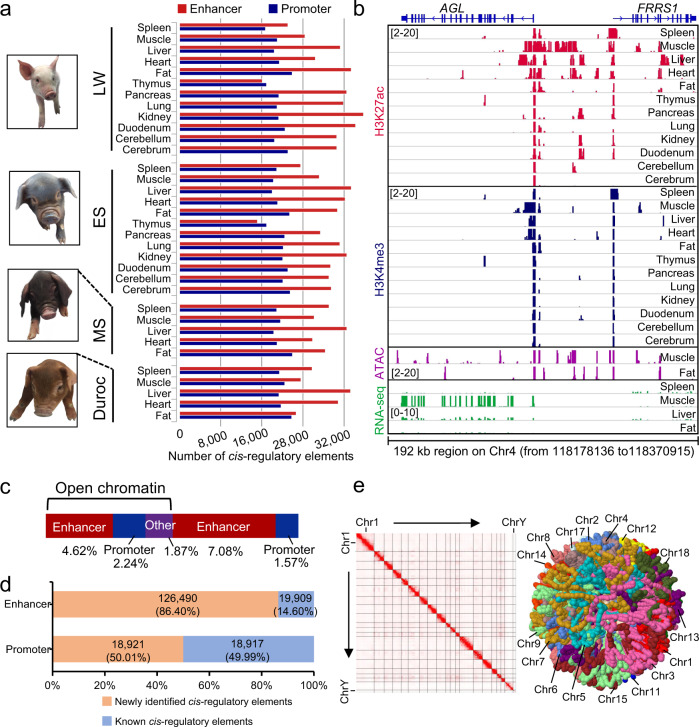
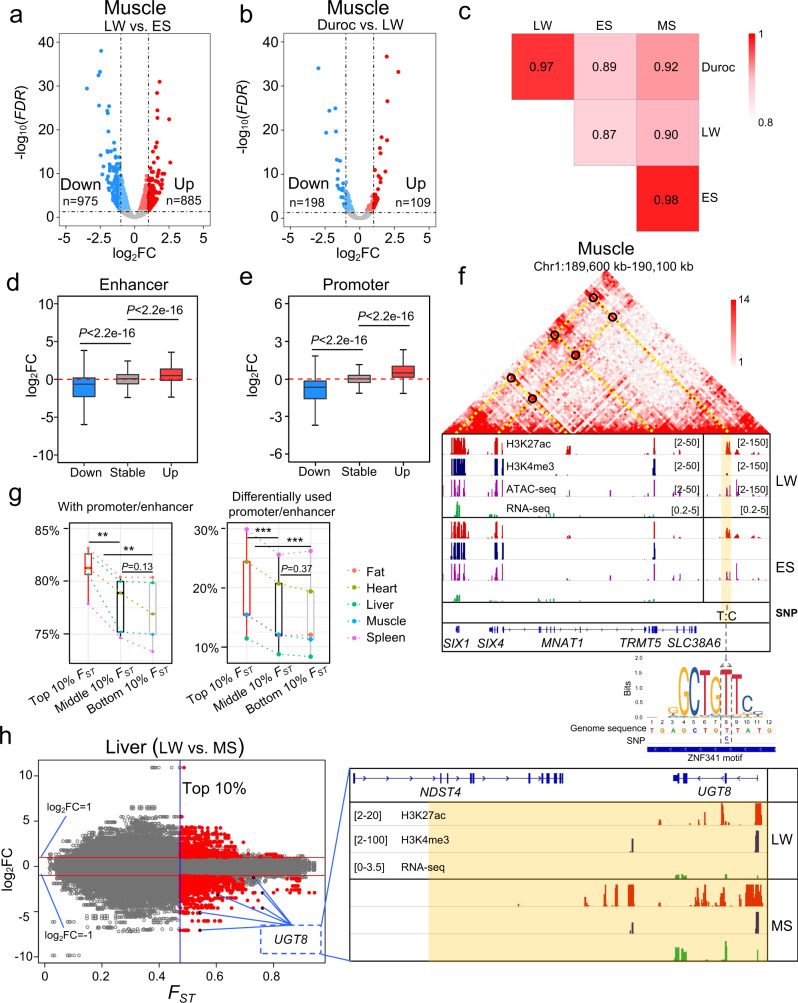
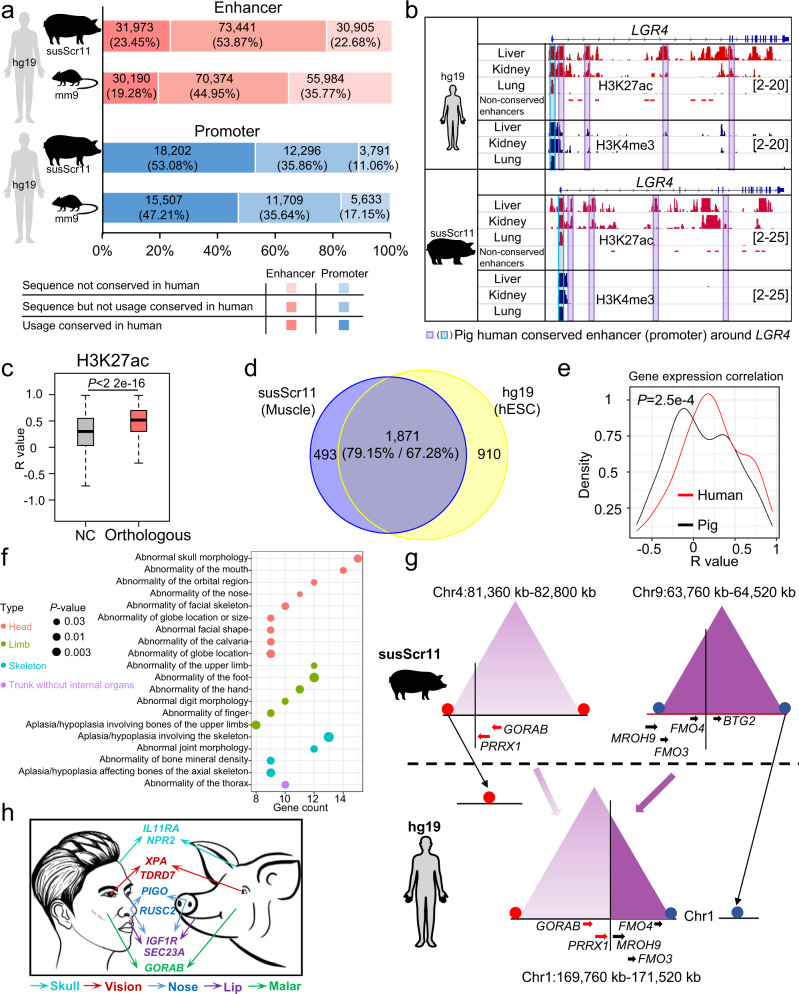
Although major advances in genomics have initiated an exciting new era of research, a lack of information regarding cis-regulatory elements has limited the genetic improvement or manipulation of pigs as a meat source and biomedical model. Here, we systematically characterize cis-regulatory elements and their functions in 12 diverse tissues from four pig breeds by adopting similar strategies as the ENCODE and Roadmap Epigenomics projects, which include RNA-seq, ATAC-seq, and ChIP-seq. In total, we generate 199 datasets and identify more than 220,000 cis-regulatory elements in the pig genome. Surprisingly, we find higher conservation of cis-regulatory elements between human and pig genomes than those between human and mouse genomes. Furthermore, the differences of topologically associating domains between the pig and human genomes are associated with morphological evolution of the head and face. Beyond generating a major new benchmark resource for pig epigenetics, our study provides basic comparative epigenetic data relevant to using pigs as models in human biomedical research.


Conflict of interest statement

The authors declare no competing interests.

Figures

Fig. 1
Fig. 1. Cis-regulatory element landscape of the pig genome.
LW, ES, and MS represent Large White, Enshi Black, and Meishan breeds, respectively. a Summary of cis-regulatory elements (enhancers and promoters) identified in various tissues of four pig breeds. b Genome browser views of ChIP-seq, ATAC-seq, and RNA-seq data at the AGL and FRRS1 loci in tissues of LW pig. The numbers in the brackets located in the respective ChIP-seq, ATAC-seq, and RNA-seq tracks indicate their signal intensities. c A bar plot showing the percentage of cis-regulatory elements annotated in the pig genome. The percentage of enhancers (or promoters) in the black bracket were in genomic regions of open chromatin. “Other” indicates the proportion of open chromatin regions that did not overlap with enhancers or promoters. d Percentages of cis-regulatory elements newly identified in this study (salmon) and recovered by UCSC TSSs or published data (blue) from pig pluripotent stem cells and liver tissue. e Overview of Hi-C heatmap matrix (left) and a simulated structure of 3D chromatin (right) in pig skeletal muscle. A Lorentzian objective method and GenomeFlow v2.0 were used for modeling.
Fig. 2
Fig. 2. Transcriptional profiling and cis-regulatory elements analysis.
a Heatmap showing gene expression patterns in 11 tissues of two-week-old Large White (LW) pigs. b Examples of genes exhibiting tissue-specific expression. c RT-PCR validation in 11 tissues of tissue-specific expression of the genes in b. The validation was repeated twice independently with similar results and RPL32 was used as a control. The PCR target fragment size of RPL32 is 93 bp, MYOG specifically expressed in muscle is 612 bp, ANGPTL3 specifically expressed in the liver is 420 bp, UMOD specifically expressed in the kidney is 470 bp, and RBP2 specifically expressed in the duodenum is 395 bp. The original gel pictures of RT-PCR, including this figure and its repeated experiment, were provided as a source data file. d Examples of lncRNAs identified in this study expressed in specific tissues. H3K4me3 signals were enriched around their TSSs. e The distribution of H3K4me3 signals around TSSs of UCSC reference genes and newly identified transcripts. f Classification of enhancers based on their chromatin states (H3K27ac) among different tissues of LW pigs. g Statistical comparisons and representative expression profiles of genes associated with super-enhancers (top) or associated with broad H3K4me3 peaks (bottom). SE and TE indicate super- and typical enhancers, respectively. Blue shading (top) indicates SE regions; orange shading (bottom) indicates broad H3K4me3 regions (right panels). The bounds of boxplots represent the 25th percentile, median, and 75th percentile. The minima and maxima values of boxplots were defined by excluding outliners. P-values were calculated using a two-sided unpaired Wilcoxon test. **** indicates P < 2.2e−16 (n = 19,451 genes for super-enhancers, n = 178,670 genes for typical enhancers, n = 51,666 genes for H3K4me3 regions, and n = 51,666 genes for random regions). h Validation of the enhancers identified in this study using a Dual-Luciferase Reporter Assay System in pig 3D4/21 cells. Data shown are means ± SD (n = 4). * indicates P < 0.05, ** indicates P < 0.01 (3.3e−25 < P < 0.021), which was calculated with a two-sided Student’s t-test without multiple comparisons. i Tissue-specific enhancers from pig heart tissue carrying the conserved VISTA-validated element hs2185. The numbers in brackets in ChIP-seq and RNA-seq tracks indicate signal intensity.
Fig. 3
Fig. 3. 3D structure and regulation of cis-regulatory elements.
a ATAC-seq, ChIP-seq, and RNA-seq enrichment and correlation map of a Hi-C matrix for chromosome 7 at 500 kb resolution (res) in LW muscle. b Signal intensities in the enrichment of histone modifications (H3K27ac and H3K4me3), open chromatin, and gene expression in the active “A” compartment (H3K4me3 n = 1167; H3K27ac n = 1168; ATAC-seq n = 1167; Gene n = 1004) and the inactive “B” compartment (H3K4me3 n = 1192; H3K27ac n = 1192; ATAC-seq n = 1191; Gene n = 832). A two-sided unpaired Wilcoxon test was used to calculate P-values. c TAD structure on chromosome 2 (87,120 kb–91,880 kb). Heatmap for normalized Hi-C interaction frequencies overlaid on RNA-seq data, ChIP-seq data, ATAC-seq data, directionality index (DI), and TAD boundaries. d Distribution of Spearman correlation coefficients between gene expression profiles and H3K27ac intensity for a given enhancer. The red vertical dotted line indicates the estimated cutoffs for significant correlation. The two-side unpaired Wilcoxon test was used to calculate P-value. e Venn diagram showing numbers of total identified Hi-C loops (blue circle), loops associated with enhancers and/or genes (red circle), and loops validated by significantly correlated enhancers and/or genes (yellow circle) at a resolution (res) of 25 kb. f Hi-C interaction heatmap showing consistency between the Hi-C loops and highly correlated cis-regulatory elements on chromosome 12 (52,500 kb–54,000 kb). The shading with the same color across tracks indicates consistency between Hi-C loops and significantly correlated enhancer-enhancer pairs, gene-gene pairs, or enhancer-gene pairs. g Enrichment for CTCF motifs at loop anchors. The motif enrichment was based on open chromatin regions in ATAC-seq data. The P-values were using a two-side cumulative hypergeometric test without adjustments. h, The number of enhancers detected at the indicated distances from GWAS-associated SNPs. The **** indicates P < 2.2e−16 and a two-sided unpaired Wilcoxon test was adopted to calculate P-values. The n = 2577, n = 3059, n = 3283, and n = 3378 SNPs were for extending 10 kb (P = 6.6e−38), 25 kb (P = 6.2e−98), 50 kb (P = 9.8e−127), and 100 kb (P = 1.9e−152) distances respectively. The bounds of boxplots represent the 25th percentile, median, and 75th percentile. The minima and maxima values of boxplots were defined after excluding outliners. i Significantly correlated enhancers and GWAS-associated SNPs around the PLCB4 gene in pig cerebellum and muscle tissues. The orange shading indicates SNP loci and the blue shading shows PLCB4 gene promoter regions. The purple curve lines indicate the enhancers that were significantly correlated with the PLCB4 gene. The numbers in brackets (right side) indicate ChIP-seq, ATAC-seq, and RNA-seq signal intensities.
Fig. 4
Fig. 4. Differentially expressed genes and variable histone intensity of cis-regulatory elements among pig breeds.
a The FDR distribution from a comparison of differential gene expression in muscle tissue of LW compared with ES pigs. b The FDR distribution from a comparison of differential gene expression in muscle tissue between LW and Duroc pigs. The red dots indicate upregulated genes, and blue dots indicate downregulated genes. c Pearson correlation heatmap of H3K27ac intensities at ±500 kb around all differentially expressed genes (FDR < 0.05) in muscle tissue of four pig breeds. d Boxplot of fold change (FC) in H3K27ac intensities of the enhancers (Up n = 2161; Down n = 3762; Stable n = 6079) of differentially expressed genes (FDR < 0.05 and |log2FC| ≥ 1) between different pig breeds in each tissue. e Boxplots showing fold changes in the H3K27ac intensities of active promoters (Up n = 2925; Down n = 5175; Stable n = 11,711) of differentially expressed genes (FDR < 0.05 and |log2FC| ≥ 1) between different pig breeds. f An example of a T/C SNP (Chr1:190035161) with allele frequency difference (ΔAF = 0.63) between LW and ES located in the enhancer correlated with the expression of transcription factors of SIX1 and SIX4. Yellow shading indicates the region harboring the SNP, and black circles indicate Hi-C contact maps. g The different 10% quantile FST regions associated with cis-regulatory elements. ** in the left panel indicate P < 0.01 (P = 0.0042, P = 0.0020) and was calculated by two-sided paired t-test (n = 5). *** in the right panel indicates P < 0.001 (P = 0.00018, P = 0.00037) and was calculated by a two-sided paired t-test (n = 5). h Left: distribution of FST values and log2FC in histone modifications (H3K27ac) of cis-regulatory elements in liver tissue of LW and MS pigs. Right: example of histone modification signal of enhancers and promoters near the differentially expressed UGT8 gene. Yellow shading indicates the top 10% of the FST genome region. P-values in d and e were calculated by the two-side unpaired Wilcoxon test. The bounds of boxplots represent the 25th percentile, median, and 75th percentile. The minima and maxima values of boxplots were defined after excluding outliners. The numbers in brackets located in the tracks of ChIP-seq, ATAC-seq, and RNA-seq indicate signal intensities.
Fig. 5
Fig. 5. Evolutionary conservation of cis-regulatory elements and TADs across mammals.
a Conservation of sequence and usage of cis-regulatory elements in pig and mouse genomes compared with human genomes. b Example of enhancers and promoters with conserved usage between pigs and humans at the LGR4 gene locus. The numbers in brackets located in the H3K4me3 and H3K27ac ChIP-seq tracks indicate signal intensities. c Spearman correlations of H3K27ac intensities around pig-human orthologous gene pairs or non-orthologous genes in various pig and human concordant tissues. “NC” indicates the correlation between non-orthologous gene pairs which were random selected from all combinations of non-orthologous genes. The P-value was calculated using a two-sided unpaired Wilcoxon test (n = 14,085). The bounds of boxplots represent the 25th percentile, median, and 75th percentile. The minima and maxima values of boxplots were defined after excluding outliners. d The TAD boundary conservation between pig and human genomes. e Correlation analysis of gene expression levels in TADs that were rearranged between pigs and humans (i.e., genes in human TAD with orthologs distributed across two inter-chromosomal TADs in pig, n = 114 gene pairs). The Spearman correlations were calculated separately in nine corresponding tissues in pigs and humans. Correlations between orthologous gene pairs were then compared between pigs and humans using a pairwise Wilcoxon test. f Top 20 enriched human phenotypes of human genes in pig-human rearranged TADs. The P-values were using a hypergeometric test with a two-sided test and without adjustment. g Illustration of two pig inter-chromosomal TADs (located in susScr11 Chr4 and Chr9) rearranged into one human TAD (located in hg19 Chr1). h Comparison of head-related and face-related phenotypes between pigs and humans and genes within pig-human rearranged TADs associated with head-related and face-related phenotypes.

Similar articles

Cited by

References

    1. The ENCODE Projects Consortium. et al. An integrated encyclopedia of DNA elements in the human genome. Nature. 2012;489:57–74. doi: 10.1038/nature11247. - DOI - PMC - PubMed
    1. Gerstein MB, et al. Integrative analysis of the Caenorhabditis elegans genome by the modENCODE project. Science. 2010;330:1775–1787. doi: 10.1126/science.1196914. - DOI - PMC - PubMed
    1. The modENCODE Consortium. et al. Identification of functional elements and regulatory circuits by Drosophila modENCODE. Science. 2010;330:1787–1797. doi: 10.1126/science.1198374. - DOI - PMC - PubMed
    1. Yue F, et al. A comparative encyclopedia of DNA elements in the mouse genome. Nature. 2014;515:355–364. doi: 10.1038/nature13992. - DOI - PMC - PubMed
    1. Shen Y, et al. A map of the cis-regulatory sequences in the mouse genome. Nature. 2012;488:116–120. doi: 10.1038/nature11243. - DOI - PMC - PubMed

Publication types

Substances