. 2021 May 3;220(5):e202007149.
doi: 10.1083/jcb.202007149.

RTKN-1/Rhotekin shields endosome-associated F-actin from disassembly to ensure endocytic recycling

Affiliations

RTKN-1/Rhotekin shields endosome-associated F-actin from disassembly to ensure endocytic recycling

Yanling Yan et al. J Cell Biol. .

Abstract

Cargo sorting and the subsequent membrane carrier formation require a properly organized endosomal actin network. To better understand the actin dynamics during endocytic recycling, we performed a genetic screen in C. elegans and identified RTKN-1/Rhotekin as a requisite to sustain endosome-associated actin integrity. Loss of RTKN-1 led to a prominent decrease in actin structures and basolateral recycling defects. Furthermore, we showed that the presence of RTKN-1 thwarts the actin disassembly competence of UNC-60A/cofilin. Consistently, in RTKN-1-deficient cells, UNC-60A knockdown replenished actin structures and alleviated the recycling defects. Notably, an intramolecular interaction within RTKN-1 could mediate the formation of oligomers. Overexpression of an RTKN-1 mutant form that lacks self-binding capacity failed to restore actin structures and recycling flow in rtkn-1 mutants. Finally, we demonstrated that SDPN-1/Syndapin acts to direct the recycling endosomal dwelling of RTKN-1 and promotes actin integrity there. Taken together, these findings consolidated the role of SDPN-1 in organizing the endosomal actin network architecture and introduced RTKN-1 as a novel regulatory protein involved in this process.


Figures

Figure 1.
Figure 1.
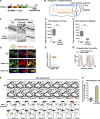
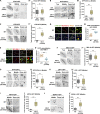
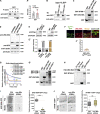
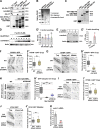
RTKN-1 is required for actin integrity in the intestinal epithelia. (A) Domain architecture of RTKN-1a and allele information of rtkn-1(ok1404). Δ indicates deletion, and * indicates stop codon. (B) A diagram of C. elegans intestine and laser confocal scanning. (C–C′′) Confocal images showing GFP-Utrophin-CH–labeled actin structures in the intestinal cells. White asterisks in the panels indicate intestinal lumen. Box-and-whisker plots (n = 18 cells): 10–90th percentile; dots, outliers; red midline, median of WT; boundaries, quartiles. ***, P < 0.001 by Mann-Whitney test. (D and D′) Confocal images showing the colocalization between GFP-Utrophin-CH and RTKN-1-mCherry. Arrowheads indicate structures labeled by both GFP and mCherry. DAPI channel (blue color) indicates broad-spectrum intestinal autofluorescence. Pearson's correlation coefficient was calculated; error bar is 95% CI (n = 12 animals). (D′′) Line scan profile of GFP and mCherry signals. (E and E′) Live cell fluorescence images showing the dynamics of GFP-Utrophin-CH–labeled actin structures. A total of three intestinal cells of each genotype were sampled. Scale bars, 10 µm. MC, mCherry.
Figure S1.
Figure S1.
RTKN-1 could play a role during development, and loss of RTKN-1 impairs actin integrity. (A–A′′) Measurement of growth time from the L1 larval stage to the young adult stage. (B) Differential interference contrast microscopy showing WT and mutant animals. Scale bars, 50 µm. (C and C′) Confocal images showing Alexa Fluor 488–phalloidin staining in the fixed intestinal cells. White asterisks in the middle focal panels indicate intestinal lumen. Box-and-whisker plots (n = 18 cells): 10–90th percentile; dots, outliers; red midline, median of WT; boundaries, quartiles. ***, P < 0.001 by Mann-Whitney test. (D) Loss of RTKN-1 did not interfere with expression of intestinal actin. (E and E′) Confocal images showing the colocalization between GFP-Utrophin-CH and endogenous RTKN-1. The white arrowheads indicate structures labeled by both GFP and mCherry. Pearson's correlation coefficients were calculated; error bars are 95% CIs (n = 12 animals). Scale bars, 10 µm.
Figure 2.
Figure 2.
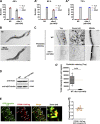
RTKN-1 resides in basolateral recycling endosome. (A and A′) Confocal images showing colocalization between RTKN-1-mCherry and organelle markers. Arrowheads indicate structures labeled by both GFP and mCherry. DAPI channel (blue color) indicates broad-spectrum intestinal autofluorescence. Pearson's correlation coefficients were calculated; error bars are 95% CIs (n = 12 animals). (B and B′) Confocal images showing RTKN-1-GFP distribution upon knock down of phosphatidylinositol kinases. Box-and-whisker plots (n = 18 cells): 10–90th percentile; dots, outliers; red midline, median of WT; boundaries, quartiles **, P < 0.01; ***, P < 0.001, by one-way ANOVA followed by Dunn’s post hoc multiple comparison test. Scale bars, 10 µm. Ctrl, control; MC, mCherry.
Figure S2.
Figure S2.
RTKN-1 is localized in recycling endosomes. (A and A′) Confocal images showing colocalization between RTKN-1-mCherry and recycling endosome markers. (B–C′) Confocal images showing colocalization between GFP-tagged RTKN-1 or RTKN-1-PH and endosome markers. In these panels, the DAPI channel (blue color) indicates broad-spectrum intestinal autofluorescence. Pearson's correlation coefficients were calculated; error bars are 95% CIs (n = 12 animals). ***, P < 0.001 by Mann-Whitney test. (D–I) mRNA level measurement showing RNAi efficiency of phosphatidylinositol kinases. The white arrowheads indicate structures labeled by both GFP and mCherry. Scale bars, 10 µm. Ctrl, control; MC, mCherry; Tb, Tubby.
Figure S3.
Figure S3.
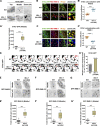
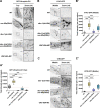
Loss of RTKN-1 affects basolateral endocytic recycling. (A–C′) Confocal images showing the localization of CIE recycling cargo hTAC-GFP, clathrin-dependent nonrecycling cargo GFP-CD4-LL, and CDE recycling cargo hTfR-GFP in intestinal cells. Box-and-whisker plots (n = 18 cells): 10–90th percentile; dots, outliers; red midline, median of WT; boundaries, quartiles. ***, P < 0.001 by Mann-Whitney test. (D–E′) Confocal images showing colocalization between hTfR-GFP and early endosome marker mCherry-RAB-5 or recycling endosome marker mCherry-RME-1. DAPI channel (blue color) indicates broad-spectrum intestinal autofluorescence. Pearson's correlation coefficients were calculated; error bars are 95% CIs (n = 12 animals). ***, P < 0.001 by Mann-Whitney test. (F–H′) Confocal images showing localization of clathrin-dependent retrograde cargo MIG-14-GFP, clathrin-dependent nonrecycling cargo GFP-CD4-LL, and apical recycling cargo LRP-1-GFP. Box-and-whisker plots (n = 18 cells): 10–90th percentile; dots, outliers; red midline, median of WT; boundaries, quartiles. No significant difference by Mann-Whitney test. (I–J′) Confocal images showing subcellular localization of recycling endosome markers ARF-6-GFP and SDPN-1-GFP. Box-and-whisker plots (n = 18 cells): 10–90th percentile; dots, outliers; red midline, median of WT; boundaries, quartiles. ***, P < 0.001 by Mann-Whitney test. The white arrowheads indicate structures labeled by both GFP and mCherry. The asterisks in the image panels indicate intestinal lumen. Scale bars, 10 µm. Ctrl, control; MC, mCherry.
Figure 3.
Figure 3.
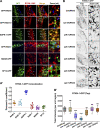
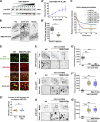
Loss of RTKN-1 impairs basolateral recycling. (A and A′) Confocal images showing the subcellular localization of CIE recycling cargo hTAC-GFP in intestinal cells. Box-and-whisker plots (n = 18 cells): 10–90 percentile; dots, outliers; red midline, median of WT; boundaries, quartiles. ***, P < 0.001 by Mann-Whitney test. (B–C′) Confocal images showing the colocalization between hTAC-GFP and mCherry-tagged RAB-5 or RME-1. Arrowheads indicate structures labeled by both GFP and mCherry. DAPI channel (blue color) indicates broad-spectrum intestinal autofluorescence. Pearson's correlation coefficients were calculated; error bars are 95% CIs (n = 12 animals). ***, P < 0.001 by Mann-Whitney test. (D and D′) Live cell fluorescence images showing hTAC-GFP–positive endosomal dynamics. A total of eight animals of each genotype were sampled. (E–G′) Confocal images showing the localization of early endosome marker GFP-RAB-5, sorting endosome marker GFP-RAB-10, and recycling endosome marker GFP-RME-1 in intestinal cells. Box-and-whisker plots (n = 18 cells): 10–90th percentile; dots, outliers; red midline, median of WT; boundaries, quartiles. ***, P < 0.001 by Mann-Whitney test. The black asterisks in the image panels indicate intestinal lumen. Scale bars, 10 µm. MC, mCherry.
Figure 4.
Figure 4.
RTKN-1 acts independently of the Rho family of GTPases during recycling. (A) Western blot showing GST pulldown with in vitro–translated HA-tagged RTKN-1. RTKN-1 showed an interaction with RHO-1 loaded with GMP-PNP. RTKN-1 displayed no binding to CDC-42 loaded with GDP or GMP-PNP. Also, RTKN-1 displayed no binding to CED-10 loaded with GDP or GMP-PNP. (B–E′) Western blot and confocal images showing RNAi-mediated knockdown efficiency of GFP-RHO-1, GFP-CDC-42, and GFP-CED-10. Box-and-whisker plots (n = 18 cells): 10–90th percentile; dots, outliers; red midline, median of WT; boundaries, quartiles. ***, P < 0.001 by Mann-Whitney test. (F–H′) Confocal images showing subcellular localization of RTKN-1-GFP, hTAC-GFP, and hTfR-GFP in intestinal cells. Box-and-whisker plots (n = 18 cells): 10–90th percentile; dots, outliers; red midline, median of WT; boundaries, quartiles. ***, P < 0.001 by one-way ANOVA followed by Dunn’s post hoc multiple comparison test. Scale bars, 10 µm. The black asterisks in the image panels indicate intestinal lumen. Ctrl, control; MC, mCherry.
Figure 5.
Figure 5.
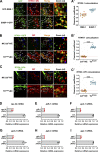
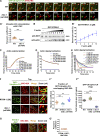
RTKN-1 impedes UNC-60A–mediated actin disassembly. (A and A′) Live cell fluorescence images showing the dynamic correlation between GFP-Utrophin-CH– and hTAC-GFP–labeled structures. White arrowheads indicate the hTAC-labeled mobile membrane carrier or dynamic tubules. Pearson's correlation coefficients were calculated; error bars are 95% CIs (n = 12 animals). ***, P < 0.001 by Mann-Whitney test. (B and B′) The actin-binding potential of GST-RTKN-1 was measured using the cosedimentation assay. Multiple concentrations were deployed to make a curve to estimate interaction (n = 3 independent experiments). (C) Actin polymerization was not affected by the presence of GST-RTKN-1 at various concentrations. (D) F-actin depolymerization was not affected by the presence of GST-RTKN-1 at various concentrations. (E) GST-RTKN-1 deferred GST-UNC-60A–mediated F-actin depolymerization, t1/2 has been indicated. (F and F′) Confocal images showing the colocalization between endogenous UNC-60A and Utrophin-CH–labeled actin structures. OE, overexpression. Mander's coefficients were calculated; error bars are 95% CIs (n = 12 animals). **, P < 0.01; ***, P < 0.001 by Mann-Whitney test. (F′′) Fluorescence intensity measurement of GFP-Utrophin-CH. Box-and-whisker plots (n = 18 cells): 10–90th percentile; dots, outliers; red midline, median of WT; boundaries, quartiles. ***, P < 0.001 by one-way ANOVA followed by Dunn’s post hoc multiple comparison test. (G and G′) Confocal images showing the colocalization between endogenous UNC-60A and RTKN-1-GFP. Pearson's correlation coefficients were calculated; error bars are 95% CIs (n = 12 animals). Scale bars, 10 µm. P, pellet; S, supernatant.
Figure S4.
Figure S4.
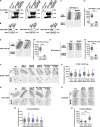
RTKN-1 interacts with F-actin but not with UNC-60A. (A and A′) The actin-binding potential of GST was measured using the cosedimentation assay. Band intensity was quantified by using the “Plot Lanes” function of ImageJ; error bars are 95% CIs (n = 3 independent experiments). No significant difference by Student’s t test. (B) Coimmunoprecipitation assay analyzing RTKN-1–actin interaction. (C) GST-tagged UNC-60A and RTKN-1 were separated on SDS-PAGE and stained with Coomassie blue. (D) Western blot showing UNC-60A (18 kD) and UNC-60A-GFP (45 kD) in WT, unc-60a(RNAi), and UNC-60A-GFP animals. (E and E′) The endogenous level of UNC-60A or RTKN-1 (UNC-60A::2xFlag and RTKN-1::2xFlag CRISPR knockin strains). Relative intensity of UNC-60A or RTKN-1 was calculated with reference to the actin level, and the normalized level of RTKN-1 served as a standard (1.000). (F and F′) Confocal images showing colocalization between endogenous UNC-60A and PI(4,5)P2 reporter Tubby (Tb)-PH(R332H). The white arrowheads indicate structures labeled by both GFP and mCherry. Pearson's correlation coefficients were calculated; error bars are 95% CIs (n = 12 animals). (G and G′) The presence of GST-COR-1 or GST-POD-1 did not affect GST-UNC-60A–mediated actin depolymerization. GST-tagged proteins were separated on SDS-PAGE and stained with Coomassie blue. (H) Western blot showing GST pulldown with in vitro–translated HA-tagged UNC-60A. There was no interaction between RTKN-1 and UNC-60A. (I–J′) Confocal images showing RNAi-mediated knockdown of UNC-60A-GFP and the subcellular distribution of RTKN-1-GFP. Box-and-whisker plots (n = 18 cells): 10–90th percentile; dots, outliers; red midline, median of WT; boundaries, quartiles. ***, P < 0.001 by Mann-Whitney test. The black asterisks in the image panels indicate intestinal lumen. Scale bars, 10 µm. Ctrl, control; IB, immunoblot; IP, immunoprecipitation; P, pellet; S, supernatant.
Figure 6.
Figure 6.
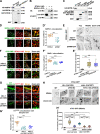
Loss of UNC-60A mitigates recycling defects in RTKN-1–deficient cells. (A and A′) Confocal images showing the distribution of Utrophin-CH in intestinal cells. Box-and-whisker plots (n = 18 cells): 10–90th percentile; dots, outliers; red midline, median of WT; boundaries, quartiles. ***, P < 0.001 by one-way ANOVA followed by Dunn’s post hoc multiple comparison test. (B–C′) Confocal images showing the distribution of hTAC-GFP and hTfR-GFP. Box-and-whisker plots (n = 18 cells): 10–90th percentile; dots, outliers; red midline, median of WT; boundaries, quartiles. *, P < 0.05; ***, P < 0.001 by one-way ANOVA followed by Dunn’s post hoc multiple comparison test. The black asterisks in the image panels indicate intestinal lumen. Scale bars, 10 µm.
Figure 7.
Figure 7.
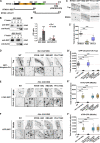
N-terminal RBD and PH-CT are required for RTKN-1 functionality. (A) Domain architecture of RTKN-1a and fragments. (B and B′) The actin-binding potential of the purified GST-RBD or GST-PH-CT was measured by using the cosedimentation assay. Band intensity was quantified by using the “Plot Lanes” function of ImageJ; error bars are 95% CIs (n = 3 independent experiments). ***, P < 0.001 by Student’s t test. (C and C′) Confocal images showing subcellular localization of RTKN-1-GFP, RBD-GFP, and PH-CT-GFP in intestinal cells. Box-and-whisker plots (n = 18 cells): 10–90th percentile; dots, outliers; red midline, median of WT; boundaries, quartiles. ***, P < 0.001 by one-way ANOVA followed by Dunn’s post hoc multiple comparison test. (D–F′) Confocal images showing the distribution of GFP-Utrophin-CH, hTAC-GFP, and hTfR-GFP in intestinal cells. Box-and-whisker plots (n = 18 cells): 10–90th percentile; dots, outliers; red midline, median of WT; boundaries, quartiles. ***, P < 0.001 by one-way ANOVA followed by Dunn’s post hoc multiple comparison test. The black asterisks in the image panels indicate intestinal lumen. Scale bars, 10 µm. Ctrl, control; MC, mCherry; P, pellet; S, supernatant.
Figure 8.
Figure 8.
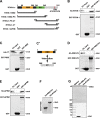
RTKN-1-CT is imperative for RTKN-1 oligomerization. (A) Domain architecture of RTKN-1a and fragments, including RBD, RBD-PH, PH-CT, CT, and ΔPRM. Δ indicates deletion. (B) Western blot showing GST pulldown with in vitro–translated HA-tagged RTKN-1. (C and C′) Western blot showing GST pulldown with in vitro–translated HA-tagged RTKN-1-CT. (D) Western blot showing GST pulldown with in vitro–translated HA-RBD-PH. (E) Western blot showing GST pulldown with in vitro translated HA-RTKN-1 ΔPRM. (F) SDS-PAGE of purified HA-RBD-PH and HA-RTKN-1. (G) Gradient SDS-PAGE of covalently crosslinked HA-RBD-PH and HA-RTKN-1.
Figure S5.
Figure S5.
CT behind PH domain mediates RTKN-1 self-association and RTKN-1 functions independently of PTRN-1 and SORB-1 in the intestine. (A) Western blot showing GST pulldown with in vitro–translated HA-tagged proteins. GST-RBD exhibited an interaction with HA-CT. (B) Native PAGE of uncrosslinked HA-RBD-PH and HA-RTKN-1. (C) GST-tagged proteins were separated on SDS-PAGE and stained with Coomassie blue. (D–E′) The actin-bundling capacity of HA-RTKN-1 was measured using the cosedimentation assay. α-Actinin was used as a positive control. Multiple concentrations were deployed to estimate the pellet/supernatant (P/S) ratio. Error bars are 95% CIs (n = 3 independent experiments). **, P < 0.01 by Student’s t test. (F–H′) Confocal images showing the subcellular localization of RTKN-1-GFP, EHBP-1-GFP, and GFP-Utrophin-CH in intestinal cells. Box-and-whisker plots (n = 18 cells): 10–90th percentile; dots, outliers; red midline, median of WT; boundaries, quartiles. **, P < 0.01; ***, P < 0.001 by Mann-Whitney test. (I–J′) The subcellular localization of RTKN-1-GFP or hTAC-GFP was not significantly affected in sorb-1(RNAi) cells. Box-and-whisker plots (n = 18 cells): 10–90th percentile; dots, outliers; red midline, median of WT; boundaries, quartiles. No significant difference by Mann-Whitney test. (K) mRNA level showing RNAi-mediated knockdown efficiency of SORB-1. Error bars are 95% CIs (n = 3 independent experiments). ***, P < 0.001 by Student’s t test. The black asterisks in the image panels indicate intestinal lumen. Scale bars, 10 µm. Ctrl, control; MC, mCherry.
Figure 9.
Figure 9.
RTKN-1-CT is a determinant for actin integrity during basolateral recycling. (A and A′) The actin-binding potential of the GST-RBD-PH was measured using the cosedimentation assay. Multiple concentrations were deployed to make a curve to estimate interaction (n = 3 independent experiments). (B and B′) Confocal images showing localization of RTKN-1-GFP and RBD-PH-GFP in intestinal cells. Box-and-whisker plots (n = 18 cells): 10–90th percentile; dots, outliers; red midline, median of WT; boundaries, quartiles. ***, P < 0.001 by Mann-Whitney test. (C) GST-RBD or GST-RBD-PH did not affect GST-UNC-60A–mediated actin depolymerization; t1/2 has been indicated. (D and D′) Confocal images showing the colocalization between endogenous UNC-60A and Utrophin-CH–labeled actin structures. The white arrowheads indicate structures labeled by both GFP and mCherry. OE, overexpression. Mander's coefficients were calculated; error bars are 95% CIs (n = 12 animals). (E–G′) Confocal images showing the distribution of GFP-Utrophin-CH, hTAC-GFP, and hTfR-GFP in intestinal cells. Box-and-whisker plots (n = 18 cells): 10–90th percentile; dots, outliers; red midline, median of WT; boundaries, quartiles. ***, P < 0.001 by one-way ANOVA followed by Dunn’s post hoc multiple comparison test. The black asterisks in the image panels indicate intestinal lumen. Scale bars, 10 µm. MC, mCherry; P, pellet; S, supernatant.
Figure 10.
Figure 10.
SDPN-1 directs the localization of RTKN-1 in recycling endosomes. (A) Western blot showing GST pulldown with in vitro–translated HA-tagged AMPH-1 and SDPN-1. (B) Coimmunoprecipitation assay analyzing RTKN-1–SDPN-1 interaction. (C) Western blot showing GST pulldown with in vitro–translated HA-SDPN-1. (D and D′) Confocal image showing colocalization between SDPN-1-GFP and mCherry-tagged RTKN-1 or RTKN-1ΔPRM in the intestinal cells. The white arrowheads indicate structures labeled by both GFP and mCherry. Pearson’s correlation coefficients for GFP and mCherry signals are calculated; error bar is 95% CI (n = 12 animals). ***, P < 0.001 by Mann-Whitney test. (E and E′) Confocal images showing the distribution of RTKN-1-GFP. Box-and-whisker plots (n = 18 cells): 10–90th percentile; dots, outliers; red midline, median of WT; boundaries, quartiles. ***, P < 0.001 by one-way ANOVA followed by Dunn’s post hoc multiple comparison test. (F and F′) Confocal image showing colocalization between GFP-RME-1 and mCherry-tagged RTKN-1 or RTKN-1ΔPRM in the intestinal cells. Pearson’s correlation coefficients for GFP and mCherry signals are calculated; error bar is 95% CI (n = 12 animals). ***, P < 0.001 by Mann-Whitney test. (G and G′) Confocal image showing colocalization between GFP-Utrophin-CH and Tubby (Tb)-PH(R332H)-mCherry in the intestinal cells. Pearson’s correlation coefficients for GFP and mCherry signals are calculated; error bar is 95% CI (n = 12 animals). ***, P < 0.001 by Mann-Whitney test. (H and H′) Confocal images showing the distribution of hTAC-GFP. Box-and-whisker plots (n = 18 cells): 10–90th percentile; dots, outliers; red midline, median of WT; boundaries, quartiles. **, P < 0.01; ***, P < 0.001 by one-way ANOVA followed by Dunn’s post hoc multiple comparison test. The black asterisks in the image panels indicate intestinal lumen. Scale bars, 10 µm. IB, immunoblot; IP, immunoprecipitation; MC, mCherry.

Similar articles

Cited by

References

    1. Akamatsu, M., Vasan R., Serwas D., Ferrin M.A., Rangamani P., and Drubin D.G.. 2020. Principles of self-organization and load adaptation by the actin cytoskeleton during clathrin-mediated endocytosis. eLife. 9:e49840. 10.7554/eLife.49840 - DOI - PMC - PubMed
    1. Birchall, P.S., Fishpool R.M., and Albertson D.G.. 1995. Expression patterns of predicted genes from the C. elegans genome sequence visualized by FISH in whole organisms. Nat. Genet. 11:314–320. 10.1038/ng1195-314 - DOI - PubMed
    1. Bishop, A.L., and Hall A.. 2000. Rho GTPases and their effector proteins. Biochem. J. 348:241–255. 10.1042/bj3480241 - DOI - PMC - PubMed
    1. Braun, A., Pinyol R., Dahlhaus R., Koch D., Fonarev P., Grant B.D., Kessels M.M., and Qualmann B.. 2005. EHD proteins associate with syndapin I and II and such interactions play a crucial role in endosomal recycling. Mol. Biol. Cell. 16:3642–3658. 10.1091/mbc.e05-01-0076 - DOI - PMC - PubMed
    1. Camera, P., da Silva J.S., Griffiths G., Giuffrida M.G., Ferrara L., Schubert V., Imarisio S., Silengo L., Dotti C.G., and Di Cunto F.. 2003. Citron-N is a neuronal Rho-associated protein involved in Golgi organization through actin cytoskeleton regulation. Nat. Cell Biol. 5:1071–1078. 10.1038/ncb1064 - DOI - PubMed

Publication types

MeSH terms