Identification of markers associated with brain metastasis from breast cancer through bioinformatics analysis and verification in clinical samples
- PMID: 33842237
- PMCID: PMC8033074
- DOI: 10.21037/gs-20-767
Identification of markers associated with brain metastasis from breast cancer through bioinformatics analysis and verification in clinical samples
Abstract
Background: Brain metastasis from breast cancer (BC) is an important cause of BC-related death. The present study aimed to identify markers of brain metastasis from BC.
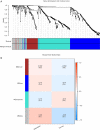
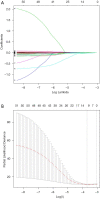
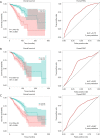
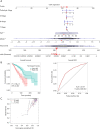
Methods: Datasets were downloaded from the public databases Gene Expression Omnibus (GEO) and The Cancer Genome Atlas (TCGA). Weighted gene co-expression network analysis (WGCNA) was performed to identify metastasis-associated genes (MAGs). Least absolute shrinkage and selection operator (LASSO) Cox proportional hazards regression models were constructed for screening key MAGs. Survival analysis and receiver operating characteristic (ROC) curves were used for evaluating the prognostic value. The factors associated with tumor metastasis were integrated to create a nomogram of TCGA data using R software. Gene Set Enrichment Analyses (GSEA) was performed for detecting the potential mechanisms of identified MAGs. Immunohistochemistry (IHC) was used to verify the expression of the key genes in clinical samples.
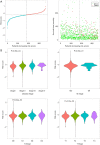
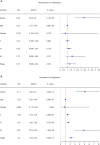
Results: The genes in 2 modules were identified to be significantly associated with metastasis through WGCNA. LASSO Cox proportional hazards regression models were constructed successfully. Subsequently, a clinical prediction model was constructed, and a nomogram was mapped, which had better sensitivity and specificity for BC metastasis. Two key genes, discs large homolog 3 (DLG3) and growth factor independence 1 (GFI1), were highly expressed in clinical samples, and the expression of these 2 genes was associated with patients' survival time.
Conclusions: We successfully constructed a clinical prediction model for brain metastasis from BC, and identified that the expression of DLG3 and GFI1 were strongly associated with brain metastasis from BC.
Keywords: Brain metastasis from breast cancer (BMBC); discs large homolog 3 (DLG3); growth factor independence 1 (GFI1); least absolute shrinkage and selection operator (LASSO); nomogram.
2021 Gland Surgery. All rights reserved.
Conflict of interest statement
Conflicts of Interest: All authors have completed the ICMJE uniform disclosure form (available at http://dx.doi.org/10.21037/gs-20-767). The authors have no conflicts of interest to declare.
Figures



Similar articles
-
Construction of a novel mRNA-signature prediction model for prognosis of bladder cancer based on a statistical analysis.BMC Cancer. 2021 Jul 27;21(1):858. doi: 10.1186/s12885-021-08611-z. BMC Cancer. 2021. PMID: 34315402 Free PMC article.
-
Prediction of Overall Survival Among Female Patients With Breast Cancer Using a Prognostic Signature Based on 8 DNA Repair-Related Genes.JAMA Netw Open. 2020 Oct 1;3(10):e2014622. doi: 10.1001/jamanetworkopen.2020.14622. JAMA Netw Open. 2020. PMID: 33017027 Free PMC article.
-
Identification of a nomogram based on long non-coding RNA to improve prognosis prediction of esophageal squamous cell carcinoma.Aging (Albany NY). 2020 Jan 24;12(2):1512-1526. doi: 10.18632/aging.102697. Epub 2020 Jan 24. Aging (Albany NY). 2020. PMID: 31978896 Free PMC article.
-
Identification of the Real Hub Gene and Construction of a Novel Prognostic Signature for Pancreatic Adenocarcinoma Based on the Weighted Gene Co-expression Network Analysis and Least Absolute Shrinkage and Selection Operator Algorithms.Front Genet. 2021 Aug 20;12:692953. doi: 10.3389/fgene.2021.692953. eCollection 2021. Front Genet. 2021. PMID: 34490033 Free PMC article.
-
Construction of Competitive Endogenous RNA Network and Verification of 3-Key LncRNA Signature Associated With Distant Metastasis and Poor Prognosis in Patients With Clear Cell Renal Cell Carcinoma.Front Oncol. 2021 Mar 24;11:640150. doi: 10.3389/fonc.2021.640150. eCollection 2021. Front Oncol. 2021. PMID: 33869028 Free PMC article.
Cited by
-
Identification of Key Genes Associated with Brain Metastasis from Breast Cancer: A Bioinformatics Analysis.Med Sci Monit. 2022 Mar 17;28:e935071. doi: 10.12659/MSM.935071. Med Sci Monit. 2022. PMID: 35296631 Free PMC article.
-
A model for predicting clinical prognosis based on brain metastasis-related genes in patients with breast cancer.Transl Cancer Res. 2023 Dec 31;12(12):3453-3470. doi: 10.21037/tcr-23-1123. Epub 2023 Dec 7. Transl Cancer Res. 2023. PMID: 38192988 Free PMC article.
-
Comprehensive Analysis Identifies COL1A1, COL3A1, and POSTN as Key Genes Associated with Brain Metastasis in Patients with Breast Cancer.Evid Based Complement Alternat Med. 2022 Aug 12;2022:7812218. doi: 10.1155/2022/7812218. eCollection 2022. Evid Based Complement Alternat Med. 2022. Retraction in: Evid Based Complement Alternat Med. 2023 Jun 21;2023:9792857. doi: 10.1155/2023/9792857. PMID: 35990840 Free PMC article. Retracted.
-
Identification of prognostic biomarkers for breast cancer brain metastases based on the bioinformatics analysis.Biochem Biophys Rep. 2022 Jan 10;29:101203. doi: 10.1016/j.bbrep.2022.101203. eCollection 2022 Mar. Biochem Biophys Rep. 2022. PMID: 35059509 Free PMC article.
-
Lineage Plasticity and Stemness Phenotypes in Prostate Cancer: Harnessing the Power of Integrated "Omics" Approaches to Explore Measurable Metrics.Cancers (Basel). 2023 Sep 1;15(17):4357. doi: 10.3390/cancers15174357. Cancers (Basel). 2023. PMID: 37686633 Free PMC article. Review.
References
LinkOut - more resources
Full Text Sources
Other Literature Sources
