

Impact of the COVID-19 induced lockdown measures on concentration in USA
- PMID: 33841026
- PMCID: PMC8025541
- DOI: 10.1016/j.atmosenv.2021.118388
Impact of the COVID-19 induced lockdown measures on concentration in USA
Abstract
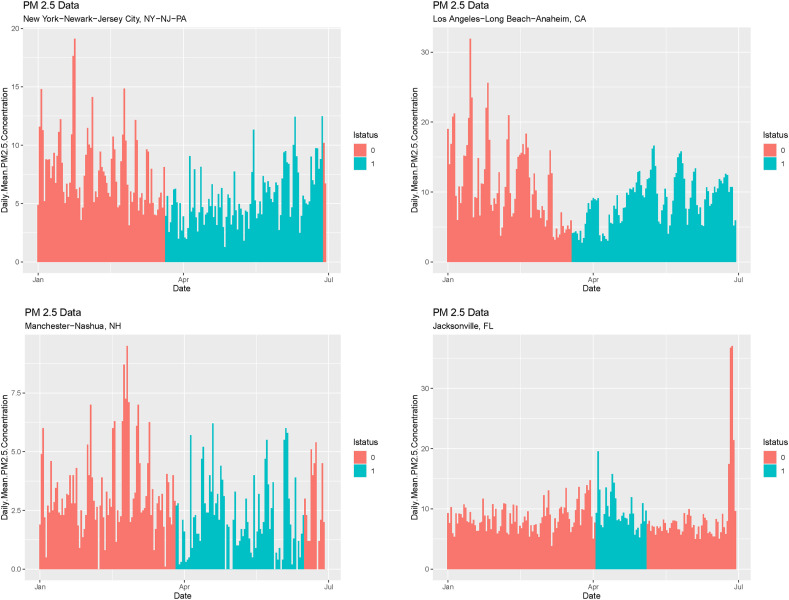
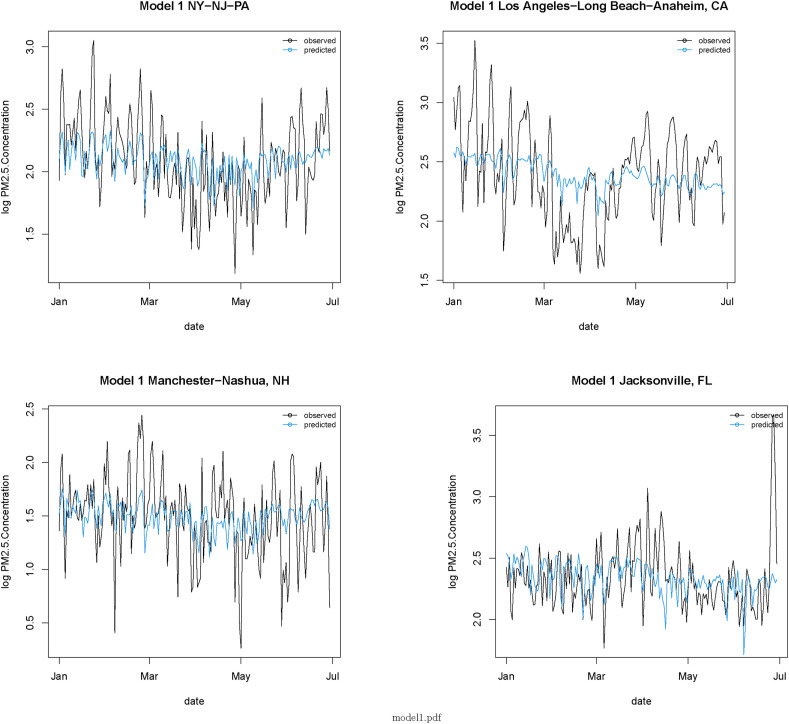
In 2020, most countries around the world have observed varying degrees of public lockdown measures to mitigate the transmission of SARS-CoV-2. As an unintended consequence of reduced transportation and industrial activities, air quality has dramatically improved in many major cities around the world. In this paper, we analyze the environmental impact of the lockdown measures on concentration levels in 48 core-based statistical areas (CBSA) of the United States, during the pre and post-lockdown period of January to June 2020. We model the effect of lockdown on the concentration in different CBSAs while adjusting for various meteorological factors like temperature, wind-speed, precipitation and snow. Linear mixed effects models and functional regression methods with random intercepts are employed to capture the heterogeneity of the effect across different regions. Our analysis shows there is a statistically significant reduction in levels of across most of the regions during the lock-down period, although interestingly, this effect is not uniform across all the CBSAs under consideration.
Keywords: Air quality; COVID-19; Functional regression; Lockdown; Mixed effects model; PM2.5.
© 2021 Elsevier Ltd. All rights reserved.
Conflict of interest statement
The authors declare that they have no known competing financial interests or personal relationships that could have appeared to influence the work reported in this paper.
Figures
Similar articles
-
An application of probability density function for the analysis of PM2.5 concentration during the COVID-19 lockdown period.Sci Total Environ. 2021 Aug 15;782:146681. doi: 10.1016/j.scitotenv.2021.146681. Epub 2021 Mar 27. Sci Total Environ. 2021. PMID: 33836380 Free PMC article.
-
The regional impact of the COVID-19 lockdown on the air quality in Ji'nan, China.Sci Rep. 2022 Jul 15;12(1):12099. doi: 10.1038/s41598-022-16105-6. Sci Rep. 2022. PMID: 35840644 Free PMC article.
-
Revisiting the levels of Aerosol Optical Depth in south-southeast Asia, Europe and USA amid the COVID-19 pandemic using satellite observations.Environ Res. 2021 Feb;193:110514. doi: 10.1016/j.envres.2020.110514. Epub 2020 Nov 25. Environ Res. 2021. PMID: 33245884 Free PMC article.
-
Improvement in air quality and its impact on land surface temperature in major urban areas across India during the first lockdown of the pandemic.Environ Res. 2021 Aug;199:111280. doi: 10.1016/j.envres.2021.111280. Epub 2021 May 21. Environ Res. 2021. PMID: 34029544 Free PMC article.
-
Significant variation in air quality in South Indian cities during COVID-19 lockdown and unlock phases.Environ Monit Assess. 2023 May 31;195(6):772. doi: 10.1007/s10661-023-11375-7. Environ Monit Assess. 2023. PMID: 37253943 Free PMC article.
Cited by
-
Understanding Air Quality Changes after Implementation of Mitigation Measures during a Pandemic: A Scoping Review of Literature in the United States.Aerosol Air Qual Res. 2022 Nov;22(11):10.4209/aaqr.220047. doi: 10.4209/aaqr.220047. Aerosol Air Qual Res. 2022. PMID: 39100887 Free PMC article.
-
Haze Occurrence Caused by High Gas-to-Particle Conversion in Moisture Air under Low Pollutant Emission in a Megacity of China.Int J Environ Res Public Health. 2022 May 25;19(11):6405. doi: 10.3390/ijerph19116405. Int J Environ Res Public Health. 2022. PMID: 35681990 Free PMC article.
-
Impact of COVID-19 Pandemic on Air Quality: A Systematic Review.Int J Environ Res Public Health. 2022 Feb 10;19(4):1950. doi: 10.3390/ijerph19041950. Int J Environ Res Public Health. 2022. PMID: 35206139 Free PMC article. Review.
-
Air pollution rebound and different recovery modes during the period of easing COVID-19 restrictions.Sci Total Environ. 2022 Oct 15;843:156942. doi: 10.1016/j.scitotenv.2022.156942. Epub 2022 Jun 23. Sci Total Environ. 2022. PMID: 35753487 Free PMC article.
References
-
- Barboza T. Los Angeles Times; 2020. How the Coronavirus Is Hampering Enforcement of California's Air Pollution Rules.
-
- Covid19.Ca.GOV . COVID19.CA.GOV; 2020. Blueprint for a Safer Economy. 2020.
LinkOut - more resources
Full Text Sources
Other Literature Sources
Research Materials
Miscellaneous