

iSMNN: batch effect correction for single-cell RNA-seq data via iterative supervised mutual nearest neighbor refinement
- PMID: 33839756
- PMCID: PMC8579191
- DOI: 10.1093/bib/bbab122
iSMNN: batch effect correction for single-cell RNA-seq data via iterative supervised mutual nearest neighbor refinement
Abstract
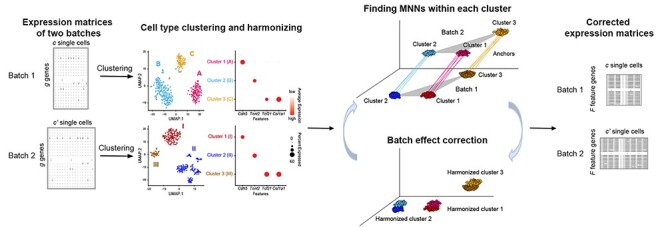
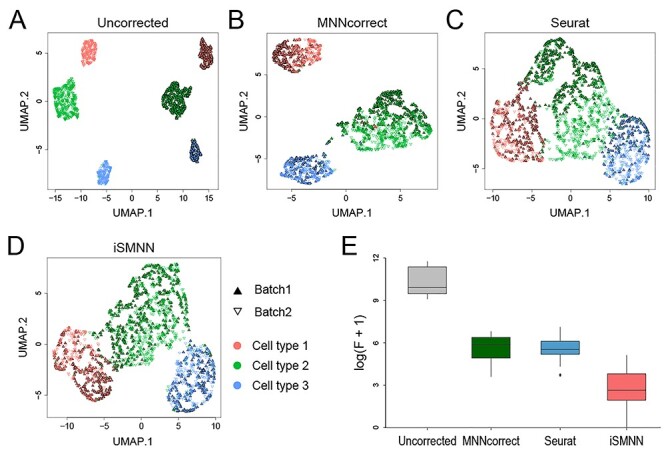
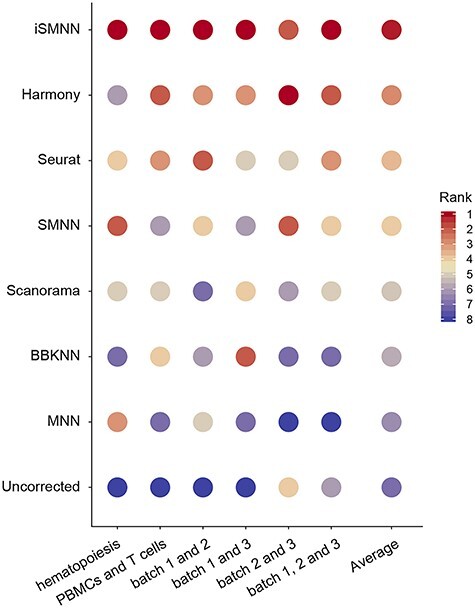
Batch effect correction is an essential step in the integrative analysis of multiple single-cell RNA-sequencing (scRNA-seq) data. One state-of-the-art strategy for batch effect correction is via unsupervised or supervised detection of mutual nearest neighbors (MNNs). However, both types of methods only detect MNNs across batches of uncorrected data, where the large batch effects may affect the MNN search. To address this issue, we presented a batch effect correction approach via iterative supervised MNN (iSMNN) refinement across data after correction. Our benchmarking on both simulation and real datasets showed the advantages of the iterative refinement of MNNs on the performance of correction. Compared to popular alternative methods, our iSMNN is able to better mix the cells of the same cell type across batches. In addition, iSMNN can also facilitate the identification of differentially expressed genes (DEGs) that are relevant to the biological function of certain cell types. These results indicated that iSMNN will be a valuable method for integrating multiple scRNA-seq datasets that can facilitate biological and medical studies at single-cell level.
Keywords: batch effect correction; iterative refinement; mutual nearest neighbor; single-cell RNA-seq.
© The Author(s) 2021. Published by Oxford University Press. All rights reserved. For Permissions, please email: journals.permissions@oup.com.
Figures


Similar articles
-
Data normalization for addressing the challenges in the analysis of single-cell transcriptomic datasets.BMC Genomics. 2024 May 6;25(1):444. doi: 10.1186/s12864-024-10364-5. BMC Genomics. 2024. PMID: 38711017 Free PMC article. Review.
-
SMNN: batch effect correction for single-cell RNA-seq data via supervised mutual nearest neighbor detection.Brief Bioinform. 2021 May 20;22(3):bbaa097. doi: 10.1093/bib/bbaa097. Brief Bioinform. 2021. PMID: 32591778 Free PMC article.
-
Batch effects in single-cell RNA-sequencing data are corrected by matching mutual nearest neighbors.Nat Biotechnol. 2018 Jun;36(5):421-427. doi: 10.1038/nbt.4091. Epub 2018 Apr 2. Nat Biotechnol. 2018. PMID: 29608177 Free PMC article.
-
NDMNN: A novel deep residual network based MNN method to remove batch effects from scRNA-seq data.J Bioinform Comput Biol. 2024 Jun;22(3):2450015. doi: 10.1142/S021972002450015X. Epub 2024 Jul 20. J Bioinform Comput Biol. 2024. PMID: 39036845
-
Supervised application of internal validation measures to benchmark dimensionality reduction methods in scRNA-seq data.Brief Bioinform. 2021 Nov 5;22(6):bbab304. doi: 10.1093/bib/bbab304. Brief Bioinform. 2021. PMID: 34374742 Review.
Cited by
-
Virus infection pattern imprinted and diversified the differentiation of T-cell memory in transcription and function.Front Immunol. 2024 Jan 9;14:1334597. doi: 10.3389/fimmu.2023.1334597. eCollection 2023. Front Immunol. 2024. PMID: 38264657 Free PMC article.
-
Data normalization for addressing the challenges in the analysis of single-cell transcriptomic datasets.BMC Genomics. 2024 May 6;25(1):444. doi: 10.1186/s12864-024-10364-5. BMC Genomics. 2024. PMID: 38711017 Free PMC article. Review.
-
CLAIRE: contrastive learning-based batch correction framework for better balance between batch mixing and preservation of cellular heterogeneity.Bioinformatics. 2023 Mar 1;39(3):btad099. doi: 10.1093/bioinformatics/btad099. Bioinformatics. 2023. PMID: 36821425 Free PMC article.
-
Beaconet: A Reference-Free Method for Integrating Multiple Batches of Single-Cell Transcriptomic Data in Original Molecular Space.Adv Sci (Weinh). 2024 Jul;11(26):e2306770. doi: 10.1002/advs.202306770. Epub 2024 May 6. Adv Sci (Weinh). 2024. PMID: 38711214 Free PMC article.
-
Extensive proteome and functional genomic profiling of variability between genetically identical human B-lymphoblastoid cells.Sci Data. 2022 Dec 10;9(1):763. doi: 10.1038/s41597-022-01871-9. Sci Data. 2022. PMID: 36496436 Free PMC article.
References
Publication types
MeSH terms
Grants and funding
LinkOut - more resources
Full Text Sources
Other Literature Sources
Molecular Biology Databases
