. 2021 Sep;178(17):3448-3462.
doi: 10.1111/bph.15491. Epub 2021 Jun 1.

Surfactant cocamide monoethanolamide causes eye irritation by activating nociceptor TRPV1 channels

Affiliations

Surfactant cocamide monoethanolamide causes eye irritation by activating nociceptor TRPV1 channels

Fang Zhao et al. Br J Pharmacol. 2021 Sep.

Abstract

Background and purpose: Cocamide monoethanolamide (CMEA) is commonly used as a surfactant-foam booster in cosmetic formulations. Upon contact with the eye or other sensitive skin areas, CMEA elicits stinging and lasting irritation. We hypothesized a specific molecular interaction with TRPV1 channels by which CMEA caused eye irritation.

Experimental approach: Eye irritancy was evaluated using eye-wiping tests in rabbits and mice. Intracellular Ca2+ concentrations and action potentials were measured using Ca2+ imaging and current clamp respectively. Voltage clamp, site-direct mutagenesis and molecular modelling were used to identify binding pockets for CMEA on TRPV1 channels.

Key results: CMEA-induced eye irritation is ameliorated by selective ablation of TRPV1 channels.Rodents exhibit much stronger responses to CMEA than rabbits. In trigeminal ganglion neurons, CMEA induced Ca2+ influx and neuronal excitability, effects mitigated by a TRPV1 channel inhibition and absent in TRPV1 knockout neurons. In HEK-293 cells expressing TRPV1 channels, CMEA increased whole-cell currents by increasing channel open probability (EC50 = 10.2 μM), without affecting TRPV2, TRPV3, TRPV4, and TRPA1 channel activities. Lauric acid monoethanolamide (LAMEA), the most abundant constituent of CMEA, was the most efficacious and potent TRPV1 channel activator, binding to the capsaicin-binding pocket of the channel. The T550I mutants of rabbit and human TRPV1 channels exhibit much lower sensitivity to LAMEA.

Conclusions and implication: CMEA directly activates TRPV1 channels to produce eye irritation. Rabbits, the standard animal used for eye irritancy tests are poor models for evaluating human eye irritants structurally related to CMEA. Our study identifies potential alternatives to CMEA as non-irritating surfactants.

Keywords: cocamide monoethanolamide; eye irritant; transient receptor potential vanilloid type 1.


Conflict of interest statement

Conflicts of Interest: Authors declare no conflict of interest.

Figures

Fig. 1
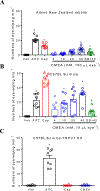
Fig. 1. CMEA produces eye irritation through TRPV1 activation.
(A) CMEA dose-response (4−40 mM) on the eye-wiping behavior of New Zealand rabbit and response mitigation by TRPV1 inhibitor, SB-366791 (17 mM). The TRPA1 activator, allyl isothiocyanate (AITC, 10 mM) and the TRPV1 agonist, capsaicin (Cap, 1 mM) were used as controls. Each eye received 100 μL of the drug solution. *, P < 0.05, drugs vs. Veh (1% DMSO); #, P < 0.05, SB-366771+ CMEA (40 mM) vs. CMEA (40 mM). (B) Mice are more sensitive to CMEA (4−40 mM) in eye-wiping response and largely mitigated by co-instillation of TRPV1 inhibitor, SB-366791 (17 mM), to the eye. *, P < 0.05, drugs vs. Veh (1% DMSO); #, P < 0.05, SB-366791+ CMEA (40 mM) vs. CMEA (40 mM). (C) TRPV1 knockout (KO) mice are insensitive to CMEA (40 mM) or Cap (1 mM) in the eye-wiping assay, whereas they maintain sensitivity to AITC (10 mM). Each eye receives 10 μL of the drug solution. *, P < 0.05, drugs vs. Veh (1% DMSO). Data points represent the Mean ± SEM (n = 8 animals).
Fig. 2
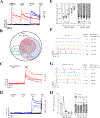
Fig. 2. CMEA stimulates Ca2+ influx and affects action potential firing in trigeminal ganglion (TG) neurons through TRPV1 activation.
(A) Representative traces of CMEA (40 μM), capsaicin (Cap, 1 μM), AITC (100 μM) and KCl (30 mM)-induced Ca2+ response in TG neurons. Each trace represents the intracellular Ca2+ response of individual neurons as a function of time. Each drug solution was consecutively administrated by bulk perfusion. KCl responsive cells were TG neurons and included in the analysis of drug effects. (B) Quantification of Cap, CMEA, allyl isothiocyanate (AITC) responsive neurons from TG neurons isolated from TRPV1 WT mice. (C) Representative traces demonstrating SB-366791 (1 µM) suppression of CMEA-induced Ca2+ influx in TG neurons. (D) Representative traces of CMEA (40 μM), Cap (1 μM), AITC (100 μM) and KCl (100 mM) affecting Ca2+ dynamics in TG neurons acutely isolated from TRPV1 knockout (KO) mice. AITC, but not CMEA or capsaicin, triggered Ca2+ influx in TRPV1 KO TG neurons. (E) CMEA depolarizes TG neuronal cell membrane potential in isolated from WT but not TRPV1 KO mice. *, P < 0.05, CMEA vs. Veh (0.1% DMSO) (n = 8 neurons). (F) Representative traces showing CMEA mediated alteration in action potential (AP) tonic firing in TG neurons of WT mice. (G) Tonic firing of AP in TG neurons isolated from TRPV1 KO mice are unaffected by CMEA. Tonic AP firing are elicited by injection of 100-pA current of 1 s duration. (H) Frequency of AP tonic firing in the absence and presence of CMEA in WT and TRPV1 KO TG neurons. CMEA produces a bidirectional response on AP tonic firing in WT TG neurons but does not affect AP firing in TRPV1 KO TG neurons (n = 5 neurons). *, P < 0.05, CMEA vs. Veh (0.1% DMSO). Data points are the Mean ± SEM.
Fig. 3
Fig. 3. CMEA directly activates hTRPV1 expressed in HEK-293 cells.
(A) Representative trace for sequential titration of CMEA-triggered inward (−100 mV) and outward (+100 mV) currents in HEK-293 cells expressing hTRPV1. Capsaicin (Cap, 1 µM) represents the positive control. (B) Representative I-V curve illustrating that CMEA activates hTRPV1. (C) Concentration-response relationship curve for CMEA activation of hTRPV1 outward current. Currents recorded at +100 mV were normalized to the respective Cap response in each cell. SB-366791 (1 µM) abolished CMEA (120 μM)-induced hTRPV1 currents. *, P < 0.05, SB-366791+CMEA vs. CMEA, n = 12 cells. (D) Representative traces from outside-out recording of TRPV1 single channel gating events recorded at +80 mV in the absence and presence of CMEA (12 μM). (E) Quantification of temporal changes in hTRPV1 channel open probability (Po) after perfusion of the indicated drugs. Data points were binned in 100 ms intervals. (F) Quantification of the hTRPV1 channel Po in the presence of indicated drug treatments. *, P < 0.05, CMEA vs. Veh (0.1% DMSO); #, P < 0.05, SB-366791 + CMEA vs. CMEA, n = 6 cells. (G) Representative trace for proton (pH = 6.5)-induced inward (−100 mV) and outward (+100 mV) hTRPV1 currents in the absence and presence of CMEA (4 μM). Capsaicin (Cap, 1 µM) was used as positive control. (H) Representative I-V curve illustrating that CMEA (4 μM) potentiated proton (pH = 6.5)-induced hTRPV1 currents. (I) Quantification of proton-activated TRPV1 currents recorded at +100 mV in the absence and presence of CMEA. Currents were normalized to the respective capsaicin response in each cell. *, P < 0.05, pH = 6.5 vs. pH = 7.4 (Veh); #, P < 0.05, CMEA (pH = 6.5) vs. CMEA (pH = 7.4); $, P < 0.05, CMEA (pH = 6.5) vs. Veh (pH = 6.5), n = 5 cells. Data points represent the Mean ± SEM.
Fig. 4
Fig. 4. Structure-activity relationship of compounds 1–11 on hTRPV1 channel activity.
(A) Structure of compounds 1–7 purified from CMEA. (B) Activity of compounds 1–7 (30 µM) on hTRPV1 normalized currents. Compounds 2–7 but not compound 1 elicited hTRPV1 currents in HEK-293 cells, which were suppressed by SB-366791 (1 µM). *, P < 0.05, compound vs. Vehicle (Veh, 0.1 % DMSO); #, P < 0.05, SB-366791 + compound vs. compound, n = 6 cells. (C) Representative trace hTRPV1 currents before and after sequential elevation of compound 3 at holding potentials of −100 mV (inward current) and +100 mV (outward current) in HEK-293 cells expressing hTRPV1. Capsaicin (Cap, 1 µM) was used as positive control. (D) Concentration-response relationship curves of compounds 2–7 activation of hTRPV1. Currents recorded at +100 mV were normalized to the respective Cap response in each cell. n = 10 cells. (E) Structures of synthetic analogs of compound 3, (compounds 8–11). (F) Influence of compounds 8–11 on hTRPV1 activity. All hTRPV1 currents were recorded at +100 mV and normalized to the response to Cap. Compounds 8-11 at concentrations up to 100 µM had no effect on hTRPV1 current. n = 6 cells. Data points represent the Mean ± SEM.
Fig. 5
Fig. 5. Molecular model of compound 3 interactions with hTRPV1.
(A) Relative influences of compound 3 on the activity of hTRPV1, oTRPV1 and mutant channels. Substitution of T550 is critical in defining the differential activity of compound 3 towards hTRPV1 and oTRPV1. (B) Potency and efficacy of compound 3 on activation of hTRPV1, oTRPV1 and mutant channels. *, P < 0.05, vs. hTRPV1; #, P < 0.05, vs. oTRPV1. (C) Influence of compound 3 on hTRPV1 and mutant channels. Currents were normalized to those induced by 3 mM 2-APB in the respective cell. Compound 3 up to 100 µM had no effect on Y511A and E570A mutants. (D) Potency and efficacy of compound 3 on activation of hTRPV1 and mutant channels. *, P < 0.05, mutants vs. WT hTRPV1. NR, no response to compound 3 (100 µM). (E) Reconstructed two-dimensional free energy surface (FES, kcal mol−1) based on metadynamics simulations (upper panel) and a close-up view of the optimized compound 3 (green) /rTRPV1 interaction model. The point CV1 indicates the binding mode of compound 3 with the lowest binding free energy. The raw data were obtained by using metadynamics simulations and the free energy surface was generated by Metadynamics Analysis Tool of DESMOND (see methods). Compound 3 is depicted by stick models for emphasis. Red dashed lines indicate hydrogen-bond (H-bond) contacts between the rTRPV1 and compound 3. (F) A close-up view of optimized compound 3/rTRPV1 interaction mode based on metadynamics simulations. Compound 3 (green) and key residues of TRPV1 are depicted by stick models for emphasis. Red dashed lines indicate hydrogen-bond (H-bond) contacts between the rTRPV1 with compound 3. The mainchain oxygen atom of T550, rather than the hydroxyl group, made contacts with compound 3. Data points are the Mean ± SEM (oTRPV1, hTRPV1-E570A, hTRPV1-Y511A groups, n = 5 cells; hTRPV1-S512Y, n = 7 cells; hTRPV1, hTRPV1-T550I, hTRPV1-A566L, n = 8 cells; oTRPV1-I550T group, n = 9 cells). The uneven n number was because of the unsuccessful recordings for some transfected cells.

Similar articles

References

    1. Alexander SP, Mathie A, Peters JA, Veale EL, Striessnig J, Kelly E, et al. (2019). The concise guide to pharmacology 2019/20: Ion channels. British Journal of Pharmacology 176: S142–S228. 10.1111/bph.14749 - DOI - PMC - PubMed
    1. Aprile S, Serafini M, Pirali T (2019). Soft drugs for dermatological applications: recent trends. Drug discovery today 24(12): 2234–2246. 10.1016/j.drudis.2019.08.007 - DOI - PubMed
    1. Arpad S, Cortright D, Blum C, Eid S (2007). The vanilloid receptor TRPV1: 10 years from channel cloning to antagonist proof-of-concept. Nature Reviews Drug Discovery 6(5): 357–372. 10.1038/nrd2280 - DOI - PubMed
    1. Belsito M, Hill RA, Klaassen CD, Liebler D, Marks JG Jr, Ronald C (2012). On the Safety Assessment of Ethanolamides as Used in Cosmetics. Final Amended Report
    1. Cao Z, Hulsizer S, Cui Y, Pretto DL, Kim KH, Hagerman PJ, et al. (2013). Enhanced asynchronous Ca2+ oscillations associated with impaired glutamate transport in cortical astrocytes expressing Fmr1 gene premutation expansion. Journal of Biological Chemistry 288(19): 13831–13841. 10.1074/jbc.M112.441055 - DOI - PMC - PubMed

Publication types