. 2021 Apr 9;12(1):2136.
doi: 10.1038/s41467-021-22402-x.

SLPI is a critical mediator that controls PTH-induced bone formation

Affiliations

SLPI is a critical mediator that controls PTH-induced bone formation

Akito Morimoto et al. Nat Commun. .

Abstract

Osteoclastic bone resorption and osteoblastic bone formation/replenishment are closely coupled in bone metabolism. Anabolic parathyroid hormone (PTH), which is commonly used for treating osteoporosis, shifts the balance from osteoclastic to osteoblastic, although it is unclear how these cells are coordinately regulated by PTH. Here, we identify a serine protease inhibitor, secretory leukocyte protease inhibitor (SLPI), as a critical mediator that is involved in the PTH-mediated shift to the osteoblastic phase. Slpi is highly upregulated in osteoblasts by PTH, while genetic ablation of Slpi severely impairs PTH-induced bone formation. Slpi induction in osteoblasts enhances its differentiation, and increases osteoblast-osteoclast contact, thereby suppressing osteoclastic function. Intravital bone imaging reveals that the PTH-mediated association between osteoblasts and osteoclasts is disrupted in the absence of SLPI. Collectively, these results demonstrate that SLPI regulates the communication between osteoblasts and osteoclasts to promote PTH-induced bone anabolism.


Conflict of interest statement

T.Y. and R.T.-K. are full-time employees of Asahi Kasei Pharma Corporation. The other authors have no conflict of interest.

Figures
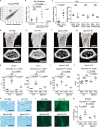
Fig. 1
Fig. 1. Secretory leukocyte protease inhibitor (SLPI) controls the parathyroid hormone (PTH)-induced increase in bone mass.
a RNA-sequencing (RNA-Seq) scatter plot of differential expression between vehicle-treated osteoblasts and intermittent parathyroid hormone (PTH)-treated osteoblasts (log10-transformed fragments per kilobase of transcript per million mapped reads [FPKM]). b mRNA levels of Slpi in 7AAD Lin CD45 ECFP+ osteoblasts as determined by quantitative polymerase chain reaction (qPCR) analysis (n = 4 biologically independent samples per group). c mRNA levels of Slpi as determined by qPCR analysis (n = 5 mice per group for the analysis of MSC, and n = 3 mice per group for the analysis of total BM, Mono/Mφ, and granulocytes). MSC, mesenchymal stem cells (Lin CD45 CD31 Sca1+ CD51+ population); BM, total bone marrow cells; Mono/Mφ, monocyte/macrophage (CD45+ Ly6G+ population); granulocytes (CD45+ Ly6G F4/80+ population). d–g Representative micro-computed tomography images of the femurs. Scale bar, 1000 µm. h Ratio of bone volume to total bone volume (BV/TV), and trabecular thickness (Tb.Th) values (n = 7 mice per group). i Serum type I procollagen N-terminal propeptide (P1NP) levels, as measured by enzyme-linked immunosorbent assay (ELISA) (WT PBS: n = 4 mice, WT PTH: n = 4 mice, Slpi-KO PBS: n = 5 mice, Slpi-KO PTH: n = 4 mice). j Serum type I procollagen C-terminal telopeptide (CTX) levels, as measured by ELISA (WT PBS: n = 8 mice, WT PTH: n = 5 mice, Slpi-KO PBS: n = 7 mice, Slpi-KO PTH: n = 7 mice). k Histological analysis of the proximal tibias. Images are toluidine blue-stained sections (Representative image, n = 3 biologically independent experiments). Scale bars, 500 µm. l Merged image of the calcein band and bright field of the proximal tibias (Representative image, n = 3 biologically independent experiments). Scale bar, 50 µm. m Bone formation rate (BFR/BS) values (WT PBS: n = 6 mice, WT PTH: n = 5 mice, Slpi-KO PBS: n = 6 mice, Slpi-KO PTH: n = 5 mice). For details and statistical analysis, see Table S2. Data are means ± SEM. NS, not significant. Statistical significance was determined by ANOVA with Dunnett’s test (b), Tukey’s test (h, i, j), Šidák’s test (m), and two-tailed Student’s t-test (c). h P1 exact value = 2.8E−7, P2 exact value = 8.5E−12, P3 exact value = 2.8E−9, P4 exact value = 5.1E−6, P5 exact value = 2.0E−10, P6 exact value = 9.5E−8.
Fig. 2
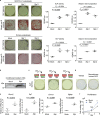
Fig. 2. Induction of Slpi enhances osteoblast differentiation and proliferation.
a Representative images of MC3T3-E1 and primary mouse calvarial osteoblasts transfected with either pMX-Slpi-IRES-puro or pMX-IRES-puro by alkaline phosphatase (ALP) staining (upper) and Alizarin Red S staining (lower) (n = 3 biological replicates per group). β-glycerophosphate was used at a concentration of 10 mM. b, Immunoblot of SLPI in conditioned medium from control MC3T3-E1 and Slpi-overexpressing cells (Representative blot, n = 2 biologically independent experiments). c Typical images of ALP staining of MC3T3-E1 cells. Control (mock) or Slpi overexpressing (Slpi) MC3T3-E1 cells were treated with mock or Slpi conditioned medium under osteogenic conditions for 3 days. d ALP-stained images of MC3T3-E1 cells treated with vehicle or human recombinant SLPI (10 µg/mL) under osteogenic conditions for 3 days. e qPCR analysis of MC3T3-E1 cells transfected with pMX-Slpi-IRES-puro or pMX-IRES-puro (n = 3 biological replicates per group). Cells were cultured in osteogenic differentiation medium for 3 days, and the expression levels of osteoblast transcript regulators (Runx2, Sp7) and differentiation marker genes (Bglap, Col1a1) were quantified. f Proliferation of MC3T3-E1 cells transfected with pMX-Slpi-IRES-puro or pMX-IRES-puro. Cells were cultured in α- MEM for 72 or 120 h after adherence (n = 3 biological replicates per group). **P = 0.0071. Data are means ± SEM. NS, not significant. Statistical significance was determined by ANOVA with Dunnett’s test (a), and two-tailed Student’s t-test (e, f). a P1 approximate value < E−15, P2 approximate value < E−15, P3 approximate value < E−15, and P4 approximate value < E−15.
Fig. 3
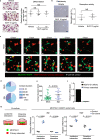
Fig. 3. SLPI is associated with adhesion between osteoblasts and osteoclasts.
a TRAP-stained cells showing the effect of recombinant human SLPI on osteoclastogenesis. Scale bar, 100 µm. Right, numbers of TRAP+ cells (n = 3 biological replicates per group). b Effects of SLPI on the generation of bone resorption pits. Mature osteoclasts were transferred to a Corning Osteoassay Surface in the presence or absence of recombinant human SLPI. After 48 h, cells were removed, and resorption pits were visualized. Scale bar, 200 µm. Right, area of resorption pits (%) (n = 3 biological replicates per group). c Fluorescence images of mock (upper panel) or Slpi-overexpressing (lower panel) MC3T3-E1-EGFP cells in contact with TRAP-tdTomato+ primary osteoclasts (Representative image, n = 3 biologically independent experiments). Confocal fluorescence microscopy images were acquired at 0, 120, 240, 360, and 480 min. White triangles, direct cell–cell contact. Scale bar, 10 µm. d, e Analysis of osteoblast–osteoclast contact duration based on the data in c (Mock: n = 67 cells examined over six independent experiments, Slpi: n = 31 cells examined over 5 independent experiments). f Relative expression levels of Slpi in enhanced green fluorescent protein (EGFP)-labeled MC3T3-E1 cells and tdTomato-labeled osteoclasts. After coculture, MC3T3-E1 cells and osteoclasts were separated (n = 1 experiment per group). g Left, diagrammatic representation of in vitro coculture of osteoclasts with MC3T3-E1-EGFP cells. Right panel shows the effects of coculture on Slpi and Fgf2 expression in MC3T3-E1-EGFP cells (n = 3 biological replicates per group). Data are means ± SEM. NS, not significant. Statistical significance was determined by ANOVA with Dunnett’s test (a), and two-tailed Student’s t-test (b, e, g).
Fig. 4
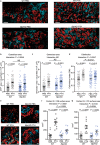
Fig. 4. The PTH-induced direct association between osteoblasts and osteoclasts was disrupted in the absence of SLPI.
a Maximum-intensity projection (MIP) images of skull tissues obtained by intravital microscopy (Representative image, n = 6 biologically independent experiments). Left panel, tiling image of Col2.3-ECFP/TRAP-tdTomato/SlpiWT/WT mice; right panel, image of Col2.3-ECFP/TRAP-tdTomato/SlpiKO/KO mice at 3 weeks after intermittent PBS (upper panel) or PTH (lower panel) treatment. Cyan, mature osteoblasts; red, mature osteoclasts. Scale bar, 200 µm. b Areas of ECFP+ mature osteoblasts per visual field in the tiling image. Cyan+ (mature osteoblast) areas were binarized using Otsu’s thresholding method. c Areas of tdTomato+ mature osteoclasts per visual field in the tiling image. tdTomato+ (mature osteoclast) areas were binarized using Otsu’s thresholding method. d Cell mixture index (CMI) values per visual field in WT mice. bd WT PBS: n = 103 images from six mice, WT PTH: 80 images from five mice, Slpi-KO PBS: 64 images from five mice, Slpi-KO PTH: 93 images from six mice. e, MIP images of 3D colocalization. Left panel, Col2.3-ECFP/TRAP-tdTomato/SlpiWT/WT mice; right panel, Col2.3-ECFP/TRAP-tdTomato/SlpiKO/KO mice, at 3 weeks after intermittent PBS (upper panel) or PTH (lower panel) treatment (Representative image, n = 6 biologically independent experiments). Cyan, mature osteoblasts; red, mature osteoclasts. Contact areas (yellow) were defined as the areas of osteoblast and osteoclast colocalization. Scale bar, 200 µm.Numbers of contacts between osteoblasts and osteoclasts; data were normalized to the surface area of ECFP+ osteoblasts (f), and tdTomato+ osteoclasts (g), respectively (WT PBS: n = 11 mice, WT PTH: 11 mice, Slpi-KO PBS: 16 mice, Slpi-KO PTH: 13 mice). Data are means ± SEM. NS, not significant. Statistical significance was determined by ANOVA with Tukey’s test (b, c, f, g), and by Welch’s ANOVA followed by Bonferroni’s multiple comparisons test (d). b P1 exact value = 3.4E−13, P2 exact value = 9.6E−9. c P3 exact value = 4.3E−13, P4 exact value = 4.9E−5. d P5 approximate value < E−15. f P6 exact value = 2.1E−12, P7 exact value = 4.2E−6. g P8 exact value = 2.5E−7.
Fig. 5
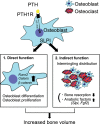
Fig. 5. Model of SLPI functions in bone metabolism.
Parathyroid hormone (PTH) binding to parathyroid hormone 1 receptor (PTH1R) upregulates SLPI expression via the pathways of adenylyl cyclase (AC)/protein kinase A, and Erk. SLPI directly acts in osteoblasts to enhance bone formation by controlling gene expression. Additionally, SLPI promotes the adhesion of osteoblasts to neighboring osteoclasts, thereby increasing direct cell–cell contact. This indirect effect creates a microenvironment in the reversal phase, leading to stimulation of Slpi and Fgf2 expression in osteoblasts, and inhibition of osteoclastic bone resorption.

Similar articles

Cited by

References

    1. Hattner R, Epker BN, Frost HM. Suggested sequential mode of control of changes in cell behaviour in adult bone remodelling. Nature. 1965;206:489–490. doi: 10.1038/206489a0. - DOI - PubMed
    1. Furuya M, et al. Direct cell-cell contact between mature osteoblasts and osteoclasts dynamically controls their functions in vivo. Nat. Commun. 2018;9:300. doi: 10.1038/s41467-017-02541-w. - DOI - PMC - PubMed
    1. Neer RM, et al. Effect of parathyroid hormone (1-34) on fractures and bone mineral density in postmenopausal women with osteoporosis. N. Engl. J. Med. 2001;344:1434–1441. doi: 10.1056/NEJM200105103441904. - DOI - PubMed
    1. Nakamura T, et al. Randomized teriparatide [human parathyroid hormone (PTH) 1-34] once-weekly efficacy research (TOWER) trial for examining the reduction in new vertebral fractures in subjects with primary osteoporosis and high fracture risk. J. Clin. Endocrinol. Metab. 2012;97:3097–3106. doi: 10.1210/jc.2011-3479. - DOI - PubMed
    1. Huang JC, et al. PTH differentially regulates expression of RANKL and OPG. J. Bone Miner. Res. 2004;19:235–244. doi: 10.1359/JBMR.0301226. - DOI - PubMed

Publication types

MeSH terms

Substances