. 2021 May 7;49(8):4613-4628.
doi: 10.1093/nar/gkab244.

Histone deacetylases control lysine acetylation of ribosomal proteins in rice

Affiliations

Histone deacetylases control lysine acetylation of ribosomal proteins in rice

Qiutao Xu et al. Nucleic Acids Res. .

Abstract

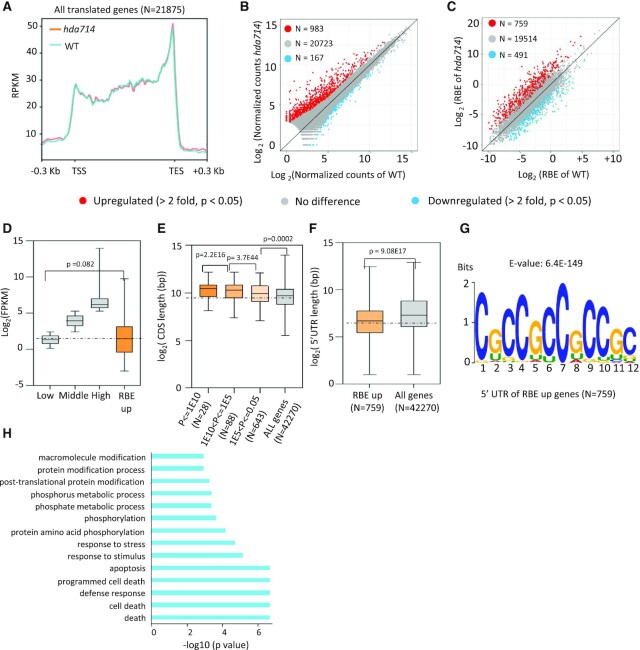
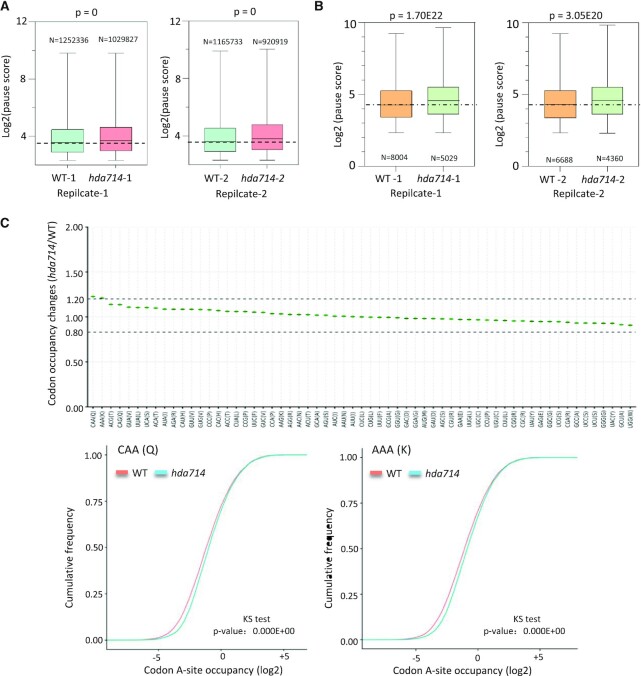
Lysine acetylation (Kac) is well known to occur in histones for chromatin function and epigenetic regulation. In addition to histones, Kac is also detected in a large number of proteins with diverse biological functions. However, Kac function and regulatory mechanism for most proteins are unclear. In this work, we studied mutation effects of rice genes encoding cytoplasm-localized histone deacetylases (HDAC) on protein acetylome and found that the HDAC protein HDA714 was a major deacetylase of the rice non-histone proteins including many ribosomal proteins (r-proteins) and translation factors that were extensively acetylated. HDA714 loss-of-function mutations increased Kac levels but reduced abundance of r-proteins. In vitro and in vivo experiments showed that HDA714 interacted with r-proteins and reduced their Kac. Substitutions of lysine by arginine (depleting Kac) in several r-proteins enhance, while mutations of lysine to glutamine (mimicking Kac) decrease their stability in transient expression system. Ribo-seq analysis revealed that the hda714 mutations resulted in increased ribosome stalling frequency. Collectively, the results uncover Kac as a functional posttranslational modification of r-proteins which is controlled by histone deacetylases, extending the role of Kac in gene expression to protein translational regulation.


Figures

Figure 1.
Figure 1.
Phenotype of hda714 CRISPR/Cas9 mutants. (A) Designed HDA714 sgRNA sequence and position in the locus and the decoded mutations in two lines. (B) Phenotypes of hda714 mutant at germination, seedling and mature stages. Seeds were germinated in air or under submergence (sub) and photographed 3 and 6 days after germination (DAG). (C) Statistics of difference between wild type and hda714–1 germination rates (n = 120) under air or submergence at 3 or 6 DAG, seed setting rates (n = 9) at mature stage (Number of filled grains to total number of reproductive sites and expressed as percentage), and seedling heights (14 days, n = 15). For all the data, the means ± SEM of three independent biological replicates was shown. Significance of differences were analyzed using the two-tail Student's t-test (E is *10x).
Figure 2.
Figure 2.
Relative protein lysine acetylation levels in hda705, hda706 and hda714 compared with wild type. (A) Heatmap of relative lysine acetylation levels in two replicates of hda705, hda706, hda714 and wild type. (BD) Scattering plots of acetylation levels at individual Kac sites between wild type and the mutants. Significantly up and downregulated sites (>1.5-fold) in the mutants are indicated by red and green respectively. Up regulated (1–1.5-fold) and down regulated (1–1.5-fold) are indicated by light blue and tan respectively. (E) Numbers of Kac sites and proteins that were significantly up and downregulated (>1.5-fold) in hda705, hda706 and hda714 compared with wild type.
Figure 3.
Figure 3.
HDA714 loss-of-function resulted in increases of lysine acetylation of translational proteins. Relative acetylation levels at individual Kac sites of ribosomal proteins (A) and translational initiation and elongation factors (B) in hda705, hda706 and hda714 compared with wild type. (C) Analysis of Kac levels of ribosomal proteins isolated from hda714–1 (two biological replicates) and wild type (two biological replicates) plants by immunoblotting using anti-LysAc antibody. Coomassie staining and immunoblotting with anti-RPS3 antibody were used as loading control. Two replicates are shown. (D) In vitro r-protein deacetylation assays. Ribosomal proteins isolated from wild type plants were incubated with E. coli-produced GST-HDA714 protein (with or without addition of sodium butyrate) followed by immunoblotting using anti-LysAc antibody. Coomassie staining was used as loading control. Two independent replicates are shown. (E) In vitro deacetylation assays of RPS3 and RPS6. E. coli-produced His-tagged RPS3 and RPS6 proteins were incubated with (+) or without (−) GST-tagged-HDA714 in the deacetylation butter and analyzed by western blots with anti-RPS3, RPS6, and anti-LysAc (acetylated lysine residues). Replicates are shown. (F) Effect of HDA714 loss- or gain-of-function on Kac on RPS3 and RPS6 in vivo in rice plants. RPS3 and RPS6 were immunoprecipitated from HDA714 mutants (hda714–1, hda714–2), overexpression (OE1, OE2) and wild type plants (WT1, WT2) by anti-RPS3 or anti-RPS6 and analyzed by immuno-blots using the indicated antibodies. Two replicates are shown. Band intensities in (E) and (F) were measured using ImageJ with those WT1 set at 1.
Figure 4.
Figure 4.
In vivo protein interaction between HDA714 and ribosomal and IF proteins. (A) Tobacco leaves co-infiltrated with Agrobacterium containing 35S-driven split luciferase (LUC) constructs as indicated were photographed with a charge-coupled device camera. BiFC visualization showing that interaction between HDA714-Nluc and tested proteins (RPS16-cLUC, RPS3-cLUC, eIF2α-cLUC) in the N. benthamiana epidermal cells was observed. For the negative controls (nLUC + cLUC, HDA714-nLUC+cLUC, RPS6-cLUC+nLUC, RPS3-cLUC+nLUC, and eIF2α-cLUC+nLUC, HDA714-nLUC+WOX11-cLUC) no interaction was observed. eIF2α: eukaryotic translation initiation factor 2 alpha subunit. WOX11: WUSCHEL-RELATED HOMEOBOX11 (WOX11) as a negative control. (B) Coimmunoprecipitation assay for the interaction between HDA714 and RPS3, RPS6 or RPL7a in vivo. Total proteins from N. benthamiana leaves co-expressing RPS3-, RPS6- or RPL7a-FLAG and HDA714-GFP were immunoprecipitated using anti-GFP agarose. The agarose-bound proteins were eluted and detected by immunoblotting using anti-GFP or anti-FLAG antibodies. IP, immunoprecipitation. (C) Tests of in vivo interaction between HDA714 and RPS3 and RPS6 in rice plants. Proteins extracted from wild type rice plants were precipitated with IgG or anti-HDA714 and analyzed by immunoblots with anti-RPS3, anti-RPS6 and anti-HDA714. IP, immunoprecipitation.
Figure 5.
Figure 5.
The hda714 mutation led to decreases of ribosomal proteins levels. (A) Box plots of abundance of ribosomal proteins detected in the hda714 and wild type proteomic data. (B) Box plots of acetylation levels of ribosomal proteins in hda714 and wild type plants. Horizontal lines in the boxes in (A) and (B) are medians; box limits indicate the 25th and 75th percentiles; whiskers extend to 5th and 95th percentiles. Significance of differences between wild type and the mutant indicated in the figures were analyzed using the two-tail Student's t-test (E is *10x). (C) Scattering plots of ribosomal proteins and acetylation changes in hda714 versus wild type. Correlation coefficients are indicated. (D) Ribosomal proteins (K and K to Q or R) were fused with the GFP tag and expressed in N. benthamiana by agroinfiltration. The transfected N. benthamiana were treated with cycloheximide (CHX) plus or minus MG132, and harvested at the indicated time points. Total protein was analyzed by Western blots with anti-GFP. Immunoblotting results were quantified using ImageJ (v1.6.0_24). Values in R mutations at 0 h are set as 1.
Figure 6.
Figure 6.
The hda714 mutation increased ribosomal binding frequency and characteristics of upregulated RBE mRNAs in the mutant. (A) Genome-wide metagene analysis of ribosomal footprinting density in gene coding region in wild type (blue) and hda714 (orange). RPKM: Reads Per Kilobase per Million mapped reads; TSS: translation start site; TES: translation end site. (B) Numbers of upregulated and downregulated (>2-fold, P < 0.05) genes detected by Ribo-seq in hda714 versus wild type. (C) Comparison of ribosome binding efficiency (RBE, Ribo-seq reads/RNA-seq reads) between wild type and hda714. Numbers of genes (mRNA) with higher or lower (>2-fold, P < 0.05) RBE are indicated. (D) Expression level analysis of genes with upregulated RBE compared with genome-wide gene expression levels which was divided into 3 intervals: the highest 25% (TPM > 39.33), the lowest 25% (1 ≤ TPM ≤ 5.8) and the middle (25–75%) (5.18 < TPM ≤ 39.3). Genes with TPM <1 were considered as unexpressed and were not included here. TPM: transcripts per kilobase of exon model per million mapped reads. Significance of differences was analyzed using the two-tail Student's t-test. For boxplots, horizontal lines show medians; box limits indicate the 25th and 75th percentiles. (E, F) Comparison of coding region and 5′ UTR (untranslated region) lengths between the genes with upregulated RBE in hda714 and all rice genes. CDS lengths are negatively correlated with p values of RBE up genes (E). Significance of differences was analyzed using the two-tail Student's t-test (E is *10x). For boxplots, horizontal lines show medians; box limits indicate the 25th and 75th percentiles. (G) MEME motif of 5′UTR of genes with upregulated RBE in the mutant. E is *10x. (H) GO pathway enrichment analysis of RBE up genes (N = 759).
Figure 7.
Figure 7.
Ribosomal pause score analysis in hda714 and wild type. (A) Overall ribosome pause scores in wild type and hda714. (B) Higher pause scores in hda714 upregulated RBE (N = 759) genes. Two replicates are shown in (A) and (B). Significances of differences were analyzed using the two-tail Student t test. For boxplots, horizontal lines show medians; box limits indicate the 25th and 75th percentiles. E is *10x. (C) RiboToolkit analysis showed significant ribosome pausing at CAA (Gln) and AAA (Lys) codons in hda714 mutants in comparison to wild types (WT). Upper part: Codon occupancy changes between hda714 mutant and wild type. Lower part: Cumulative occupancy distribution of CAA (Q) and AAA (K) codons. P-values are from a one-sample Kolmogorov–Smirnov test.

Similar articles

Cited by

References

    1. Verdin E., Ott M.. 50 years of protein acetylation: from gene regulation to epigenetics, metabolism and beyond. Nat. Rev. Mol. Cell Biol. 2015; 16:258–264. - PubMed
    1. Narita T., Weinert B.T., Choudhary C.. Functions and mechanisms of non-histone protein acetylation. Nat. Rev. Mol. Cell Biol. 2019; 20:156–174. - PubMed
    1. Guan K.L., Xiong Y.. Regulation of intermediary metabolism by protein acetylation. Trends Biochem. Sci. 2011; 36:108–116. - PMC - PubMed
    1. Choudhary C., Kumar C., Gnad F., Nielsen M.L., Rehman M., Walther T.C., Olsen J.V., Mann M.. Lysine acetylation targets protein complexes and co-regulates major cellular functions. Science. 2009; 325:834–840. - PubMed
    1. Shen Y., Wei W., Zhou D.X.. Histone acetylation enzymes coordinate metabolism and gene expression. Trends Plant Sci. 2015; 20:614–621. - PubMed

Publication types

MeSH terms