. 2021 Apr 6;12(4):348.
doi: 10.1038/s41419-021-03631-w.

C3G downregulation induces the acquisition of a mesenchymal phenotype that enhances aggressiveness of glioblastoma cells

Affiliations

C3G downregulation induces the acquisition of a mesenchymal phenotype that enhances aggressiveness of glioblastoma cells

Sara Manzano et al. Cell Death Dis. .

Abstract

Glioblastoma (GBM) is the most aggressive tumor from the central nervous system (CNS). The current lack of efficient therapies makes essential to find new treatment strategies. C3G, a guanine nucleotide exchange factor for some Ras proteins, plays a dual role in cancer, but its function in GBM remains unknown. Database analyses revealed a reduced C3G mRNA expression in GBM patient samples. C3G protein levels were also decreased in a panel of human GBM cell lines as compared to astrocytes. Based on this, we characterized C3G function in GBM using in vitro and in vivo human GBM models. We report here that C3G downregulation promoted the acquisition of a more mesenchymal phenotype that enhanced the migratory and invasive capacity of GBM cells. This facilitates foci formation in anchorage-dependent and -independent growth assays and the generation of larger tumors in xenografts and chick chorioallantoic membrane (CAM) assays, but with a lower cell density, as proliferation was reduced. Mechanistically, C3G knock-down impairs EGFR signaling by reducing cell surface EGFR through recycling inhibition, while upregulating the activation of several other receptor tyrosine kinases (RTKs) that might promote invasion. In particular, FGF2, likely acting through FGFR1, promoted invasion of C3G-silenced GBM cells. Moreover, ERKs mediate this invasiveness, both in response to FGF2- and serum-induced chemoattraction. In conclusion, our data show the distinct dependency of GBM tumors on C3G for EGF/EGFR signaling versus other RTKs, suggesting that assessing C3G levels may discriminate GBM patient responders to different RTK inhibition protocols. Hence, patients with a low C3G expression might not respond to EGFR inhibitors.


Conflict of interest statement

The authors declare no competing interests.

Figures

Fig. 1
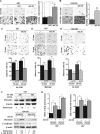
Fig. 1. C3G is downregulated in GBM promoting changes in cell morphology.
A C3G (RAPGEF1) mRNA levels in GBM patients and normal brain (171 patients) obtained from TCGA database normalized with GUSB. B Western-blot analysis of C3G and Vimentin protein levels in the indicated GBM cell lines and human astrocytes (HAs) normalized to β-actin. Densitometric quantification of C3G/β-actin and Vimentin/β-actin ratios are shown. C, G Western-blot analysis of C3G normalized to β-actin to confirm silencing in U87 and 12Ф12D cells as compared to parental cells and/or cells with control shRNA (NTC). Densitometric quantification of C3G/β-actin ratio is shown. D Phase-contrast microscopy images of parental U87, U87shC3G and NTC cells maintained either in the presence (10% FBS) or absence (0% FBS) of serum for 24 h. Scale bars: 50 µm. E Representative images of β-catenin (red) and DAPI (blue) staining analyzed by confocal microscopy. Scale bars: 25 µm. F and H Left panels, immuno-fluorescence microscopy images of phalloidin staining (red) in parental and C3G-silenced U87 and 12Ф12D cells, maintained as indicated. Cell nuclei were stained with DAPI (blue). Scale bars: 50 µm. An amplification of cells inside the square is also shown. Right panels, histograms showing the quantification of the number of cells presenting migratory structures (filopodia, blebs, stress fibers and/or lamellipodia) expressed as fold increase.
Fig. 2
Fig. 2. C3G downregulation enhances invasion of GBM cells promoting the expression of mesenchymal markers.
Non-silenced or C3G-silenced (shC3G) U87 and 12Ф12D cells, and U87 cells with control shRNA (NTC) have been used. A and B Invasion through Matrigel of U87 and 12Ф12D cells (respectively) using FBS as chemoattractant (10%). Left panels, representative images of invading cells; right panels, histograms showing the mean value ± S.E.M. of the number of invading cells (n = 3). CE Adhesion analysis at 15 or 30 min in U87 and 12Ф12D cells. Top panels, phase contrast microscopy representative images of adhered U87 cells on uncoated dishes (no ECM) or coated with Matrigel; lower panels, histograms showing mean value ± S.E.M. of the percentage of adhered cells referred to non-silenced cells at 15 min (n = 3). *p ≤ 0.05, **p ≤ 0.01 and ***p ≤ 0.001, compared as indicated. Scale bars (AE): 100 µm. F Representative western-blot analyses of Vimentin and E-cadherin levels normalized to β-actin in U87 (upper panel) and 12Ф12D cells (lower panel) treated as indicated (n = 3). G TWIST1 and ZEB2 mRNA levels in U87 cells maintained either in the presence (+) or absence (−) of serum. Histograms represent RQ mean value ± S.E.M. referred to parental cells maintained with 10% FBS (n = 2–4). *p ≤ 0.05, compared as indicated.
Fig. 3
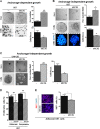
Fig. 3. Effect of C3G silencing on tumorigenic and proliferative properties of GBM cells.
Non-silenced or C3G-silenced (shC3G) U87 and/or 12Ф12D cells have been used. A Anchorage-dependent growth assay in U87 cells. Left panel, representative phase-contrast microscopy images of a macroscopic view of foci (upper images) and an individual focus (lower images); right panel, histogram showing the mean value ± S.E.M. of the total foci number (upper panel) or number of cells per focus (lower panel) (n = 5). B and C Anchorage-independent growth assays in U87 and 12Ф12D cells. Left panels, representative phase-contrast microscopy images of a macroscopic view of foci (upper images), cell organization in an individual focus (middle (B) or lower (C) images) and nuclei staining with DAPI (blue) (B lower panels). Dashed line indicates that DAPI stained nuclei images correspond to an independent experiment. Right panels, histograms showing the mean value ± S.E.M. of the foci number per field (upper) or number of cells per focus (lower) (n = 3–4). (D) Cell cycle analysis by cytometry of cells maintained in the presence of 10% FBS under adherent or non-adherent conditions (6 h). Histogram represents the percentage of cells in S and G2/M phases of cell cycle ± S.E.M. (n = 2–6). *p ≤ 0.05, **p ≤ 0.01, ***p ≤ 0.001, C3G silenced as compared to non-silenced cells under the same experimental condition. (E) Ki67 (red) staining in adhered U87 cells. Nuclei were stained with DAPI (blue). Left panel, representative microscope images; right panel, histogram showing the mean value ± S.E.M. of the percentage of Ki67 positive cells (n = 3). *p ≤ 0.05 as compared to non-silenced cells. Scale bars: 100 µm (A, B, C and E).
Fig. 4
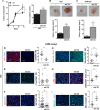
Fig. 4. Effect of C3G knock-down on in vivo tumor growth.
A Xenograft assay using U87 cells. Left panel, graphic showing the mean value of tumor area along the time (0–15 days) ± S.E.M. (two independent experiments, 5 mice/each); right panel, histogram represents the mean value of tumor volume ± S.E.M. at the end-point (15 days). B CAM assays using U87 and 12Ф12D cells. Top panels, representative tumors at the end point (7 days); lower panels, histogram represents the mean value of tumor volume ± S.E.M. (three independent experiments, total number of chick embryos 13) at the end point. DI Immunofluorescence microscopy analysis in tumors generated by U87 cells in CAM assays of (D) C3G (red), E cleaved caspase 3 (cCasp3 (green)), F Ki67 (green), G Vimentin (green), H α-Smooth muscle actin (α-SMA (red)) and I MECA 32 (green). Cell nuclei were stained with DAPI (blue). Left panels, representative images; right panels, graphs represent integrated density mean values normalized with DAPI-positive area ± S.E.M. (n = 3). **p ≤ 0.01, compared as indicated. Scale bars: 100 µm.
Fig. 5
Fig. 5. Effect of C3G knock-down on EGFR activity and membrane localization.
U87 and U87shC3G cells were used. A Representative western-blot analysis of phosphorylated and total levels of EGFR, ERKs, p38MAPK, and Akt proteins normalized to β-actin. Densitometric quantification of these proteins versus β-actin expressed as the fold increase of the value of untreated cells from the corresponding genotype (non-silenced and C3G silenced) (n = 3). Untreated shC3G versus non-silenced cells ratios are: P-EGFR/β-actin = 1, P-Akt/β-actin = 2, P-ERKs/β-actin = 1.6, P-p38MAPK/β-actin = 2.6. Serum-starved cells (for 16 h) were stimulated with EGF for 5–60 min or maintained untreated. B Invasion through Matrigel in response to EGF. Upper panel, representative phase contrast microscopy images of invading cells; lower panel, histogram showing the mean value ± S.E.M. of the total number of invading cells (n = 3). Scale bars: 100 µm. C Top panel, representative fluorescence microscopy images of EGFR endocytosis mediated by EGF labeled with Alexa 488 (EGF-A488, green) at different time points; lower panel, graph represents fluorescence integrated density (ID) mean values ± S.E.M. (n = 5–6). Scale bars: 50 µm. D and E Flow cytometric analysis of cell surface EGFR levels. D Cells were maintained in the presence (10% FBS) or absence of serum (0% FBS). E Cells were treated with EGF for 2 h to induce endocytosis or maintained untreated. Histograms show the percentage of cells presenting EGFR in the membrane (mean value ± S.E.M. (n = 6)). *p ≤ 0.05 and **p ≤ 0.01, compared as indicated. F Effect of recycling inhibition on cell surface EGFR levels analyzed by flow cytometry. Cells were maintained untreated or treated with monensin (Mon) (10 μM, 1 h), EGF (2 h) or both (EGF + Mon). Histogram showing the mean value ± S.E.M. of the percentage of cells presenting EGFR in the membrane (n = 3). **p ≤ 0.01 and ***p ≤ 0.001, compared as indicated.
Fig. 6
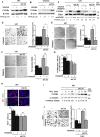
Fig. 6. C3G downregulation increases the phosphorylation of FGFR1 and other RTKs, promoting cell invasion.
A Heatmap represents the relative phosphorylation levels of 27 RTKs present in the proteome profiler human phospho-RTK array. For each receptor, the mean value of the densitometric quantification of C3G silenced cells values as compared to parental cells (n = 2). B FGF2-induced invasion. Cells seeded in the upper chamber of transwells were maintained in the absence of serum and were treated with FGF2. Left panel, representative phase contrast microscopy images of invading cells; right panel, histogram showing the mean value ± S.E.M. of the total number of invading cells (n = 3). *p ≤ 0.05 and **p ≤ 0.01, compared as indicated. Scale bars: 100 µm. C Effect of infigratinib on invasion using serum (10%) as chemoattractant. Left panels, representative phase contrast microscopy images of invading cells; right panel, histogram showing the mean value ± S.E.M. of the total number of invading cells (n = 3). **p ≤ 0.01 and ***p ≤ 0.001, compared as indicated. Scale bars: 100 µm.
Fig. 7
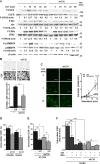
Fig. 7. C3G downregulation enhances ERKs activation in response to serum and FGF2, promoting invasion.
AC Representative western-blot analysis of phosphorylated ERKs levels normalized with β-actin in U87/U87shC3G cells (A and C) and 12Ф12D/12Ф12DshC3G cells. B Serum-deprived cells were maintained untreated (−) or treated (+) with 10% FBS (FBS) for 10 min, either in the presence or absence of PD98059, as indicated. Densitometric analysis of P-ERKs/β-actin (A, B) or P-ERKs/α-Tubulin (C) ratio expressed as the fold increase of the value of untreated cells from the corresponding genotype (non-silenced and C3G silenced) (n = 3). D Invasion through Matrigel using 10% FBS as chemoattractant. Left panel, representative phase contrast microscopy images of invading cells untreated or treated with PD98059; right panel, histogram showing the mean value ± S.E.M. of the number of invading cells (n = 3). *p ≤ 0.05, **p ≤ 0.01, C3G-silenced versus non-silenced cells or compared as indicated. E Anchorage-dependent growth assay in the presence or absence of PD98059. Left panel, representative macroscopic images of foci; right panel, histogram showing the mean value ± S.E.M. of foci number (n = 3). *p ≤ 0.05, C3G silenced versus non-silenced cells or compared as indicated. F Anchorage-independent growth assay in cells maintained untreated or treated with PD98059. Left panel, representative images of a microscopic view of foci; right panel, histogram showing the mean value ± S.E.M. of the total foci number per field (n = 4). ***p ≤ 0.001, C3G silenced versus non-silenced cells or compared as indicated. G Cell cycle analysis by flow cytometry. Histogram represents the percentage of cells in S and G2/M phases of cell cycle ± S.E.M. (n = 3). *p ≤ 0.05, C3G silenced versus non-silenced cells or compared as indicated. H Immunofluorescence analysis of Ki67 (red)/DAPI (blue) staining. Upper panel, representative images; lower panel, histogram showing the percentage of Ki67 positive cells (mean value ± S.E.M.). I Representative western-blot analysis of P-ERKs levels in response to FGF2 stimulation (5–10 min) normalized to β-actin. Densitometric analysis of P-ERKs/α-tubulin ratio expressed as the fold increase of the value of untreated cells from the corresponding genotype (non-silenced and C3G silenced) (n = 3). J Invasion through Matrigel in response to FGF2 in the absence and presence of PD98059. ***p ≤ 0.001, compared as indicated. Scale bars: 100 µm.
Fig. 8
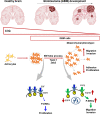
Fig. 8. Graphical abstract showing the function of C3G in glioblastoma.
C3G levels are high in healthy brain and decrease in glioblastoma (GBM) cells and patient samples. This C3G downregulation enhances migration and invasion of GBM cells by mechanisms that depend on hyperactivation of RTKs such as FGFR1 acting through ERKs. In contrast, EGFR activity is down-regulated due to its low presence at the cell surface.

Similar articles

Cited by

References

    1. Tanaka S, et al. C3G, a guanine nucleotide-releasing protein expressed ubiquitously, binds to the Src homology 3 domains of CRK and GRB2/ASH proteins. Proc. Natl Acad. Sci. USA. 1994;91:3443–3447. doi: 10.1073/pnas.91.8.3443. - DOI - PMC - PubMed
    1. Ohba Y, et al. Requirement for C3G-dependent Rap1 activation for cell adhesion and embryogenesis. EMBO J. 2001;20:3333–3341. doi: 10.1093/emboj/20.13.3333. - DOI - PMC - PubMed
    1. Gotoh T, et al. Identification of Rap1 as a target for the Crk SH3 domain-binding guanine nucleotide-releasing factor C3G. Mol. Cell Biol. 1995;15:6746–6753. doi: 10.1128/MCB.15.12.6746. - DOI - PMC - PubMed
    1. Radha V, Mitra A, Dayma K, Sasikumar K. Signalling to actin: role of C3G, a multitasking guanine-nucleotide-exchange factor. Biosci. Rep. 2011;31:231–244. doi: 10.1042/BSR20100094. - DOI - PubMed
    1. Guerrero C, et al. Transformation suppressor activity of C3G is independent of its CDC25-homology domain. Oncogene. 1998;16:613–624. doi: 10.1038/sj.onc.1201569. - DOI - PubMed

Publication types

MeSH terms

Substances