Case Reports
. 2021 May 19;41(20):4378-4391.
doi: 10.1523/JNEUROSCI.2537-20.2021. Epub 2021 Apr 6.

New Tmc1 Deafness Mutations Impact Mechanotransduction in Auditory Hair Cells

Affiliations
Case Reports

New Tmc1 Deafness Mutations Impact Mechanotransduction in Auditory Hair Cells

Maryline Beurg et al. J Neurosci. .

Abstract

Transmembrane channel-like protein isoform 1 (TMC1) is a major component of the mechano-electrical transducer (MET) channel in cochlear hair cells and is subject to numerous mutations causing deafness. We report a new dominant human deafness mutation, TMC1 p.T422K, and have characterized the homologous mouse mutant, Tmc1 p.T416K, which caused deafness and outer hair cell (OHC) loss by the fourth postnatal week. MET channels showed decreased Ca2+ permeability and resting open probability, but no change in single-channel conductance or expression. Three adjacent deafness mutations are TMC1 p.L416R, p.G417R, and p.M418K, the last homologous to the mouse Beethoven that exhibits similar channel effects. All substitute a positive for a neutral residue, which could produce charge screening in the channel pore or influence binding of an accessory subunit. Channel properties were compared in mice of both sexes between dominant (Tmc1 p.T416K, Tmc1 p.D569N) and recessive (Tmc1 p.W554L, Tmc1 p.D528N) mutations of residues near the putative pore of the channel. Tmc1 p.W554L and p.D569N exhibit reduced maximum current with no effect on single-channel conductance, implying a smaller number of channels transported to the stereociliary tips; this may stem from impaired TMC1 binding to LHFPL5. Tmc1 p.D528N, located in the pore's narrowest region, uniquely caused large reductions in MET channel conductance and block by dihydrostreptomycin (DHS). For Tmc1 p.T416K and Tmc1 p.D528N, transduction loss occurred between P15 and P20. We propose two mechanisms linking channel mutations and deafness: decreased Ca2+ permeability, common to all mutants, and decreased resting open probability in low Ca2+, confined to dominant mutations.SIGNIFICANCE STATEMENT Transmembrane channel-like protein isoform 1 (TMC1) is thought to be a major component of the mechanotransducer channel in auditory hair cells, but the protein organization and channel structure are still uncertain. We made four mouse lines harboring Tmc1 point mutations that alter channel properties, causing hair cell degeneration and deafness. These include a mouse homolog of a new human deafness mutation pT416K that decreased channel Ca2+ permeability by introducing a positively-charged amino acid in the putative pore. All mutations are consistent with the channel structure predicted from modeling, but only one, p.D528N near the external face of the pore, substantially reduced channel conductance and Ca2+ permeability and virtually abolished block by dihydrostreptomycin (DHS), strongly endorsing its siting within the pore.

Keywords: Hair cell; TMC1; cochlea; deafness; mechanotransduction channel.


Figures

Figure 1.
Figure 1.
Genotype and phenotype of family. A, Audiogram of the proband (top graph with filled in black markers), father (middle graph with filled in gray markers), grandmother (bottom graph with unfilled markers). Three time points are indicated (T1, rectangle; T2, diamond; T3, circle) for each individual. Each point on the graph is the average hearing threshold from the right and left ear. The proband was five years old at T1 and shows normal hearing at 0.5, 1, 2, and 4 kHz. At the second evaluation (T2), the patient was 11 years old and shows normal hearing from 0.25 to 1 kHz with hearing loss starting at 1.5 kHz. At T3, the patient was 14 years old and illustrates profound to severe hearing loss at all of the frequencies. The father shows moderate to profound hearing loss at all time points. Father was 37 years old at T1, 38 years old at T2, and 39 years old at T3. The grandmother also shows moderate to profound hearing loss at all frequencies. Her age was 57 years old at T1 and 58 years old at T2 and T3. B, Pedigree of the family indicating autosomal dominant transmission pattern. Circles are indicative of a female and squares of a male. An individual with a filled in blue corner indicates that they report some degree of hearing loss. C, DNA sequencing data for unaffected brother. D, DNA sequencing data for father III-1 and grandmother II-1 both with hearing loss.
Figure 2.
Figure 2.
Auditory phenotype of mouse Tmc1 p.T416K; Tmc2+/+. A, Fixed whole mounts of mid-region of cochleas of P30 Tmc1+/+ (top row) and Tmc1 p.T416K/+ (bottom row) labeled with phalloidin (Actin), calbindin28K (cell somas) and merge. Note OHC loss in mutant. B, ABRs thresholds of P30 wild-type, Tmc1 p.T416K/T416K homozygote, and Tmc1 p.T416K/+ heterozygote showing dominant phenotype. C, DPOAEs thresholds for Tmc1+/+ (black symbols, N = 6) and Tmc1 p.T416K/+ (red symbols, N = 8). D, Hair cell survival in P30 Tmc1 p.T416K/+ heterozygote. For each cell type, ∼100 cells along the cochlea were included in the count to construct average. In each panel, the mean +/− SD is plotted.
Figure 3.
Figure 3.
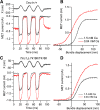
MET currents of apical OHCs for control and p.T416K mutant mice. A, MET currents in response to bundle vibration in Tmc1+/+; Tmc2−/− in saline containing 1.5 mm Ca2+ (black, gray before and after) and endolymph-like 0.04 mm Ca2+ (red); top trace is driving voltage to piezo (smooth curve) superimposed on photodiode signal (noisy gray trace). B, Current-displacement relations evaluated from responses in A for 1.5 mm Ca2+ (black) and 0.04 mm Ca2+ (red). Lowering external Ca2+ increased maximum current IMAX and fraction on at rest. Dashed curves are fits of current I against displacement x to Boltzmann equation: I = IMAX/[1 + exp((x1 – x)/a)], where IMAX = 1.0 nA, a = 9.8 nm, x1 = 29 nm (1.5 Ca2+) and IMAX = 1.43 nA, a = 21 nm, x1 = 6.9 nm (0.04 Ca2+). C, MET currents in response to bundle vibration in Tmc1 p.T416K/T416K; Tmc2−/− mice in saline containing 1.5 mm Ca2+ (black, gray before and after) and endolymph-like 0.04 mm Ca2+ (red); top trace is driving voltage to piezo (smooth curve) superimposed on photodiode signal (noisy gray trace). D, Current-displacement relations evaluated from responses in C for 1.5 mm Ca2+ (black) and 0.04 mm Ca2+ (red). Dashed curves are fits to Boltzmann equation, where IMAX = 0.98 nA, a = 10.4 nm, x1 = 23 nm (1.5 Ca2+) and IMAX = 1.56 nA, a = 14.7 nm, x1 = 23.6 nm (0.04 Ca2+). Note that in mutant, low Ca2+ still increases maximum current but has smaller effect on resting open probability, and no effect on x1, i.e., no shift in the activation curve; holding potential −84 mV. The difference in resting open probability between control, and mutant was not seen in 1.5 mm extracellular Ca2+ (see text).
Figure 4.
Figure 4.
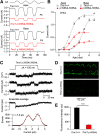
MET currents in IHCs of control and p.T416K mutant mice. A, MET current for Tmc1+/+; Tmc2−/− in response to sinusoidal motion of hair bundle. B, MET current for Tmc1 p.T416K/T416K; Tmc2−/−. C, Collected results of MET current amplitudes in five control (black) and five p.T416K/T416K mutant (red) P8 IHCs. For AC, holding potential −84 mV. D, Hair cell fluorescence in unfixed cochleas of P30 mice indicating FM1-43 entry in apical hair cells of Tmc1+/+; Tmc2−/− (top), and Tmc1 p.T416K/T416K; Tmc2−/− mice in the absence (middle) and presence (bottom) of 0.1 mm d-tubocurarine (curare) to block MET channels. In the mutant, OHCs are shrunken and some are missing. E, Collected results showing the fluorescence intensity (au) in 36 IHCs and 40 OHCs in two preparations. Tmc1+/+ and Tmc1 p.T416K were significantly different (***p < 0.001) for IHCs and OHCs but Tmc1 p.T416K with and without d-tubocurarine were not significantly different (p = 0.28 IHCs, p = 0.18 OHCs). Results indicate functional channels that can be blocked by curare in Tmc1+/+ but not Tmc1 p.T416K. In panels C and E, bars denote mean +/− SD.
Figure 5.
Figure 5.
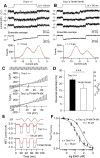
Ionic properties of MET channels from apical OHCs of Tmc1 p.T416K/T416K; Tmc2−/−. A, Three examples of single MET channel currents for Tmc1+/+; Tmc2−/−, ensemble average of 30 presentations (middle) and amplitude histogram (bottom) giving −7.0 pA at –84 mV. C and O indicate closed and open states of channel. B, Examples of single MET channel currents for Tmc1 p.T416K/T416K; Tmc2−/−, ensemble average of 100 presentations (middle) and amplitude histogram (bottom) giving −7.0 pA at −84 mV. C, Determination of MET channel Ca2+ permeability in isotonic external Ca2+ and internal Cs+ (see Materials and Methods). During a sinusoidal bundle vibration (ΔX, ±200 nm), the membrane potential (Vm) was swept from −30 to +80 mV and the MET current reversed polarity at arrowed potential. Reversal potential in Tmc1+/+; Tmc2−/− is ∼7 mV positive to that in Tmc1 p.T416K/T416K; Tmc2−/−. D, Collected reversal potentials and relative permeability PCa/PCs in six cells mean +/− SD. Control and mutant are significantly different (t test, ***p < 0.001). E, MET currents for bundle vibrations (ΔX, ±200 nm) in normal saline (black traces) and in presence of 100 μm DHS in Tmc1+/+; Tmc2−/− (top) and Tmc1 p.T416K/T416K; Tmc2−/− (bottom). F, Mean ± SD (N = 5) of MET current block by DHS in Tmc1+/+ and Tmc1 p.T416K/T416K. Hill plots give KI = 15 μm (all points) and 66.0 μm, respectively, with Hill coefficients = 1 for both genotypes. For control curve, open symbols determined using bundle stimulation with a fluid et (KI = 14.0 μm), whereas crosses obtained with a stiff glass probe (KI = 15.4 μm). The similar KI values for the different jstimulation methods rules out artifacts because of dilution of DHS by saline in the fluid jet.
Figure 6.
Figure 6.
Deafness phenotypes in Tmc1 p.D528N and Tmc1 p.W554L. A, Fixed whole mounts of mid-region of cochleae of P30 Tmc1+/+ (top row) and Tmc1 p.D528N/D528N (bottom row) labeled with phalloidin (actin), calbindin28K (cell somas) and merge. Note absence of IHCs and loss of OHCs, and shape changes to OHC hair bundle in mutant. B, Mean ABR thresholds for four P30 mice in wild-type Tmc1+/+, Tmc1 p.D528N/+, and Tmc1 p.D528N/D528N; Tmc2+/+ mice. The similarity of wild type and heterozygote indicates recessive mutation. C, Survival of IHC and OHC (rows 1, 2, and 3) in four P30 mice in Tmc1 p.D528N/D528N; Tmc2+/+ mice. D, ABR thresholds for four P30 mice in wild-type Tmc1+/+, Tmc1 p.W554L/+ at P30 and Tmc1 p.W554L/W554L at P30 and P60 (all on Tmc2+/+ background). This mutation is recessive too. E, Survival of IHC and OHCs in four P30 mice in Tmc1 p.W554L/W554L; Tmc2+/+ mice at P30 and P60. At P60, only OHCs are missing.
Figure 7.
Figure 7.
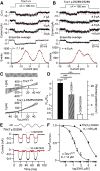
Ionic properties of MET channels from apical OHCs of Tmc1 p.D528N/D528N; Tmc2−/−. A, Three examples of single MET channel currents for Tmc1+/+; Tmc2−/−, ensemble average of 50 presentations (middle) and amplitude histogram (bottom) giving −7.1 pA at −84 mV. B, Examples of single MET channel currents for Tmc1 p.D528N/D528N; Tmc2−/−, ensemble average of 30 presentations (middle) and amplitude histogram (bottom) giving −4.6 pA at −84 mV, significantly smaller than control (p < 0.001). C, Determination of MET channel Ca2+ permeability in isotonic external Ca2+ and internal Cs+ (see Materials and Methods). During a sinusoidal bundle vibration (ΔX, ±200 nm), the membrane potential (Vm) was swept from −80 to +80 mV and the MET current reversed polarity at arrowed potential. Reversal potential in Tmc1 p.D528N/D528N; Tmc2−/− is ∼34 mV negative to Tmc1+/+; Tmc2−/− indicating much reduced Ca2+ permeability. D, Collected reversal potentials and relative permeability PCa/PCs in four cells each of Tmc1+/+, Tmc1 p.D528N/+ and Tmc1 p.D528N/D528N. All of which are significantly different (***) p < 0.001. Note the heterozygote reversal potential lies between wild type and homozygote. E, MET currents for bundle vibrations (ΔX, ±200 nm) in normal saline (black traces) and on adding DHS at 1 mm (top) and 10 mm (bottom) in Tmc1 p.D528N/D528N; Tmc2−/− (bottom). F, Mean ± SD (N = 5) of MET current block by DHS in Tmc1+/+ (N = 5) and Tmc1 p.D528N/D528N (N = 3). Hill plots give KI = 14 μm, Hill coefficient = 1 for control and 935 μm, Hill coefficient = 0.81 for mutant.
Figure 8.
Figure 8.
MET currents from OHCs of Tmc1 p.W554L/W554L; Tmc2−/−. A, Maximum currents in Tmc1+/+ (black traces) and Tmc1 p.W554L/W554L (red traces) for hair bundle vibrations (ΔX, ±200 nm) in apical and basal OHCs. B, Neonatal development of MET current (mean ± SD, N = 6) for basal and apical OHCs. Note the basal OHC currents develop about 2 d earlier and reach a larger maximum amplitude. The tonotopic gradient is preserved in the mutant but the maximum currents are up to 6-fold smaller. C, Examples of single MET channel currents for Tmc1 p.W554L/W554L; Tmc2−/−, ensemble average of 30 presentations (middle) and amplitude histogram (bottom) giving single channel −7.2 pA. Holding potential −84 mV. D, TMC1 immunolabeling of apical hair cells in P6 mice of Tmc1+/+; Tmc2−/− (top) and Tmc1 p.W554L/W554L; Tmc2−/− (bottom). E, Collected measurements of fluorescent intensity (au) in Tmc1+/+; Tmc2−/− and Tmc1 p.W554L/W554L; Tmc2−/−. Bars denote mean +/− SD. Mean values are significantly different p < 0.001 (***). Measurements made on 115 cells (control) and 75 cells (mutant) of four mice.
Figure 9.
Figure 9.
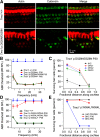
Loss of mechanotransduction determined with FM1-43 influx. A, Fluorescence images showing one row of IHCs and three rows of OHCs in the apical turn of cochlear explants of P15 Tmc1 p.T416K/T416k; Tmc2−/− mice after exposure to 6 μm FM1-43 in the absence (top) and presence (bottom) of 0.1 mm curare. B, Fluorescence intensity in IHCs and OHCs with and without d-tubocurarine in P15 mice (left) and P21 mice (right). Number of cells measured (±curare): P15 IHCs 76, 65; P15 OHCs 120, 145; P21 IHCs 55, 50; OHCs 69, 72. C, Fluorescence images in apical turns of P15 Tmc1 p.D528N/D528N; Tmc2−/− mice after exposure to 6 μm FM1-43 in the absence (top) and presence (bottom) of 0.1 mm curare. D, Fluorescence intensity in IHCs and OHCs ± curare in P15 mice (left) and P21 mice (right). Number of cells measured (±curare): P15 IHCs 81, 80; P15 OHCs 278, 178; P21 IHCs 25, 24; OHCs 68, 61. The small number of P21 IHCs reflect loss of these cells. All IHC measurements were made at slightly different focal plane to OHCs; *** statistical significance indicated t test, p < 0.001, in panles B–D, bars denote mean +/− SD.
Figure 10.
Figure 10.
Localization of deafness-causing mutations in TMC1. A, Ribbon representation of the TMC1 cavity built by TM domains TM4–TM7. The side chains of residues L410 (green), G411 (cyan), M412 (magenta), T416 (blue), D528 (red), W554 (yellow), and D569 (orange) are depicted in ball and stick representation. The approximated location of the lipid carbonyls of the plasma membrane is represented with two planes of gray spheres and the intracellular (IC) and extracellular (EC) sides are indicated. D and E dashed lines indicate the planes shown in panels D, E, respectively. B, Surface representation of the TMC1 ion conduction cavity embedded in a lipid membrane. Residues L410, G411, M412, T416, D528, W554, and D569 are colored as in A. Phospholipids are shown in ball and stick representation with their aliphatic chain in gray, phosphate in orange, oxygen in red, and nitrogen in blue. C, Pore profile along the cavity indicating the approximated positions of the EC and IC and residues M412, T416, D528, and D569. D, Surface representation of the top view of the TM4–TM7 cavity from the extracellular side revealing the localization of D528 (red) at its narrower region. E, Surface representation of the top view of the cavity from the extracellular side revealing the localization of D569 (orange), T416 (blue), and M412 (magenta) at the wider region of the cavity. The asterisks in D, E indicate the potential ion permeation pathway.

Similar articles

Cited by

References

    1. Assad JA, Shepherd GM, Corey DP (1991) Tip-link integrity and mechanical transduction in vertebrate hair cells. Neuron 7:985–994. 10.1016/0896-6273(91)90343-x - DOI - PubMed
    1. Ballesteros A, Fenollar-Ferrer C, Swartz KJ (2018) Structural relationship between the putative hair cell mechanotransduction channel TMC1 and TMEM16 proteins. Elife 7:e38433. 10.7554/eLife.38433 - DOI - PMC - PubMed
    1. Beurg M, Evans MG, Hackney CM, Fettiplace R (2006) A large-conductance calcium-selective mechanotransducer channel in mammalian cochlear hair cells. J Neurosci 26:10992–11000. 10.1523/JNEUROSCI.2188-06.2006 - DOI - PMC - PubMed
    1. Beurg M, Fettiplace R, Nam JH, Ricci AJ (2009) Localization of inner hair cell mechanotransducer channels using high-speed calcium imaging. Nat Neurosci 12:553–558. 10.1038/nn.2295 - DOI - PMC - PubMed
    1. Beurg M, Goldring AC, Fettiplace R (2015a) The effects of Tmc1 Beethoven mutation on mechanotransducer channel function in cochlear hair cells. J Gen Physiol 146:233–243. 10.1085/jgp.201511458 - DOI - PMC - PubMed

Publication types

Associated data