

Astrocytic glycogen accumulation drives the pathophysiology of neurodegeneration in Lafora disease
- PMID: 33822008
- PMCID: PMC8418345
- DOI: 10.1093/brain/awab110
Astrocytic glycogen accumulation drives the pathophysiology of neurodegeneration in Lafora disease
Abstract
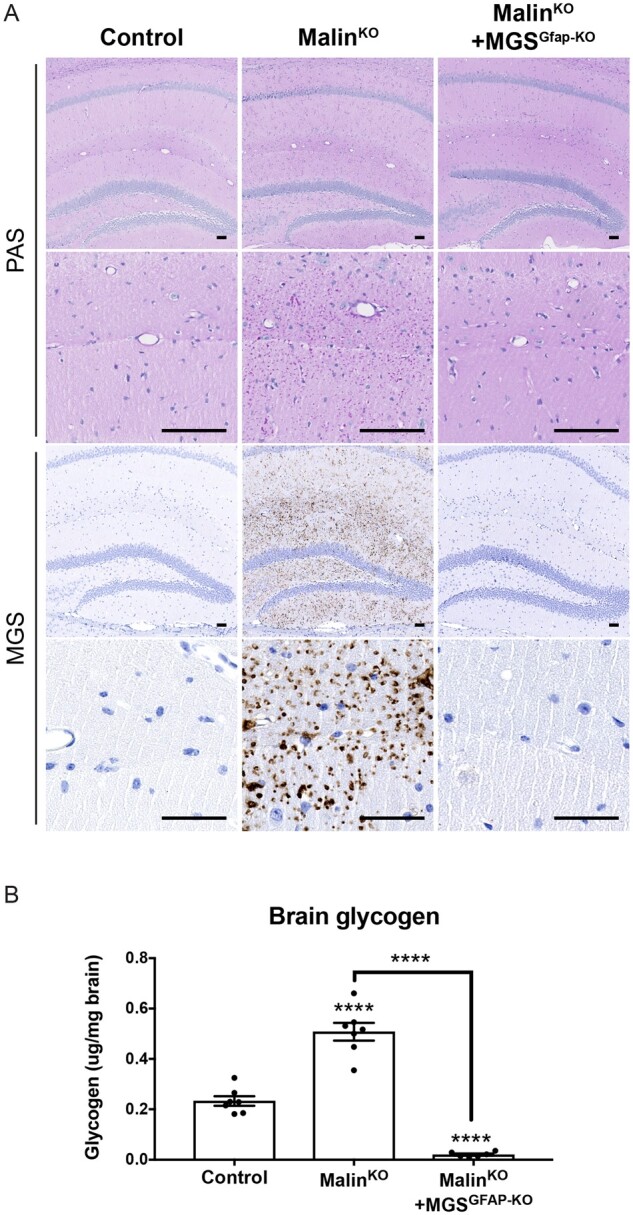
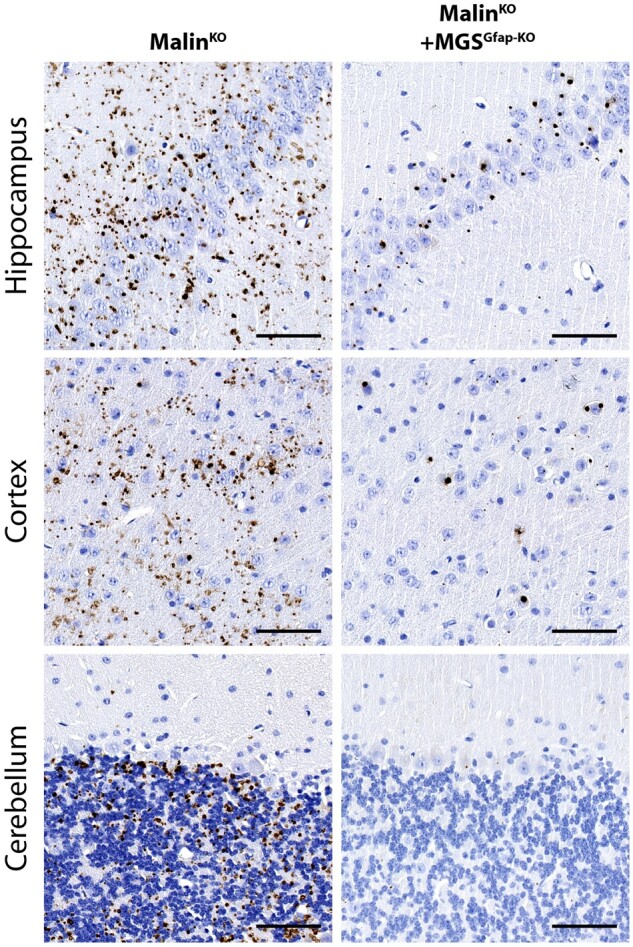
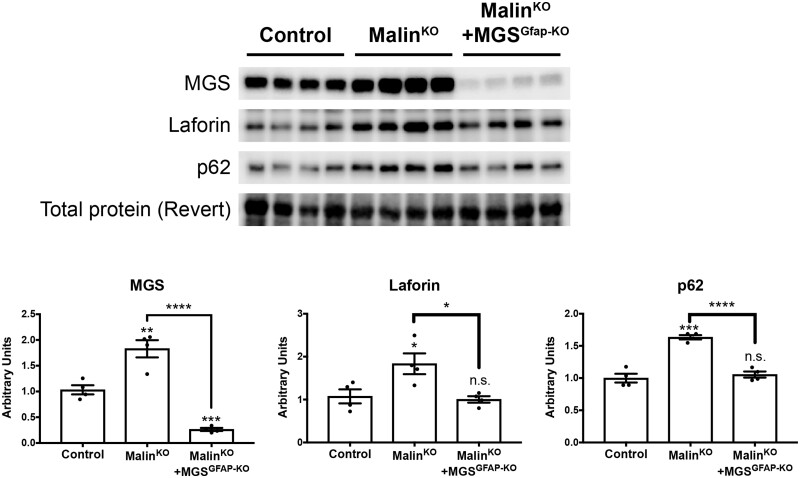
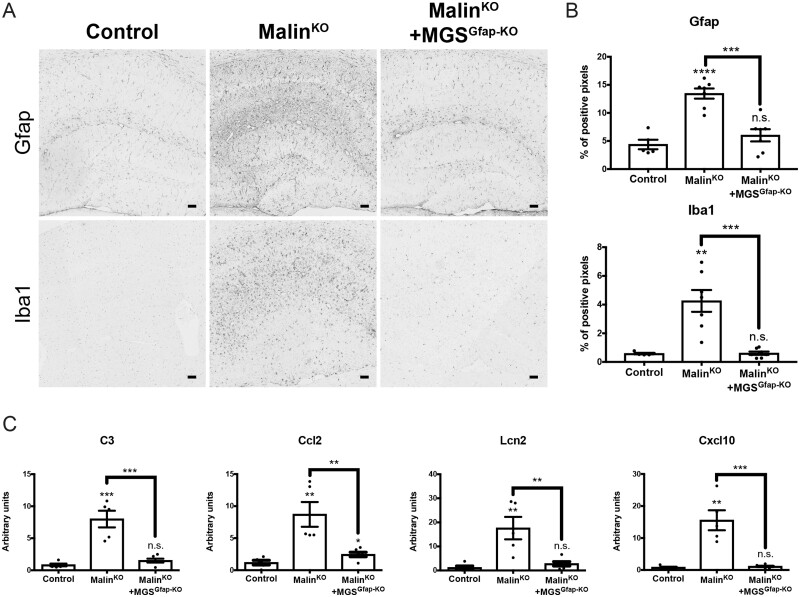
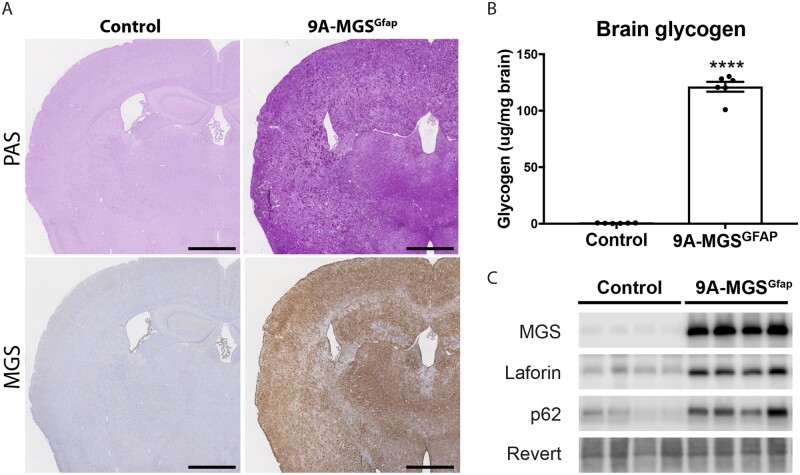
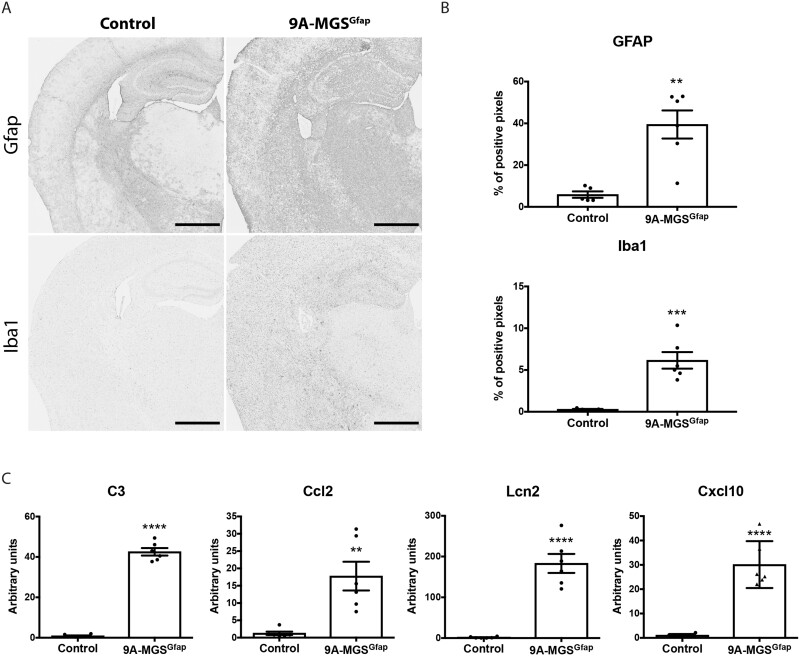
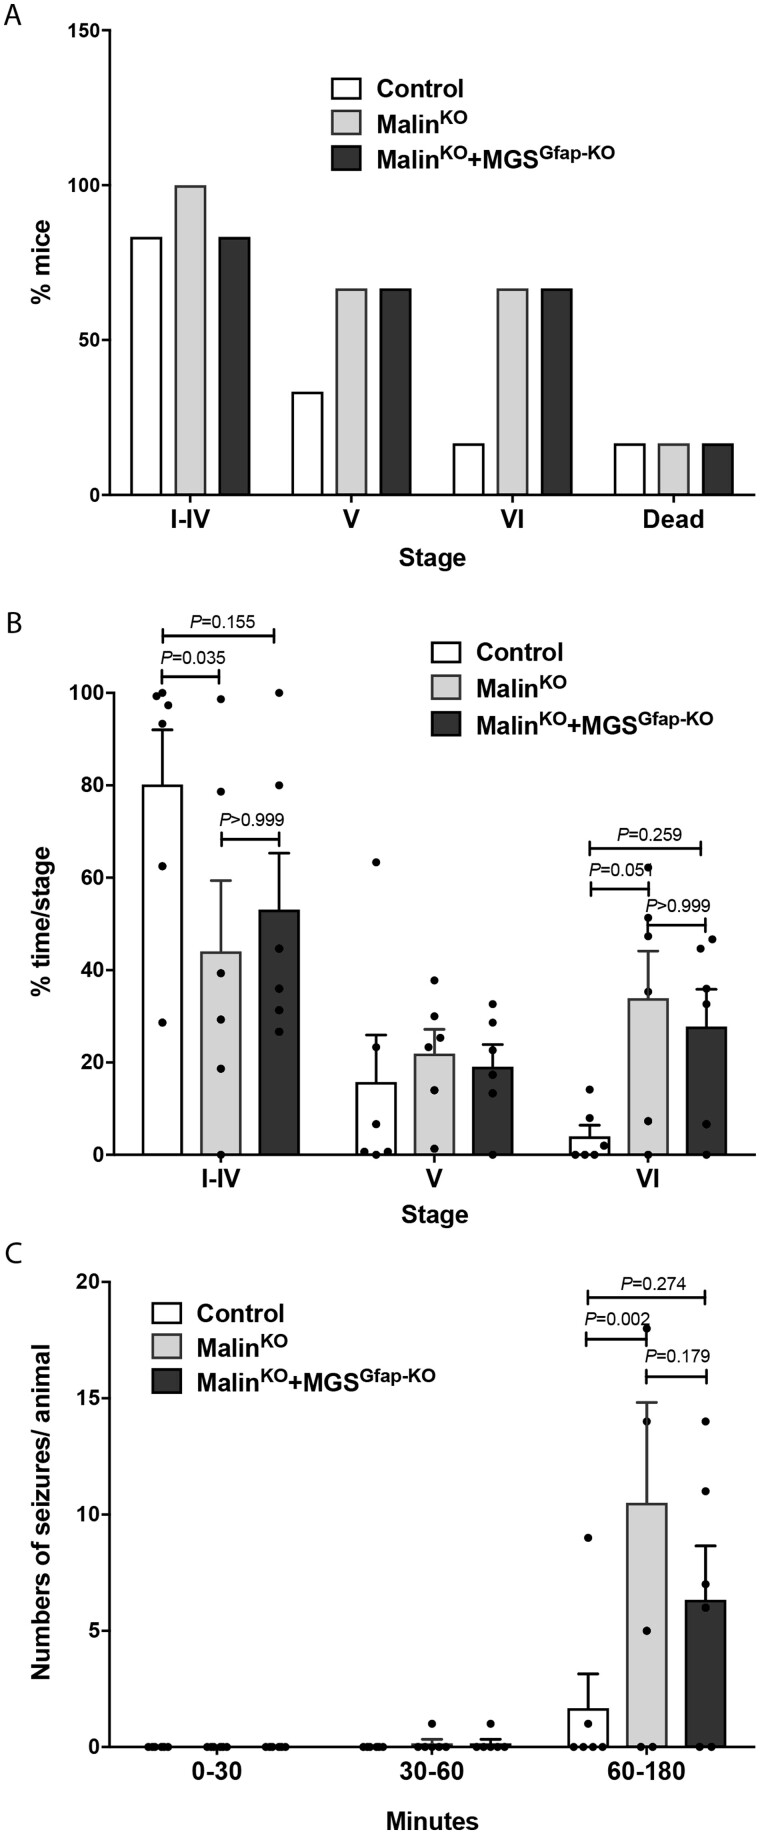
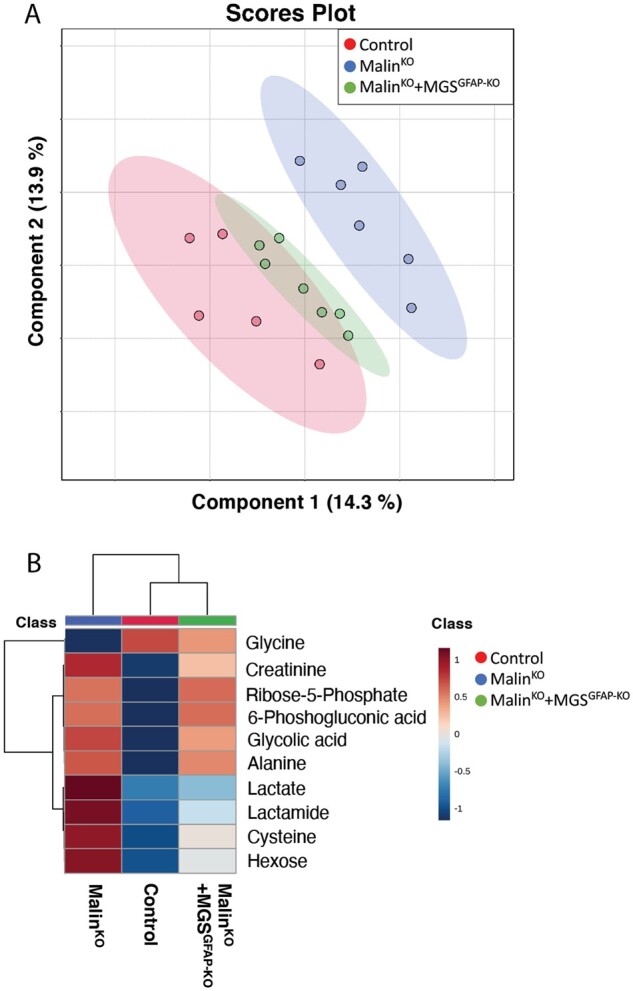
The hallmark of Lafora disease, a fatal neurodegenerative disorder, is the accumulation of intracellular glycogen aggregates called Lafora bodies. Until recently, it was widely believed that brain Lafora bodies were present exclusively in neurons and thus that Lafora disease pathology derived from their accumulation in this cell population. However, recent evidence indicates that Lafora bodies are also present in astrocytes. To define the role of astrocytic Lafora bodies in Lafora disease pathology, we deleted glycogen synthase specifically from astrocytes in a mouse model of the disease (malinKO). Strikingly, blocking glycogen synthesis in astrocytes-thus impeding Lafora bodies accumulation in this cell type-prevented the increase in neurodegeneration markers, autophagy impairment, and metabolic changes characteristic of the malinKO model. Conversely, mice that over-accumulate glycogen in astrocytes showed an increase in these markers. These results unveil the deleterious consequences of the deregulation of glycogen metabolism in astrocytes and change the perspective that Lafora disease is caused solely by alterations in neurons.
Keywords: Lafora disease; epilepsy; glycogen; neurodegeneration; neuroinflammation.
© The Author(s) (2021). Published by Oxford University Press on behalf of the Guarantors of Brain. All rights reserved. For permissions, please email: journals.permissions@oup.com.
Figures
Similar articles
-
Glycogen accumulation underlies neurodegeneration and autophagy impairment in Lafora disease.Hum Mol Genet. 2014 Jun 15;23(12):3147-56. doi: 10.1093/hmg/ddu024. Epub 2014 Jan 22. Hum Mol Genet. 2014. PMID: 24452334
-
Role of Astrocytes in the Pathophysiology of Lafora Disease and Other Glycogen Storage Disorders.Cells. 2023 Feb 24;12(5):722. doi: 10.3390/cells12050722. Cells. 2023. PMID: 36899857 Free PMC article. Review.
-
Astrocytes: new players in progressive myoclonus epilepsy of Lafora type.Hum Mol Genet. 2018 Apr 1;27(7):1290-1300. doi: 10.1093/hmg/ddy044. Hum Mol Genet. 2018. PMID: 29408991 Free PMC article.
-
Neurodegeneration and functional impairments associated with glycogen synthase accumulation in a mouse model of Lafora disease.EMBO Mol Med. 2011 Nov;3(11):667-81. doi: 10.1002/emmm.201100174. Epub 2011 Aug 29. EMBO Mol Med. 2011. PMID: 21882344 Free PMC article.
-
Glycogen in Astrocytes and Neurons: Physiological and Pathological Aspects.Adv Neurobiol. 2019;23:311-329. doi: 10.1007/978-3-030-27480-1_10. Adv Neurobiol. 2019. PMID: 31667813 Free PMC article. Review.
Cited by
-
Active Glycogen Synthase in the Liver Prevents High-Fat Diet-Induced Glucose Intolerance, Decreases Food Intake, and Lowers Body Weight.Int J Mol Sci. 2023 Jan 29;24(3):2574. doi: 10.3390/ijms24032574. Int J Mol Sci. 2023. PMID: 36768897 Free PMC article.
-
Clinicopathologic Dissociation: Robust Lafora Body Accumulation in Malin KO Mice Without Observable Changes in Home-Cage Behavior.J Comp Neurol. 2024 Jul;532(7):e25660. doi: 10.1002/cne.25660. J Comp Neurol. 2024. PMID: 39039998
-
TgLaforin, a glucan phosphatase, reveals the dynamic role of storage polysaccharides in Toxoplasma gondii tachyzoites and bradyzoites.bioRxiv [Preprint]. 2024 Nov 8:2023.09.29.560185. doi: 10.1101/2023.09.29.560185. bioRxiv. 2024. PMID: 37808860 Free PMC article. Preprint.
-
Myofiber-type-dependent 'boulder' or 'multitudinous pebble' formations across distinct amylopectinoses.Acta Neuropathol. 2024 Feb 27;147(1):46. doi: 10.1007/s00401-024-02698-x. Acta Neuropathol. 2024. PMID: 38411740
-
Glycogen accumulation modulates life span in a mouse model of amyotrophic lateral sclerosis.J Neurochem. 2024 May;168(5):744-759. doi: 10.1111/jnc.15906. Epub 2023 Jul 4. J Neurochem. 2024. PMID: 37401737
References
Publication types
MeSH terms
Substances
Grants and funding
LinkOut - more resources
Full Text Sources
Other Literature Sources
