

A NIR fluorescent smart probe for imaging tumor hypoxia
- PMID: 33811473
- PMCID: PMC8551997
- DOI: 10.1002/cnr2.1384
A NIR fluorescent smart probe for imaging tumor hypoxia
Abstract
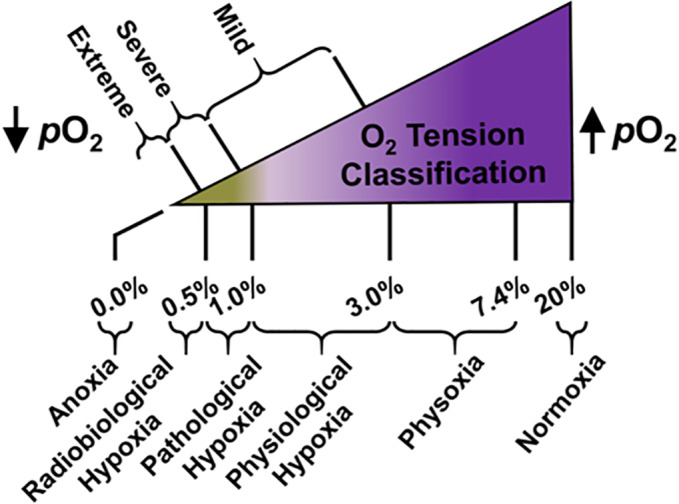
Background: Tumor hypoxia is a characteristic of paramount importance due to low oxygenation levels in tissue negatively correlating with resistance to traditional therapies. The ability to noninvasively identify such could provide for personalized treatment(s) and enhance survival rates. Accordingly, we recently developed an NIR fluorescent hypoxia-sensitive smart probe (NO2 -Rosol) for identifying hypoxia via selectively imaging nitroreductase (NTR) activity, which could correlate to oxygen deprivation levels in cells, thereby serving as a proxy. We demonstrated proof of concept by subjecting a glioblastoma (GBM) cell line to extreme stress by evaluating such under radiobiological hypoxic (pO2 ≤ ~0.5%) conditions, which is a far cry from representative levels for hypoxia for brain glioma (pO2 = ~1.7%) which fluctuate little from physiological hypoxic (pO2 = 1.0-3.0%) conditions.
Aim: We aimed to evaluate the robustness, suitability, and feasibility of NO2 -Rosol for imaging hypoxia in vitro and in vivo via assessing NTR activity in diverse GBM models under relevant oxygenation levels (pO2 = 2.0%) within physiological hypoxic conditions that mimic oxygenation levels in GBM tumor tissue in the brain.
Methods: We evaluated multiple GBM cell lines to determine their relative sensitivity to oxygenation levels via measuring carbonic anhydrase IX (CAIX) levels, which is a surrogate marker for indirectly identifying hypoxia by reporting on oxygen deprivation levels and upregulated NTR activity. We evaluated for hypoxia via measuring NTR activity when employing NO2 -Rosol in in vitro and tumor hypoxia imaging studies in vivo.
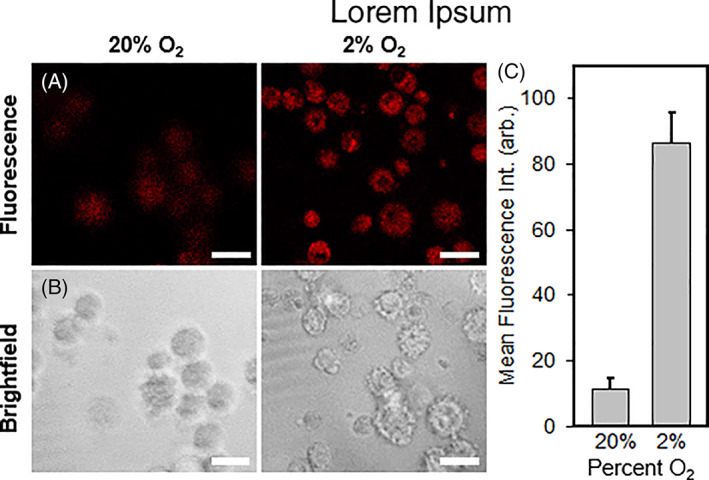
Results: The GBM39 cell line demonstrated the highest CAIX expression under hypoxic conditions representing that of GBM in the brain. NO2 -Rosol displayed an 8-fold fluorescence enhancement when evaluated in GBM39 cells (pO2 = 2.0%), thereby establishing its robustness and suitability for imaging hypoxia under relevant physiological conditions. We demonstrated the feasibility of NO2 -Rosol to afford tumor hypoxia imaging in vivo via it demonstrating a tumor-to-background of 5 upon (i) diffusion throughout, (ii) bioreductive activation by NTR activity in, and (iii) retention within, GBM39 tumor tissue.
Conclusion: We established the robustness, suitability, and feasibility of NO2 -Rosol for imaging hypoxia under relevant oxygenation levels in vitro and in vivo via assessing NTR activity in GBM39 models.
Keywords: NIR fluorescence; bioimaging; glioblastoma; hypoxia; smart probe.
© 2021 The Authors. Cancer Reports published by Wiley Periodicals LLC.
Conflict of interest statement
The authors have stated explicitly that there are no conflicts of interest in connection with this article.
Figures


Similar articles
-
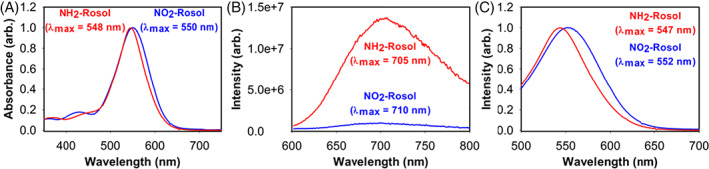
An Activatable NIR Fluorescent Rosol for Selectively Imaging Nitroreductase Activity.Sens Actuators B Chem. 2020 Mar 1;306:127446. doi: 10.1016/j.snb.2019.127446. Epub 2019 Nov 30. Sens Actuators B Chem. 2020. PMID: 32265579 Free PMC article.
-
Near-infrared off-on fluorescence probe activated by NTR for in vivo hypoxia imaging.Biosens Bioelectron. 2018 Nov 15;119:141-148. doi: 10.1016/j.bios.2018.08.014. Epub 2018 Aug 9. Biosens Bioelectron. 2018. PMID: 30125874
-
Evaluation of CAIX and CAXII Expression in Breast Cancer at Varied O2 Levels: CAIX is the Superior Surrogate Imaging Biomarker of Tumor Hypoxia.Mol Imaging Biol. 2016 Apr;18(2):219-31. doi: 10.1007/s11307-015-0885-x. Mol Imaging Biol. 2016. PMID: 26276155 Free PMC article.
-
Naphthalimides in fluorescent imaging of tumor hypoxia - An up-to-date review.Bioorg Chem. 2019 Jul;88:102979. doi: 10.1016/j.bioorg.2019.102979. Epub 2019 May 8. Bioorg Chem. 2019. PMID: 31100616 Review.
-
Imaging of oxygen and hypoxia in cell and tissue samples.Cell Mol Life Sci. 2018 Aug;75(16):2963-2980. doi: 10.1007/s00018-018-2840-x. Epub 2018 May 14. Cell Mol Life Sci. 2018. PMID: 29761206 Free PMC article. Review.
Cited by
-
Significance of Specific Oxidoreductases in the Design of Hypoxia-Activated Prodrugs and Fluorescent Turn off-on Probes for Hypoxia Imaging.Cancers (Basel). 2022 May 29;14(11):2686. doi: 10.3390/cancers14112686. Cancers (Basel). 2022. PMID: 35681666 Free PMC article. Review.
-
Ratiometric near-infrared fluorescent probe for nitroreductase activity enables 3D imaging of hypoxic cells within intact tumor spheroids.Chem Sci. 2024 Feb 5;15(10):3633-3639. doi: 10.1039/d3sc06058f. eCollection 2024 Mar 6. Chem Sci. 2024. PMID: 38455008 Free PMC article.
-
Detection of Hypoxia in Cancer Models: Significance, Challenges, and Advances.Cells. 2022 Feb 16;11(4):686. doi: 10.3390/cells11040686. Cells. 2022. PMID: 35203334 Free PMC article. Review.
-
The regulation of hypoxia-related lncRNAs in hepatocellular carcinoma.Discov Oncol. 2024 May 7;15(1):144. doi: 10.1007/s12672-024-01002-3. Discov Oncol. 2024. PMID: 38713276 Free PMC article. Review.
-
Radiotherapy of High-Grade Gliomas: First Half of 2021 Update with Special Reference to Radiosensitization Studies.Int J Mol Sci. 2021 Aug 19;22(16):8942. doi: 10.3390/ijms22168942. Int J Mol Sci. 2021. PMID: 34445646 Free PMC article. Review.
References
-
- Rowinsky EK. Novel radiation sensitizers targeting tissue hypoxia. Oncology (Williston Park). 1999;13(10 Suppl 5):61‐70. - PubMed
Publication types
MeSH terms
Substances
Grants and funding
LinkOut - more resources
Full Text Sources
Other Literature Sources
Miscellaneous
