

A Review of Ex Vivo X-ray Microfocus Computed Tomography-Based Characterization of the Cardiovascular System
- PMID: 33806852
- PMCID: PMC8004599
- DOI: 10.3390/ijms22063263
A Review of Ex Vivo X-ray Microfocus Computed Tomography-Based Characterization of the Cardiovascular System
Abstract
Cardiovascular malformations and diseases are common but complex and often not yet fully understood. To better understand the effects of structural and microstructural changes of the heart and the vasculature on their proper functioning, a detailed characterization of the microstructure is crucial. In vivo imaging approaches are noninvasive and allow visualizing the heart and the vasculature in 3D. However, their spatial image resolution is often too limited for microstructural analyses, and hence, ex vivo imaging is preferred for this purpose. Ex vivo X-ray microfocus computed tomography (microCT) is a rapidly emerging high-resolution 3D structural imaging technique often used for the assessment of calcified tissues. Contrast-enhanced microCT (CE-CT) or phase-contrast microCT (PC-CT) improve this technique by additionally allowing the distinction of different low X-ray-absorbing soft tissues. In this review, we present the strengths of ex vivo microCT, CE-CT and PC-CT for quantitative 3D imaging of the structure and/or microstructure of the heart, the vasculature and their substructures in healthy and diseased state. We also discuss their current limitations, mainly with regard to the contrasting methods and the tissue preparation.
Keywords: ex vivo; heart; microCT; morphometrics; structural characterization; vasculature.
Conflict of interest statement
The authors declare no conflict of interest. The funders had no role in the design of the study; in the collection, analyses or interpretation of the data; in the writing of the manuscript or in the decision to publish the results.
Figures


Similar articles
-
Contrast-Enhanced MicroCT for Virtual 3D Anatomical Pathology of Biological Tissues: A Literature Review.Contrast Media Mol Imaging. 2019 Feb 28;2019:8617406. doi: 10.1155/2019/8617406. eCollection 2019. Contrast Media Mol Imaging. 2019. PMID: 30944550 Free PMC article. Review.
-
Microscopic dual-energy CT (microDECT): a flexible tool for multichannel ex vivo 3D imaging of biological specimens.J Microsc. 2017 Jul;267(1):3-26. doi: 10.1111/jmi.12543. Epub 2017 Mar 7. J Microsc. 2017. PMID: 28267884
-
Whole heart detailed and quantitative anatomy, myofibre structure and vasculature from X-ray phase-contrast synchrotron radiation-based micro computed tomography.Eur Heart J Cardiovasc Imaging. 2017 Jul 1;18(7):732-741. doi: 10.1093/ehjci/jew314. Eur Heart J Cardiovasc Imaging. 2017. PMID: 28329054
-
Rapid 3D phenotyping of cardiovascular development in mouse embryos by micro-CT with iodine staining.Circ Cardiovasc Imaging. 2010 May;3(3):314-22. doi: 10.1161/CIRCIMAGING.109.918482. Epub 2010 Feb 27. Circ Cardiovasc Imaging. 2010. PMID: 20190279 Free PMC article.
-
A review of techniques for visualising soft tissue microstructure deformation and quantifying strain Ex Vivo.J Microsc. 2018 Dec;272(3):165-179. doi: 10.1111/jmi.12701. Epub 2018 Apr 14. J Microsc. 2018. PMID: 29655273 Review.
Cited by
-
Multiscale and multimodal imaging for three-dimensional vascular and histomorphological organ structure analysis of the pancreas.Sci Rep. 2024 May 2;14(1):10136. doi: 10.1038/s41598-024-60254-9. Sci Rep. 2024. PMID: 38698049 Free PMC article.
-
Ex Vivo Vascular Imaging and Perfusion Studies of Normal Kidney and Tumor Vasculature.Cancers (Basel). 2024 May 20;16(10):1939. doi: 10.3390/cancers16101939. Cancers (Basel). 2024. PMID: 38792017 Free PMC article.
-
Multilevel Analysis of the Neovascularization and Integration Process of a Nonvascularized Rectus Fascia Transplantation.Transplant Direct. 2024 May 15;10(6):e1624. doi: 10.1097/TXD.0000000000001624. eCollection 2024 Jun. Transplant Direct. 2024. PMID: 38757048 Free PMC article.
-
Cryogenic contrast-enhanced microCT enables nondestructive 3D quantitative histopathology of soft biological tissues.Nat Commun. 2022 Oct 20;13(1):6207. doi: 10.1038/s41467-022-34048-4. Nat Commun. 2022. PMID: 36266273 Free PMC article.
-
OCT Meets micro-CT: A Subject-Specific Correlative Multimodal Imaging Workflow for Early Chick Heart Development Modeling.J Cardiovasc Dev Dis. 2022 Nov 3;9(11):379. doi: 10.3390/jcdd9110379. J Cardiovasc Dev Dis. 2022. PMID: 36354778 Free PMC article.
References
-
- Eurostat Cardiovascular Diseases Statistics—Death from Cardiovascular Diseases. [(accessed on 20 March 2021)]; Available online: https://ec.europa.eu/eurostat/statistics-explained/index.php/Cardiovascu....
-
- Huntley G.D., Thaden J.J., Nkomo V.T. Chapter 3—Epidemiology of Heart Valve Disease. In: Kheradvar A., editor. Principles of Heart Valve Engineering. Academic Press; Cambridge, MA, USA: 2019. pp. 41–62. - DOI
-
- López-Guimet J., Peña-Pérez L., Bradley R.S., García-Canadilla P., Disney C., Geng H., Bodey A.J., Withers P.J., Bijnens B., Sherratt M.J., et al. MicroCT Imaging Reveals Differential 3D Micro-Scale Remodelling of the Murine Aorta in Ageing and Marfan Syndrome. Theranostics. 2018;8:6038–6052. doi: 10.7150/thno.26598. - DOI - PMC - PubMed
-
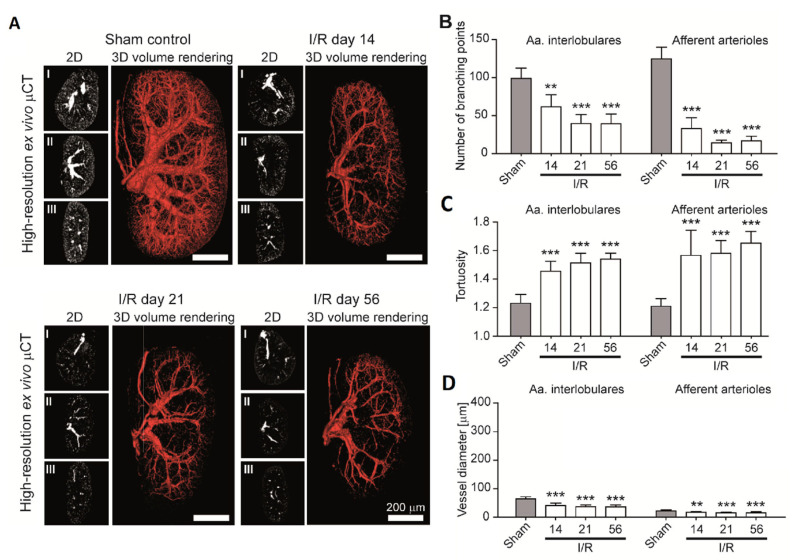
- Ehling J., Bábícková J., Gremse F., Klinkhammer B.M., Baetke S., Knuechel R., Kiessling F., Floege J., Lammers T., Boor P. Quantitative Micro-Computed Tomography Imaging of Vascular Dysfunction in Progressive Kidney Diseases. J. Am. Soc. Nephrol. 2016;27:520–532. doi: 10.1681/ASN.2015020204. - DOI - PMC - PubMed
Publication types
MeSH terms
Substances
LinkOut - more resources
Full Text Sources
Other Literature Sources
