. 2021 Mar 13;11(3):369.
doi: 10.3390/brainsci11030369.

Upper and Lower Motor Neuron Degenerations Are Somatotopically Related and Temporally Ordered in the Sod1 Mouse Model of Amyotrophic Lateral Sclerosis

Affiliations

Upper and Lower Motor Neuron Degenerations Are Somatotopically Related and Temporally Ordered in the Sod1 Mouse Model of Amyotrophic Lateral Sclerosis

Christine Marques et al. Brain Sci. .

Abstract

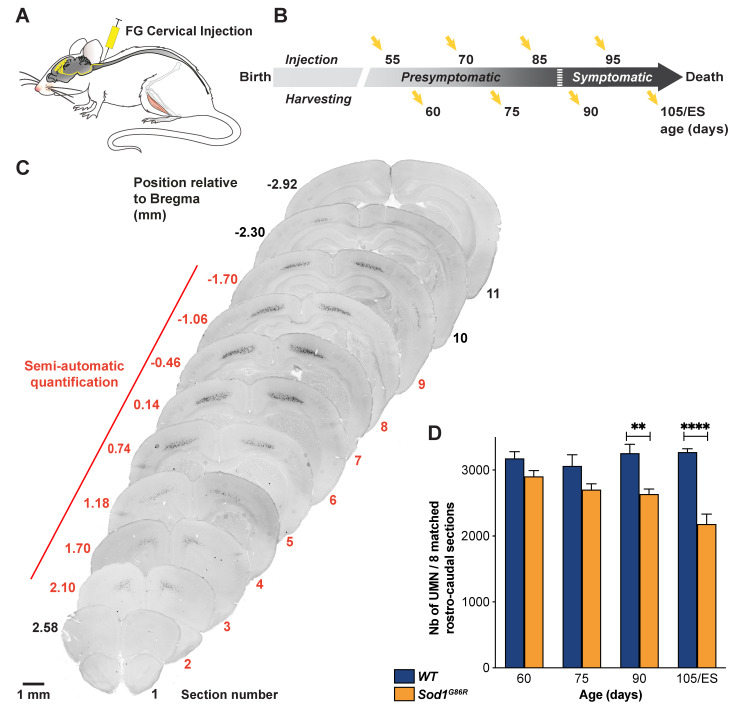
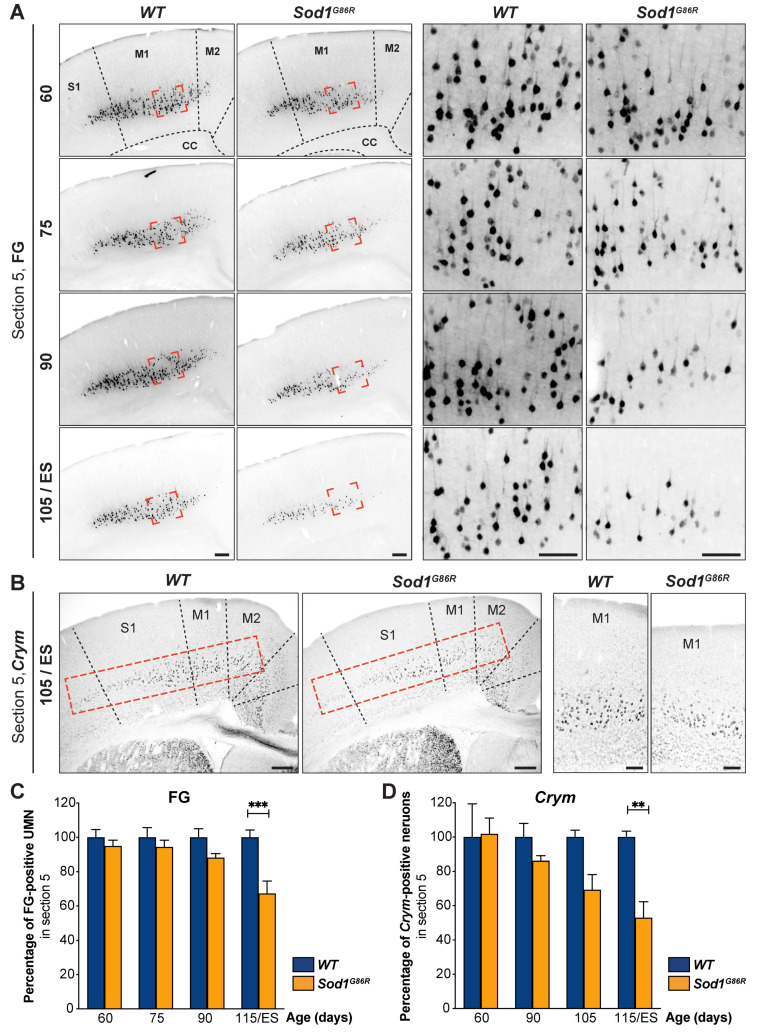
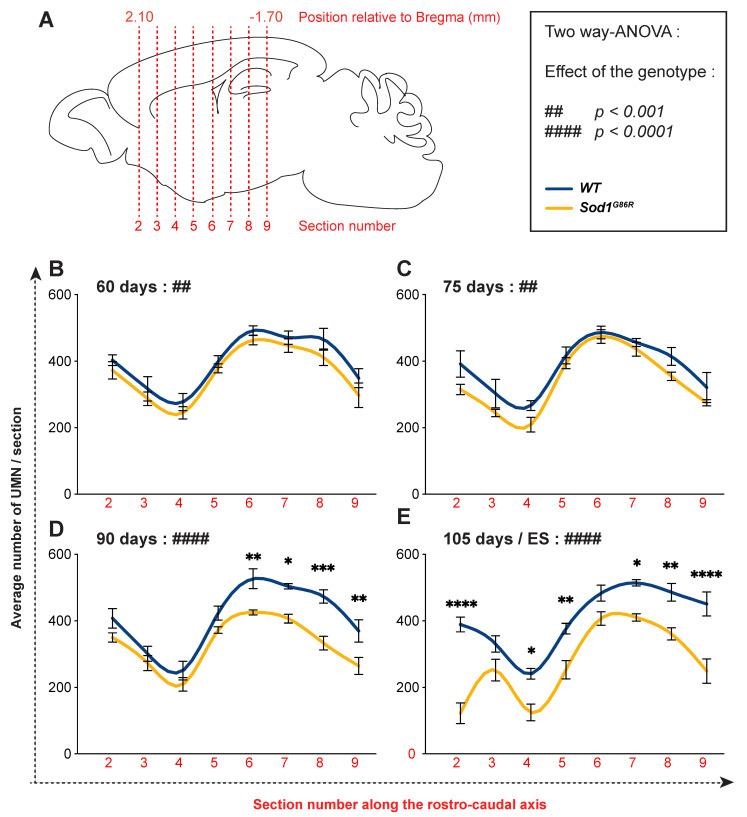
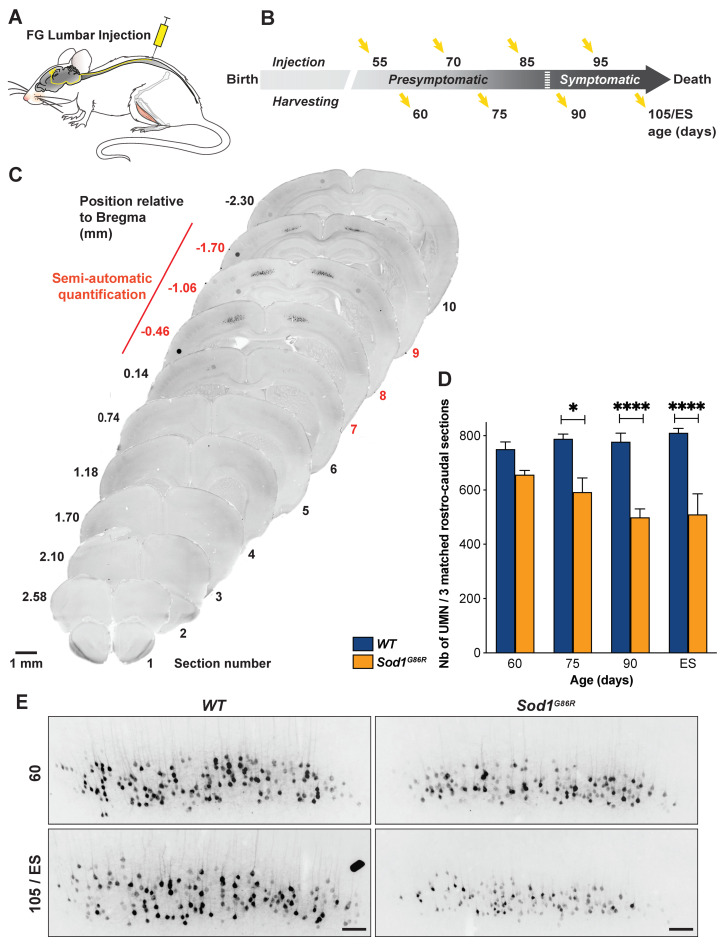
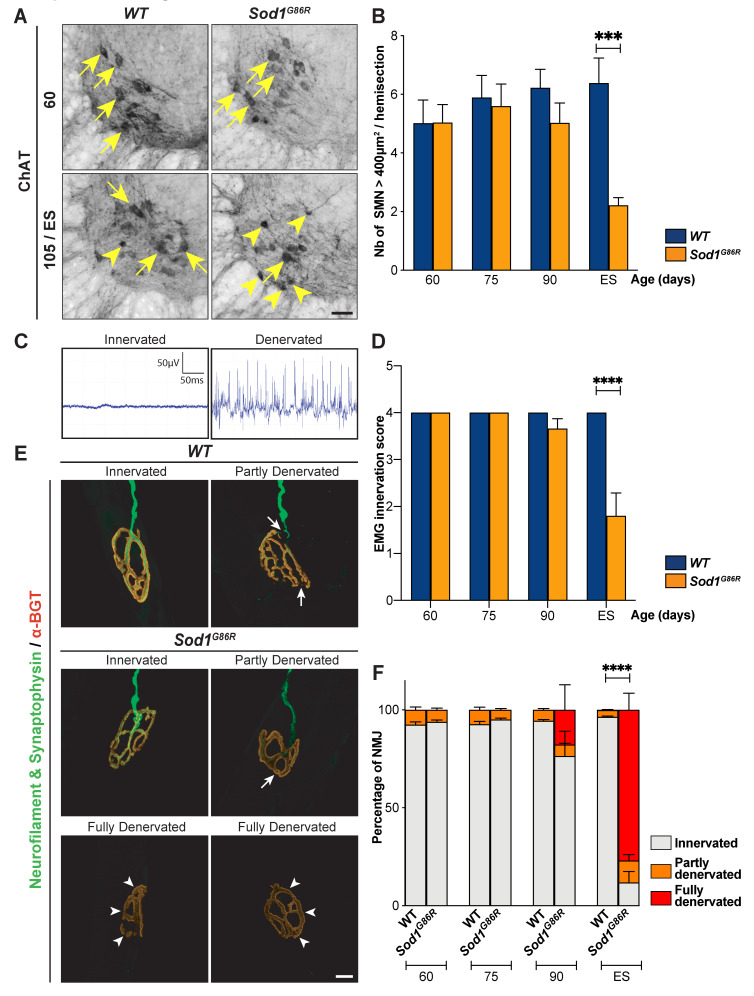
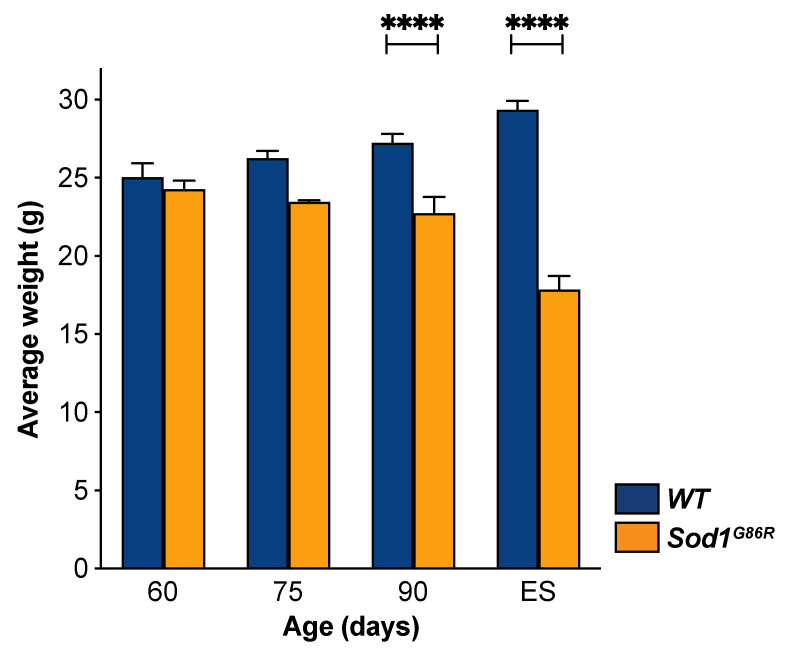
Amyotrophic lateral sclerosis (ALS) is a devastating and fatal neurodegenerative disease arising from the combined degeneration of upper motor neurons (UMN) in the motor cortex, and lower motor neurons (LMN) in the brainstem and spinal cord. This dual impairment raises two major questions: (i) are the degenerations of these two neuronal populations somatotopically related? and if yes (ii), where does neurodegeneration start? If studies carried out on ALS patients clearly demonstrated the somatotopic relationship between UMN and LMN degenerations, their temporal relationship remained an unanswered question. In the present study, we took advantage of the well-described Sod1G86R model of ALS to interrogate the somatotopic and temporal relationships between UMN and LMN degenerations in ALS. Using retrograde labelling from the cervical or lumbar spinal cord of Sod1G86R mice and controls to identify UMN, along with electrophysiology and histology to assess LMN degeneration, we applied rigorous sampling, counting, and statistical analyses, and show that UMN and LMN degenerations are somatotopically related and that UMN depletion precedes LMN degeneration. Together, the data indicate that UMN degeneration is a particularly early and thus relevant event in ALS, in accordance with a possible cortical origin of the disease, and emphasize the need to further elucidate the molecular mechanisms behind UMN degeneration, towards new therapeutic avenues.

Keywords: amyotrophic lateral sclerosis; descending propagation; dying-forward; lower motor neurons; motor cortex; somatotopy; upper motor neurons.


Conflict of interest statement

The authors declare that they have no conflict of interests.

Figures

Figure 1
Figure 1
UMN progressively degenerate in Sod1G86R mice. (A) Schematic of the experimental design: UMN were retrogradely labelled upon Fluorogold (FG) injection into the cervical portion of the spinal cord. (B) Ages of injection and harvesting (ES: End Stage). (C) Representative negative fluorescence images of brain coronal sections numbered 1 (Bregma 2.58 mm) to 10 (Bregma −2.30 mm) showing FG-labelled UMN in the cerebral cortex of a 75 day-old WT mouse. Upon FG injection into the cervical portion of the dorsal funiculus, labelled UMN were consistently observed from section 2 (Bregma 2.10 mm) to 9 (Bregma −1.70 mm). Red numbering and line indicate the sections that were further processed for UMN quantifications. (D) Bar graph representing the average number of UMN present on 8 equally spaced coronal sections along the rostro-caudal axis, matched between Sod1G86R (orange) and WT mice (blue). Note the progressive loss of labelled UMN in the brain of Sod1G86R animals. N= 5 WT and 6 Sod1G86R at 60 days; 6 WT and 3 Sod1G86R at 75 days; 5 WT and 6 Sod1G86R at 90 days; 5 WT and 5 Sod1G86R at 105 days/ES. ** p < 0.01 and **** p < 0.0001 in multiple comparisons test. Scale bar = 1 mm.
Figure 2
Figure 2
Progressive loss of UMN is confirmed by in situ hybridization. (A) Representative negative fluorescence images of brain coronal sections (Bregma 0.74 mm, corresponding to Section 5 for Figure 1) showing FG-labelled UMN in the cerebral cortex of WT and Sod1G86R mice of 60, 75, 90, and 105 days of age or end stage (ES). Red shapes indicate the positions where the close-ups of the right panels were acquired. (B) Representative images of in situ hybridization on brain coronal sections of ES Sod1G86R and 115 day-old WT control mice showing decreased Crym expression in the layer V of the cerebral cortex. Dotted red rectangles indicate the areas where Crym-positive neurons were counted. Close-ups are shown in the right panel. (C) Bar graph representing the percentage of FG-positive neurons in Sod1G86R mice (orange) relative to their WT littermates (blue) over time. (D) Bar graph representing the percentage of Crym-positive neurons in Sod1G86R mice (orange) relative to their WT littermates (blue) over time. N = 5 WT and 6 Sod1G86R at 60 days; 6 WT and 3 Sod1G86R at 75 days; 5 WT and 6 Sod1G86R at 90 days; 5 WT and 5 Sod1G86R at 105 days/ES (end stage). ** p < 0.01 and *** p < 0.001 in multiple comparisons test. Scale bars = 200 µm in the left panels and 50 µm in the right panels of (A,B). M1, primary motor cortex; M2, secondary motor cortex; S1, primary somatosensory cortex.
Figure 3
Figure 3
In Sod1G86R mice, UMN degeneration starts caudally and progresses rostrally. (A) Schematic of a mouse brain representing the positioning of the eight rostro-caudal sections where UMN were counted. (BD) Graphs representing the average number of FG-labelled UMN counted on both hemispheres of equally spaced coronal Sections 2 (Bregma 2.10 mm) to 9 (Bregma −1.70 mm) of Sod1G86R mice (orange) and their WT littermates (blue) at 60 (B), 75 (C), 90 (D), and 105 days of age or disease end stage (E). N = 5 WT and 6 Sod1G86R at 60 days; 6 WT and 3 Sod1G86R at 75 days; 5 WT and 6 Sod1G86R at 90 days; 5 WT and 5 Sod1G86R at 105 days/ES. The box indicates the p value obtained for the genotype effect upon running a two-way ANOVA at each age. ## p < 0.01 and #### p < 0.0001. * p < 0.05, ** p < 0.01, *** p < 0.001 and **** p < 0.0001 in multiple comparisons test.
Figure 4
Figure 4
Lumbar-projecting UMN degenerate earlier than the rest of the UMN population. (A) Schematic of the experimental design: UMN were retrogradely labelled upon Fluorogold (FG) injection into the lumbar portion of the spinal cord. (B) Ages of injection and harvesting. (C) Representative negative fluorescence images of brain coronal sections numbered 1 (Bregma 2.58 mm) to 10 (Bregma −2.30 mm) showing FG-labelled UMN in the cerebral cortex of a 75 day-old WT mouse. Upon FG injection into the lumbar portion of the dorsal funiculus, labelled UMN were consistently observed from Section 7 (Bregma −0.46 mm) to 9 (Bregma −1.70 mm). Red numbering and line indicate the sections that were further processed for UMN quantifications. (D) Bar graph representing the average number of UMN present on three equally spaced caudal coronal sections matched between Sod1G86R (orange) and WT mice (blue), at 60, 75, 90, and 105 days of age or end stage (ES). N = 4 WT and 3 Sod1G86R at 60 days; 4 WT and 3 Sod1G86R at 75 days; 5 WT and 5 Sod1G86R at 90 days; and 4 WT and 4 Sod1G86R at 105 days/ES (end stage). Note the early and progressive loss of labelled UMN in the brain of Sod1G86R animals. (E) Representative negatives images of fluorescence of brain coronal sections (Bregma −1.06 mm) showing the decreased number of FG-labelled UMN in the cerebral cortex of Sod1G86R mice at 60 days of age and at end stage (ES) compared to their WT littermates. * p < 0.05 and **** p < 0.0001 in multiple comparisons test. Scale bar = 1 mm in (C) and 100 µm in (E).
Figure 5
Figure 5
In Sod1G86R mice, LNM degeneration starts after the loss of the first UMN. (A) Representative images of coronal sections of the spinal cord of WT and Sod1G86R mice at 60 and 105 days or end stage (ES), showing Choline AcetylTransferase-positive neurons (ChAT) present in the ventral horn. Arrows indicate large ChAT-positive neurons, arrowheads indicate smaller or shrinked ChAT-positive neurons. (B) Bar graph representing the average number of large ChAT-positive neurons, with an area ≥ 400 µm2, counted in the ventral horn of lumbar spinal cord sections from WT (blue) and Sod1G86R mice (orange) at 60, 75, 90, and 105 days of age or ES. (C) Representative electromyography recordings of an intact, innervated muscle (left), and of a denervated muscle presenting fasciculations (right). (D) Bar graph representing the EMG innervation scores calculated for Sod1G86R and WT mice. (E) Representative maximum intensity projection images of z-stacks of typical innervated, partly or fully denervated neuromuscular junctions (NMJ) from 90 day-old Sod1G86R and WT mice upon labelling of presynaptic elements with neurofilament and synaptophysin (green) and postsynaptic elements with alpha-bungarotoxin (α-BGT, red). (F) Bar graph representing the average proportions of innervated (grey), partly denervated (orange), or fully denervated (red) NMJ upon staining and microscopy analysis of one tibialis anterior muscle of WT and Sod1G86R mice at 60, 75, 90, and 105 days of age or end stage (ES). N = 5 WT and 6 Sod1G86R at 60 days; 6 WT and 3 Sod1G86R at 75 days; 5 WT and 6 Sod1G86R at 90 days; and 5 WT and 5 Sod1G86R at 105 days/ES. *** p < 0.001 and **** p < 0.0001 in multiple comparisons test (B,D) and multiple t tests (F). Scale bar = 50 µm in (A) and 10 µm in (E).
Figure 6
Figure 6
UMN depletion starts before weight loss. Bar graph representing the average weight of animals that received Fluorogold in the cervical or lumbar portions of the spinal cord. Weight was measured prior to harvesting at 60, 75, 90, and 105 days of age or ES. N = 9 WT and 8 Sod1G86R at 60 days; 10 WT and 6 Sod1G86R at 75 days; 10 WT and 11 Sod1G86R at 90 days; and 8 WT and 8 Sod1G86R at 105 days/ES. **** p < 0.001 in multiple comparisons test.

Similar articles

Cited by

References

    1. Masrori P., Van Damme P. Amyotrophic lateral sclerosis: A clinical review. Eur. J. Neurol. 2020;27:1918–1929. doi: 10.1111/ene.14393. - DOI - PMC - PubMed
    1. Sorenson E.J. The Electrophysiology of the Motor Neuron Diseases. Neurol. Clin. 2012;30:605–620. doi: 10.1016/j.ncl.2011.12.006. - DOI - PubMed
    1. Dash R.P., Babu R.J., Srinivas N.R. Two Decades-Long Journey from Riluzole to Edaravone: Revisiting the Clinical Pharmacokinetics of the Only Two Amyotrophic Lateral Sclerosis Therapeutics. Clin. Pharmacokinet. 2018;57:1385–1398. doi: 10.1007/s40262-018-0655-4. - DOI - PubMed
    1. Bede P., Bodke A., Elamin M., Byrne S., McLaughlin R.L., Jordan N., Hampel H., Gallagher L., Lynch C., Fagan A.J., et al. Grey matter correlates of clinical variables in amyotrophic lateral sclerosis (ALS): A neuroimaging study of ALS motor phenotype heterogeneity and cortical focality. J. Neurol. Neurosurg. Psychiatry. 2013;84:7166–7773. doi: 10.1136/jnnp-2012-302674. - DOI - PubMed
    1. Dharmadasa T., Matamala J.M., Howells J., Vucic S., Kiernan M.C. Clinical Neurophysiology. Clin. Neurophysiol. 2020;131:958–966. doi: 10.1016/j.clinph.2019.11.057. - DOI - PubMed

LinkOut - more resources