Reduction of Amyloid Burden by Proliferated Homeostatic Microglia in Toxoplasma gondii-Infected Alzheimer's Disease Model Mice
- PMID: 33803262
- PMCID: PMC7975980
- DOI: 10.3390/ijms22052764
Reduction of Amyloid Burden by Proliferated Homeostatic Microglia in Toxoplasma gondii-Infected Alzheimer's Disease Model Mice
Abstract
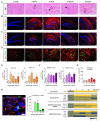
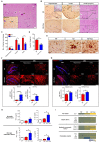
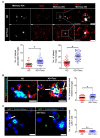
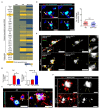
In this study, we confirmed that the number of resident homeostatic microglia increases during chronic Toxoplasma gondii infection. Given that the progression of Alzheimer's disease (AD) worsens with the accumulation of amyloid β (Aβ) plaques, which are eliminated through microglial phagocytosis, we hypothesized that T. gondii-induced microglial proliferation would reduce AD progression. Therefore, we investigated the association between microglial proliferation and Aβ plaque burden using brain tissues isolated from 5XFAD AD mice (AD group) and T. gondii-infected AD mice (AD + Toxo group). In the AD + Toxo group, amyloid plaque burden significantly decreased compared with the AD group; conversely, homeostatic microglial proliferation, and number of plaque-associated microglia significantly increased. As most plaque-associated microglia shifted to the disease-associated microglia (DAM) phenotype in both AD and AD + Toxo groups and underwent apoptosis after the lysosomal degradation of phagocytosed Aβ plaques, this indicates that a sustained supply of homeostatic microglia is required for alleviating Aβ plaque burden. Thus, chronic T. gondii infection can induce microglial proliferation in the brains of mice with progressed AD; a sustained supply of homeostatic microglia is a promising prospect for AD treatment.
Keywords: 5XFAD mouse; Alzheimer’s disease; Toxoplasma gondii; chronic infection; disease-associated microglia; homeostatic microglia; lysosomal digestion; plaque-associated microglia; plaque-free microglia.
Conflict of interest statement
The authors have declared that no conflicts of interest exist.
Figures


Similar articles
-
Toxoplasma gondii Infection of Alzheimer's Disease Mice Reduces Brain Amyloid Density Globally and Regionally.J Infect Dis. 2024 Sep 10;230(Supplement_2):S165-S172. doi: 10.1093/infdis/jiae227. J Infect Dis. 2024. PMID: 39255396
-
Chronic Toxoplasma gondii infection enhances β-amyloid phagocytosis and clearance by recruited monocytes.Acta Neuropathol Commun. 2016 Mar 16;4:25. doi: 10.1186/s40478-016-0293-8. Acta Neuropathol Commun. 2016. PMID: 26984535 Free PMC article.
-
Fibrillar Aβ triggers microglial proteome alterations and dysfunction in Alzheimer mouse models.Elife. 2020 Jun 8;9:e54083. doi: 10.7554/eLife.54083. Elife. 2020. PMID: 32510331 Free PMC article.
-
Effects of CX3CR1 and Fractalkine Chemokines in Amyloid Beta Clearance and p-Tau Accumulation in Alzheimer's Disease (AD) Rodent Models: Is Fractalkine a Systemic Biomarker for AD?Curr Alzheimer Res. 2016;13(4):403-12. doi: 10.2174/1567205013666151116125714. Curr Alzheimer Res. 2016. PMID: 26567742 Review.
-
Microglia and amyloid plaque formation in Alzheimer's disease - Evidence, possible mechanisms, and future challenges.J Neuroimmunol. 2024 May 15;390:578342. doi: 10.1016/j.jneuroim.2024.578342. Epub 2024 Apr 4. J Neuroimmunol. 2024. PMID: 38640827 Review.
Cited by
-
Toxoplasma gondii Infection of Alzheimer's Disease Mice Reduces Brain Amyloid Density Globally and Regionally.J Infect Dis. 2024 Sep 10;230(Supplement_2):S165-S172. doi: 10.1093/infdis/jiae227. J Infect Dis. 2024. PMID: 39255396
-
Comprehensive Overview of Toxoplasma gondii-Induced and Associated Diseases.Pathogens. 2021 Oct 20;10(11):1351. doi: 10.3390/pathogens10111351. Pathogens. 2021. PMID: 34832507 Free PMC article. Review.
-
Behavioral and Neuropathological Changes After Toxoplasma gondii Ocular Conjunctival Infection in BALB/c Mice.Front Cell Infect Microbiol. 2022 Mar 9;12:812152. doi: 10.3389/fcimb.2022.812152. eCollection 2022. Front Cell Infect Microbiol. 2022. PMID: 35372100 Free PMC article.
-
A review of the roles of pathogens in Alzheimer's disease.Front Neurosci. 2024 Aug 19;18:1439055. doi: 10.3389/fnins.2024.1439055. eCollection 2024. Front Neurosci. 2024. PMID: 39224577 Free PMC article. Review.
-
Latent toxoplasmosis, Cytomegalovirus, and Herpes Simplex Virus infections and risk of motorcycle accidents: A case-control study in a county with a high rate of motorcycle injuries in Iran.PLoS One. 2024 Aug 22;19(8):e0307950. doi: 10.1371/journal.pone.0307950. eCollection 2024. PLoS One. 2024. PMID: 39172983 Free PMC article.
References
-
- Rangaraju S., Dammer E.B., Raza S.A., Rathakrishnan P., Xiao H., Gao T., Duong D.M., Pennington M.W., Lah J.J., Seyfried N.T., et al. Identification and therapeutic modulation of a pro-inflammatory subset of disease-associated-microglia in Alzheimer’s disease. Mol. Neurodegener. 2018;13:1–25. doi: 10.1186/s13024-018-0254-8. - DOI - PMC - PubMed
MeSH terms
Substances
Grants and funding
LinkOut - more resources
Full Text Sources
Other Literature Sources
Medical
Research Materials

