. 2021 Mar 31;12(1):1980.
doi: 10.1038/s41467-021-22312-y.

Type I interferons affect the metabolic fitness of CD8+ T cells from patients with systemic lupus erythematosus

Affiliations

Type I interferons affect the metabolic fitness of CD8+ T cells from patients with systemic lupus erythematosus

Norzawani Buang et al. Nat Commun. .

Abstract

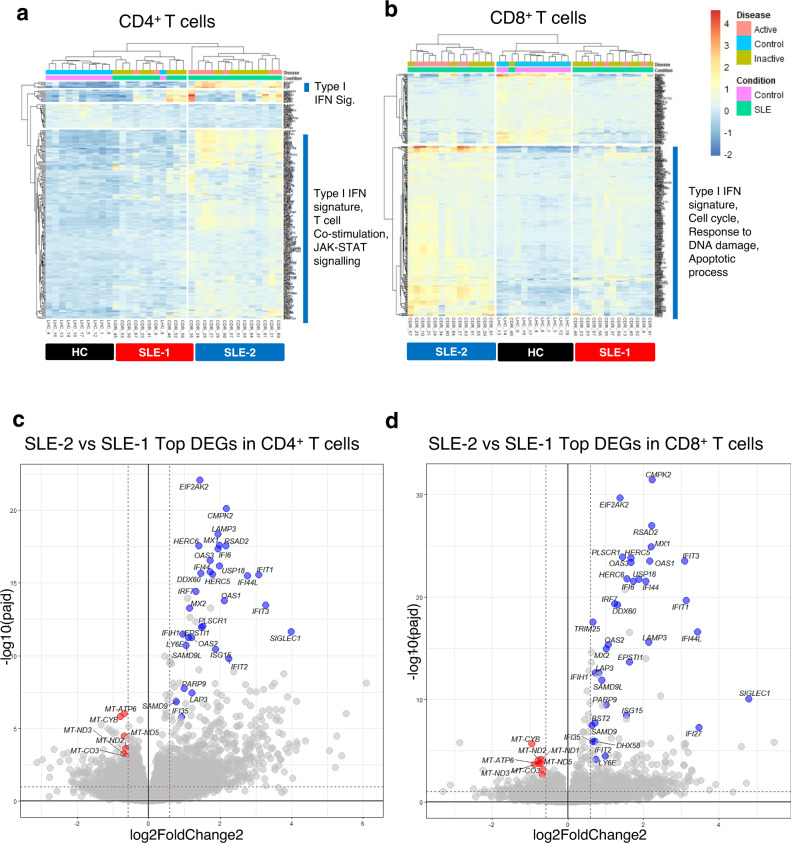
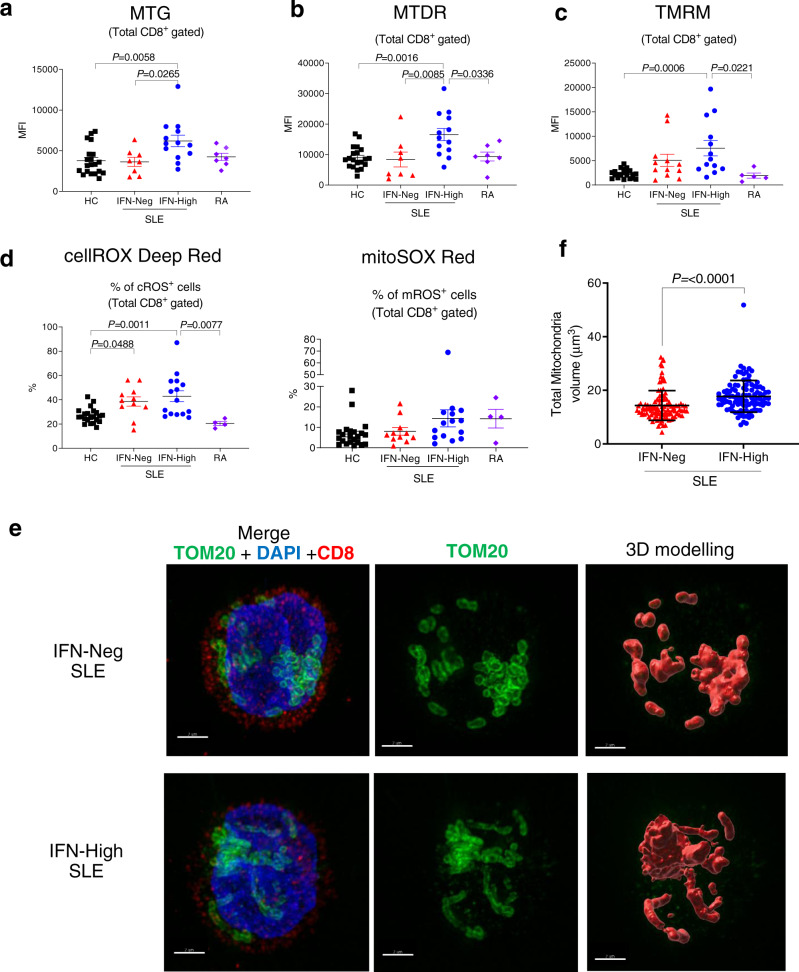
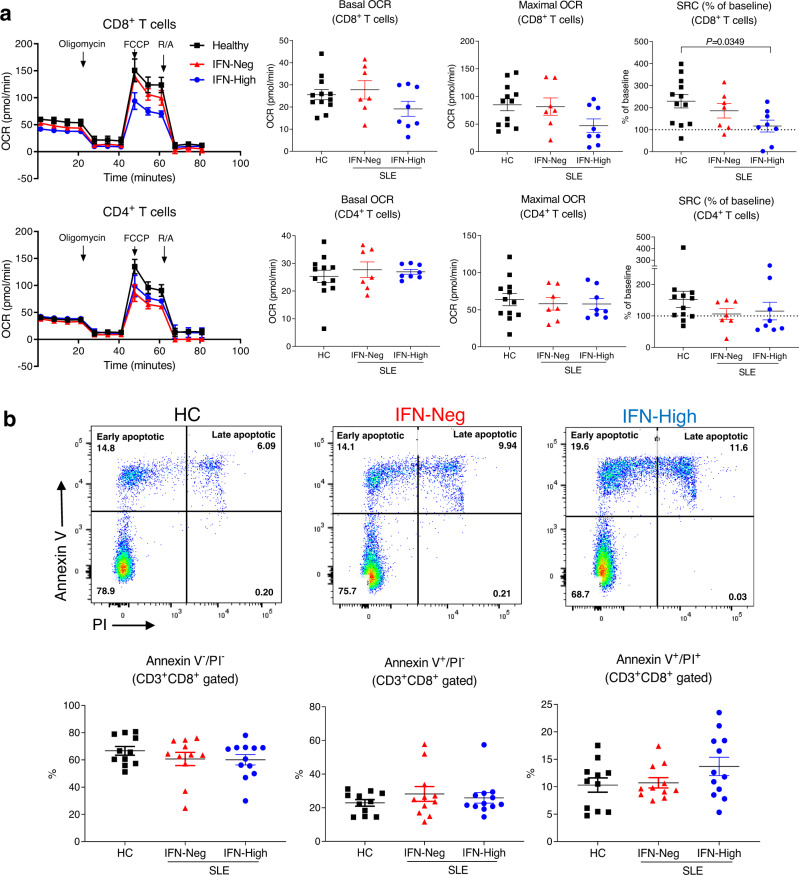
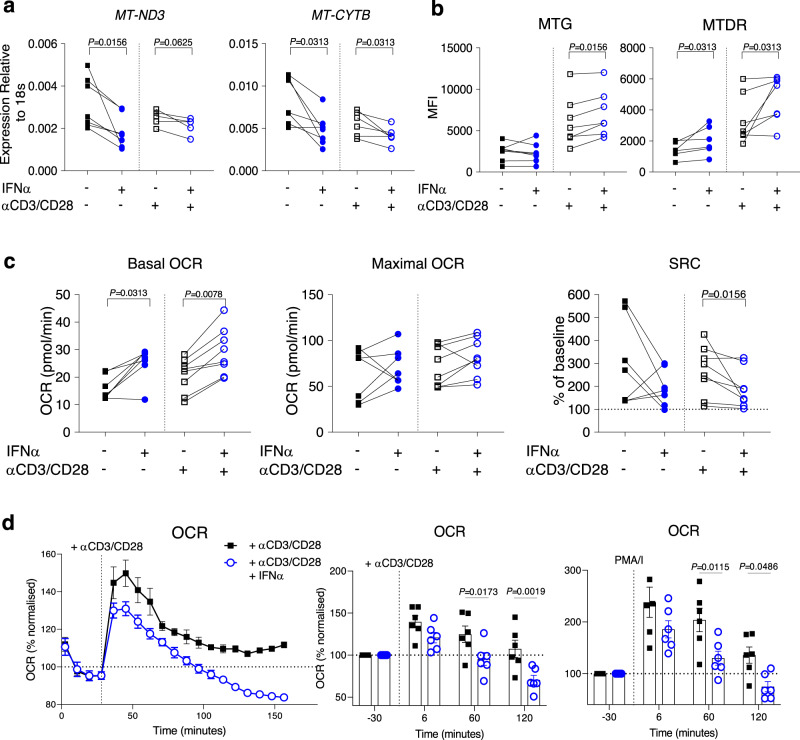
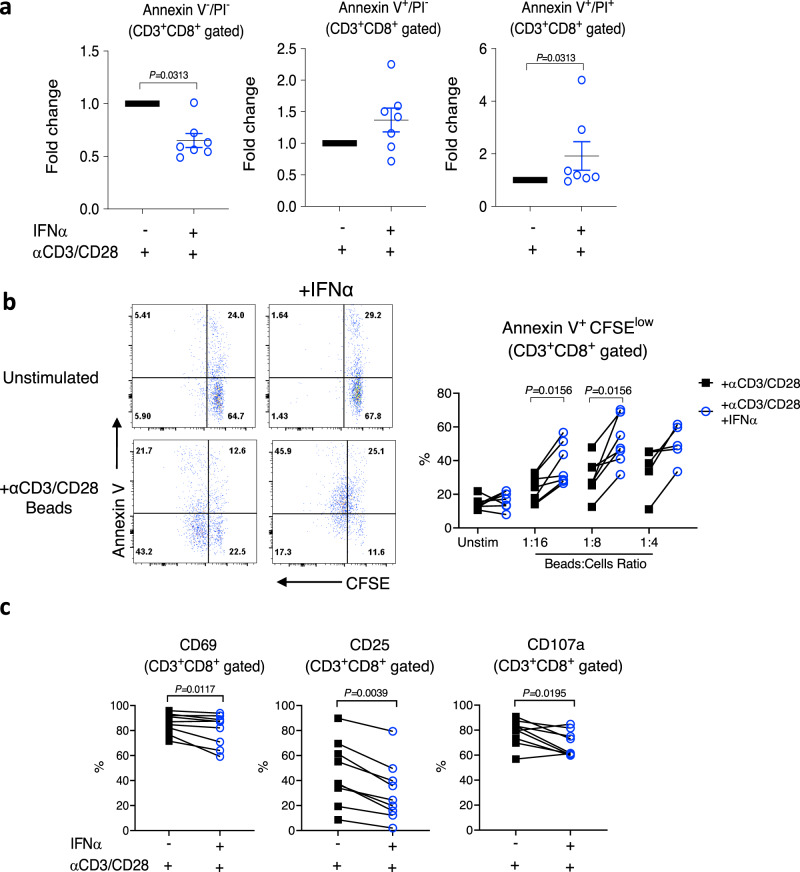
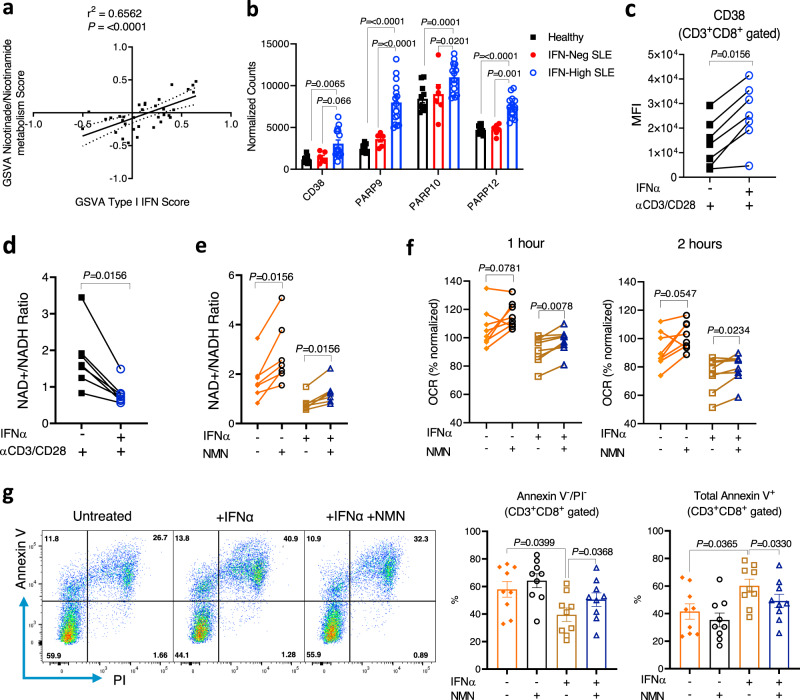
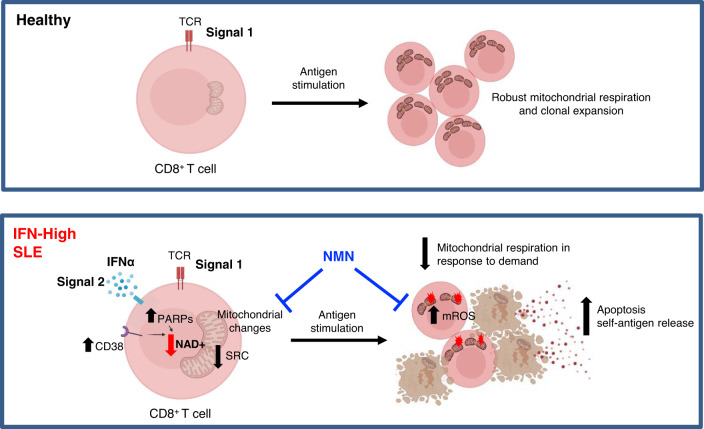
The majority of patients with systemic lupus erythematosus (SLE) have high expression of type I IFN-stimulated genes. Mitochondrial abnormalities have also been reported, but the contribution of type I IFN exposure to these changes is unknown. Here, we show downregulation of mitochondria-derived genes and mitochondria-associated metabolic pathways in IFN-High patients from transcriptomic analysis of CD4+ and CD8+ T cells. CD8+ T cells from these patients have enlarged mitochondria and lower spare respiratory capacity associated with increased cell death upon rechallenge with TCR stimulation. These mitochondrial abnormalities can be phenocopied by exposing CD8+ T cells from healthy volunteers to type I IFN and TCR stimulation. Mechanistically these 'SLE-like' conditions increase CD8+ T cell NAD+ consumption resulting in impaired mitochondrial respiration and reduced cell viability, both of which can be rectified by NAD+ supplementation. Our data suggest that type I IFN exposure contributes to SLE pathogenesis by promoting CD8+ T cell death via metabolic rewiring.


Conflict of interest statement

The authors declare no competing interests.

Figures

Fig. 1
Fig. 1. Transcriptomic analyses of CD8+ T and CD4+ T cells from healthy volunteers and patients with SLE.
a, b Unsupervised hierarchical clustering of all differentially expressed genes in CD4+ and CD8+ T cells between HC and SLE patients. a In CD4+ T cells, SLE-1 (active SLE n = 2, inactive SLE n = 8) and SLE-2 (active SLE n = 7, inactive SLE n = 7). b In CD8+ T cells, SLE-1 (active SLE n = 4, inactive SLE n = 9) and SLE-2 (active SLE n = 8, inactive SLE n = 7). HC healthy control. c, d Volcano plots from RNA-seq analysis showing ISGs and mtDNA-encoded oxidative phosphorylation (OXPHOS) genes as the most differentially expressed genes in CD4+ (c) and CD8+ T (d) cells between SLE-1 and SLE-2 groups. Blue dots indicate type I IFN-inducible genes and red dots indicate mitochondria-encoded OXPHOS genes.
Fig. 2
Fig. 2. Mitochondrial changes in total CD8+ T cells from patients with SLE.
Gated CD8+ T cells were stained with a MitoTracker green (MTG) (HC n = 20; IFN-Neg n = 8; IFN-High n = 13; RA n = 7); b membrane potential dependent-Mitotracker Deep Read (MTDR) (HC n = 20; IFN-Neg n = 8; IFN-High n = 13; RA n = 7); c Tetramethylrhodamine (TMRM). (HC n = 22; IFN-Neg n = 12; IFN-High n = 13; RA n = 5); Mean fluorescence intensity (MFI) data are shown. d Proportions of CD8+ T cells positive for cROS (cellROX Deep Red) and mROS (MitoSOX Red) are shown. (HC n = 22; IFN-Neg n = 12; IFN-High n = 13; RA n = 5); ad Data presented as mean ± S.E.M. Each symbol represents an individual. e, f Isolated CD8+ T cells from IFN-Neg and IFN-High SLE patients were mounted on poly-l-lysine-coated coverslips, fixed and stained for TOM20 (green), CD8 (red) and DAPI (blue) as described in “Methods” section. Representative SIM images derived from maximal projection analysis (e) and total mitochondrial volume (f) of three independent samples per condition, each with at least 14 cells analysed (range 14–43 cells per sample). Scale bars, 2 mm. Data presented as mean ± S.E.M. ad One-way ANOVA, f Two-tailed Mann–Whitney test; only significant differences are indicated. HC healthy controls, RA rheumatoid arthritis patients. Source data are for this figure provided as a Source Data file.
Fig. 3
Fig. 3. Metabolic analysis and apoptotic rate in CD8+ T cells from patients with SLE.
a Representative oxygen consumption rate (OCR) (left panels) and summary graphs (right panels) of sorted CD4+ and CD8+ T cells from controls, IFN-Neg and IFN-High SLE patients during a mitochondrial stress test. Spare respiratory capacity (SRC) was normalized to basal level of each individual. Oligomycin, carbonylcyanide p-trifluoromethoxyphenylhydrazone (FCCP), and rotenone/antimycin A (R/A) were added to the cells as indicated. Each symbol represents an individual (HC n = 12; IFN-Neg n = 7; IFN-High n = 8). b PBMCs from IFN-Neg and IFN-High SLE patients and HC were rested in culture for 48 h followed by staining with Annexin V and propidium iodide (PI). Representative flow cytometry plots of CD3+ CD8+ gated cells and summary graphs. Each symbol represents an individual (HC n = 11; IFN-Neg n = 11; IFN-High n = 12) a, b Data presented as mean ± S.E.M. One-way ANOVA, only significant differences are indicated, HC healthy controls. Source data for this figure are provided as a Source Data file.
Fig. 4
Fig. 4. Metabolic changes triggered by 7-day IFNα exposure and T cell activation.
a, b Purified CD8+ T cells from healthy donors treated with or without αCD3/CD28 beads in the presence or absence of 1000U/ml IFNα for 7 days. Mitochondria-encoded gene expression (n = 5–7) (a) and changes in mitotracker stainings (n = 6–7) (b) are shown. c, d PBMCs from healthy donors treated with or without αCD3/CD28 beads in the presence or absence of 1000U/ml IFNα for 7 days. CD8+ T cells were FACs-sorted and analysed using the extracellular flux assay. c Graphs showing the basal and maximal OCR levels under the different experimental conditions as indicated. Spare respiratory capacity (SRC) was normalized to basal level of each individual (n = 7–8). d Oxidative response of FACs-sorted CD8+ T cells upon re-stimulation with anti-CD3/CD28 beads or PMA/I injected during the extracellular flux assay. A representative graph (left panel) and levels (right panels) at different time points normalised to basal level of each individual are shown (n = 6). ad Data presented as mean ± S.E.M. Each symbol represents one donor. ac Two-tailed Wilcoxon matched-pairs signed rank test was utilized, d two-way ANOVA; only significant differences are indicated; MFI mean fluorescence intensity, MTG MitoTracker green, MTDR membrane potential dependent-Mitotracker Deep Read, MT-ND3 mitochondrially encoded NADH:Ubiquinone oxidoreductase core subunit 3, MT-CYTB mitochondrially encoded cytochrome B, PMA/I phorbol12-myristate13-acetate/Ionomycin. Source data for this figure are provided as a Source Data file.
Fig. 5
Fig. 5. Changes induced by 7-day exposure to IFNα and T cell activation.
PBMCs from HC were stimulated with αCD3/CD28 beads in the presence or absence of 1000U/ml of IFNα for 7 days. a αCD3/CD28 beads were removed from the culture and cells were left in culture for additional 48 h. Annexin V and propidium iodide (PI) staining of gated CD3+CD8+ cells was used to detect spontaneous cell death. Data shown are mean ± S.E.M of fold-change of each individual sample exposed to αCD3/CD28 beads only. Each dot represents one donor (n = 7). b, c αCD3/CD28 beads were removed from the culture and cells were rested overnight before labelling with CFSE and restimulation with αCD3/CD28 beads. b Representative flow plots of Annexin V staining and CFSE dilution (CD3+CD8+gated cells) at day 3 after re-stimulation (beads to cell ratio indicated). Percentages of Annexin V+CFSElowCD8+ T cells (n = 5–7). c Percentages of CD8+ T cells positive for CD69, CD25, and CD107a at 4 h of post restimulation (beads to cell ratio = 1:2). Each symbol represents one donor (n = 9). ac Two-tailed Wilcoxon matched-pairs signed rank test; only significant differences are indicated; HC healthy controls. Source data for this figure are provided as a Source Data file.
Fig. 6
Fig. 6. IFNα increases NAD+ consumption leading to reduced SCR and cell viability.
a Correlation between enrichment score for KEGG’s NAD metabolic pathway and Type I IFN signalling using GSVA package. Data obtained from the transcriptomic analysis of the SLE cohort. Pearson correlation coefficient (r2) and P-value are shown (n = 34). b Gene expression of NAD-consuming enzymes (CD38; PARP9, PARP10, and PARP12) in CD8+ T cells from IFN-Neg (n = 6), IFN-High (n = 15) SLE patients, and HC (n = 11). Normalized read counts are shown. c, d Purified CD8+ T cells from HC were treated with IL-2 (10U/ml) and αCD3/CD28 with or without 1000U/ml IFNα for 7 days. c CD38 expression was measured using flow cytometry. MFI is shown (n = 7). d NAD+/NADH ratio measured using NAD+/NADH Assay Kit (Abcam) (n = 7). eg Purified CD8+ T cells were stimulated as in c with or without addition of 1 mM NMN from day 3 to day 7. At day 7 CD8+ T cells were isolated and rested overnight. e NAD+/NADH ratio (n = 7). f OCR levels 1 and 2 h after restimulation with αCD3/CD28 beads injected during the extracellular flux assay under the different experimental conditions as indicated. Data normalized to basal level of each individual (n = 8). g Representative flow plots (left panels) of Annexin V and PI staining (CD3+CD8+gated cells) after αCD3/CD28 restimulation for 3 days are shown. Percentage of live cells (Annexin V/PI) and apoptotic cells (Annexin V+) under the different experimental conditions (right panels) are shown (n = 9). ag Data presented as mean ± S.E.M. Each symbol represents one donor. b Two-way ANOVA; cf Two-tailed Wilcoxon matched-pairs signed rank test was utilized; g Matched-pairs One-Way ANOVA; Only significant data are indicated; MFI mean fluorescence intensity, PARP poly(ADP-ribose) polymerases, NAD nicotinamide adenine dinucleotide, NMN β-Nicotinamide mononucleotide, OCR oxygen consumption ratio, PI propidium iodide. Source data for this figure are provided as a Source Data file.
Fig. 7
Fig. 7. Type I interferons modulate the metabolic fitness of CD8+ T cells in patients with SLE.
In HC, TCR signaling (signal 1) is essential for CD8+ T cell survival. In IFN-High SLE patients, persistent activation of the TCR (signal 1) and the type I IFNα pathways (signal 2) triggers mitochondrial changes via increasing NAD+ consumption in CD8+ T cells resulting in lower spare respiratory capacity (SRC) and thus decreased bioenergetic fitness. Upon increased energy demand such as in response to antigen challenge or stress, IFNα-stimulated CD8+ T cells are more prone to die, and this could perpetuate autoimmunity by increasing the autoantigen load. NAD+ supplementation with NMN restored the NAD+ pool, increased the mitochondrial respiration, decreased mROS, and improved cell viability upon TCR restimulation. Figure was created with BioRender.com.

Comment in

Similar articles

Cited by

References

    1. Crow MK. Advances in understanding the role of type I interferons in systemic lupus erythematosus. Curr. Opin. Rheumatol. 2014;26:467–474. doi: 10.1097/BOR.0000000000000087. - DOI - PMC - PubMed
    1. El-Sherbiny YM, et al. A novel two-score system for interferon status segregates autoimmune diseases and correlates with clinical features. Sci. Rep. 2018;8:5793. doi: 10.1038/s41598-018-24198-1. - DOI - PMC - PubMed
    1. Banchereau R, et al. Personalized immunomonitoring uncovers molecular networks that stratify lupus patients. Cell. 2016;165:551–565. doi: 10.1016/j.cell.2016.03.008. - DOI - PMC - PubMed
    1. Landolt-Marticorena C, et al. Lack of association between the interferon-alpha signature and longitudinal changes in disease activity in systemic lupus erythematosus. Ann. Rheum. Dis. 2009;68:1440–1446. doi: 10.1136/ard.2008.093146. - DOI - PubMed
    1. Hertzog P, Forster S, Samarajiwa S. Systems biology of interferon responses. J. Interferon Cytokine Res. 2011;31:5–11. doi: 10.1089/jir.2010.0126. - DOI - PubMed

Publication types

MeSH terms

Substances