

Specific collagens maintain the cuticle permeability barrier in Caenorhabditis elegans
- PMID: 33789349
- PMCID: PMC8045729
- DOI: 10.1093/genetics/iyaa047
Specific collagens maintain the cuticle permeability barrier in Caenorhabditis elegans
Abstract
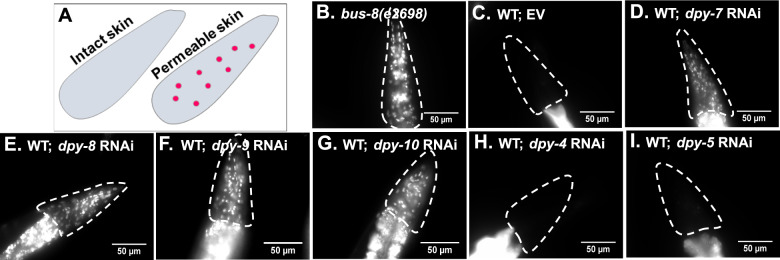
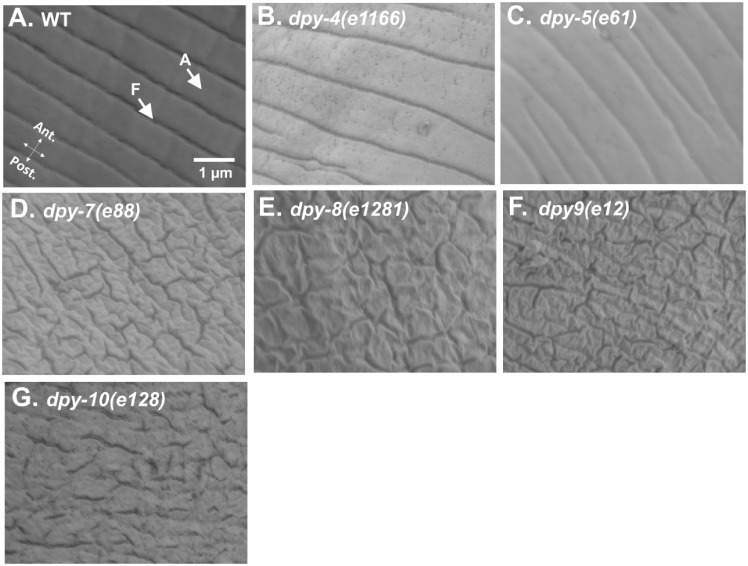
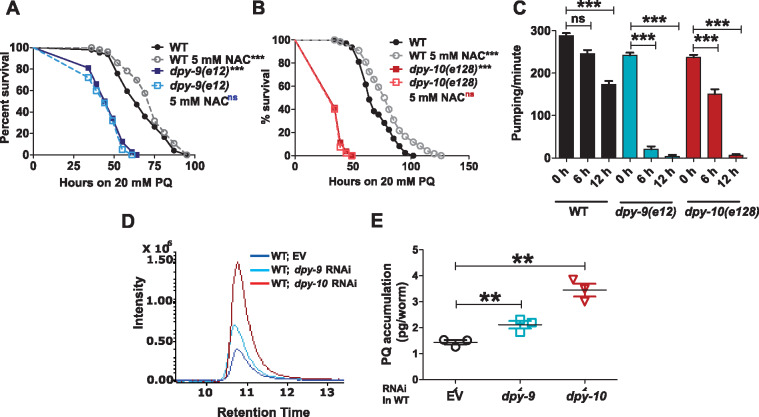
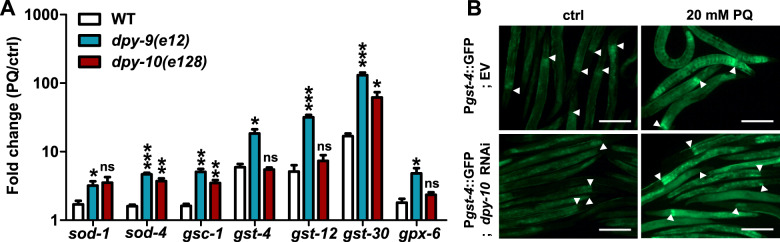
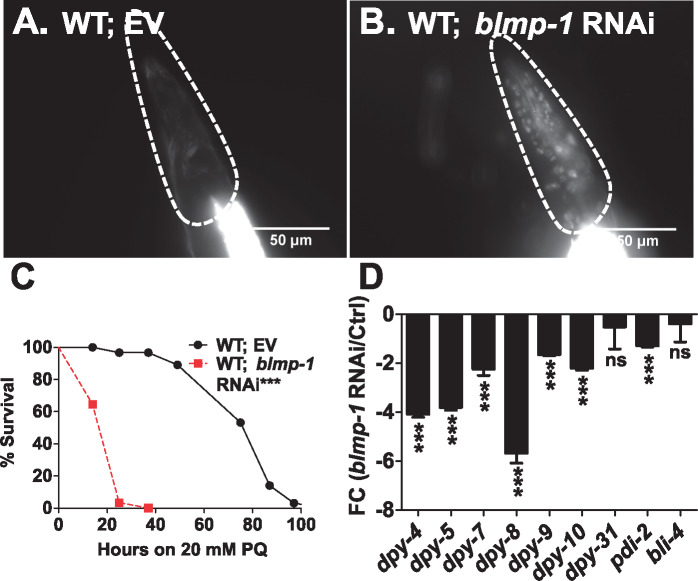
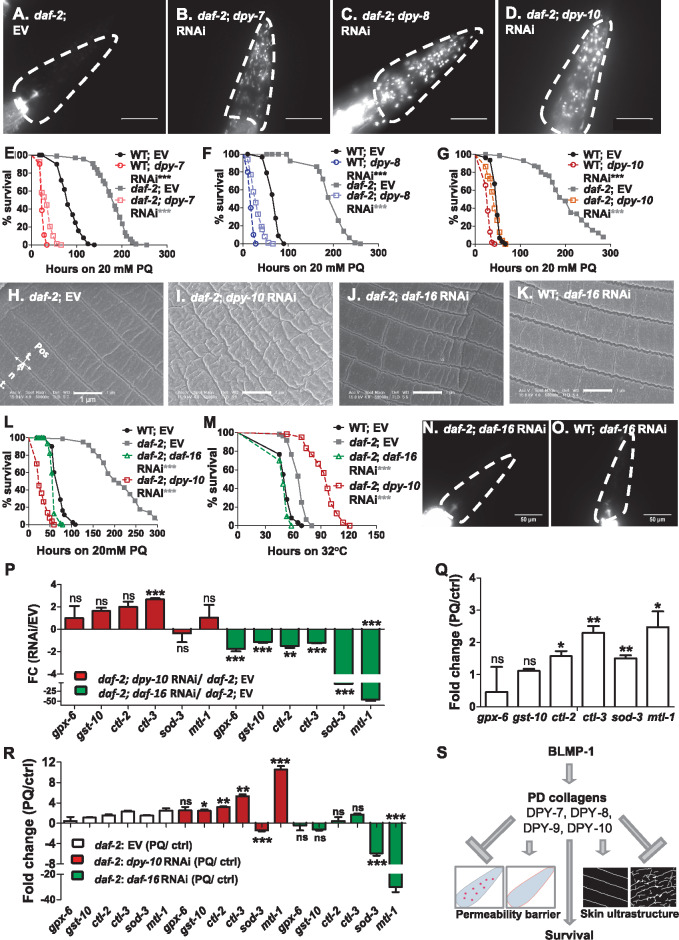
Collagen-enriched cuticle forms the outermost layer of skin in nematode Caenorhabditis elegans. The nematode's genome encodes 177 collagens, but little is known about their role in maintaining the structure or barrier function of the cuticle. In this study, we found six permeability determining (PD) collagens. Loss of any of these PD collagens-DPY-2, DPY-3, DPY-7, DPY-8, DPY-9, and DPY-10-led to enhanced susceptibility of nematodes to paraquat (PQ) and antihelminthic drugs- levamisole and ivermectin. Upon exposure to PQ, PD collagen mutants accumulated more PQ and incurred more damage and death despite the robust activation of antioxidant machinery. We find that BLMP-1, a zinc finger transcription factor, maintains the barrier function of the cuticle by regulating the expression of PD collagens. We show that the permeability barrier maintained by PD collagens acts in parallel to FOXO transcription factor DAF-16 to enhance survival of insulin-like receptor mutant, daf-2. In all, this study shows that PD collagens regulate cuticle permeability by maintaining the structure of C. elegans cuticle and thus provide protection against exogenous toxins.
Keywords: BLMP-1; Caenorhabditis elegans; collagens; cuticle; dumpy; hypodermis; oxidative stress; paraquat; permeability; survival.
© The Author(s) 2021. Published by Oxford University Press on behalf of Genetics Society of America.
Figures

Similar articles
-
Caenorhabditis elegans exoskeleton collagen COL-19: an adult-specific marker for collagen modification and assembly, and the analysis of organismal morphology.Dev Dyn. 2003 Mar;226(3):523-39. doi: 10.1002/dvdy.10259. Dev Dyn. 2003. PMID: 12619137
-
cis regulatory requirements for hypodermal cell-specific expression of the Caenorhabditis elegans cuticle collagen gene dpy-7.Mol Cell Biol. 1997 Apr;17(4):2301-11. doi: 10.1128/MCB.17.4.2301. Mol Cell Biol. 1997. PMID: 9121480 Free PMC article.
-
Collagen processing and cuticle formation is catalysed by the astacin metalloprotease DPY-31 in free-living and parasitic nematodes.Int J Parasitol. 2010 Apr;40(5):533-42. doi: 10.1016/j.ijpara.2009.10.007. Epub 2009 Oct 31. Int J Parasitol. 2010. PMID: 19883650
-
The cuticle of the nematode Caenorhabditis elegans: a complex collagen structure.Bioessays. 1994 Mar;16(3):171-8. doi: 10.1002/bies.950160307. Bioessays. 1994. PMID: 8166670 Review.
-
Collagens, modifying enzymes and their mutations in humans, flies and worms.Trends Genet. 2004 Jan;20(1):33-43. doi: 10.1016/j.tig.2003.11.004. Trends Genet. 2004. PMID: 14698617 Review.
Cited by
-
Body stiffness is a mechanical property that facilitates contact-mediated mate recognition in Caenorhabditis elegans.Curr Biol. 2023 Sep 11;33(17):3585-3596.e5. doi: 10.1016/j.cub.2023.07.020. Epub 2023 Aug 3. Curr Biol. 2023. PMID: 37541249 Free PMC article.
-
Uncovering the essential roles of glutamate carboxypeptidase 2 orthologs in Caenorhabditis elegans.Biosci Rep. 2024 Jan 31;44(1):BSR20230502. doi: 10.1042/BSR20230502. Biosci Rep. 2024. PMID: 38108122 Free PMC article.
-
The Caenorhabditis elegans Patched domain protein PTR-4 is required for proper organization of the precuticular apical extracellular matrix.Genetics. 2021 Nov 5;219(3):iyab132. doi: 10.1093/genetics/iyab132. Genetics. 2021. PMID: 34740248 Free PMC article.
-
Novel Role of Mammalian Cell Senescence-Sustenance of Muscle Larvae of Trichinella spp.Oxid Med Cell Longev. 2022 Nov 28;2022:1799839. doi: 10.1155/2022/1799839. eCollection 2022. Oxid Med Cell Longev. 2022. PMID: 36478989 Free PMC article.
-
The conserved endocannabinoid anandamide modulates olfactory sensitivity to induce hedonic feeding in C. elegans.Curr Biol. 2023 May 8;33(9):1625-1639.e4. doi: 10.1016/j.cub.2023.03.013. Epub 2023 Apr 20. Curr Biol. 2023. PMID: 37084730 Free PMC article.
References
-
- Atchison WD, Geary TG, Manning B, VandeWaa EA, Thompson DP.. 1992. Comparative neuromuscular blocking actions of levamisole and pyrantel-type anthelmintics on rat and gastrointestinal nematode somatic muscle. Toxicol Appl Pharmacol. 112:133–143. - PubMed
-
- Beck CD, Rankin CH.. 1995. Heat shock disrupts long-term memory consolidation in Caenorhabditis elegans. Learn Mem. 2:161–177. - PubMed
Publication types
MeSH terms
Substances
Grants and funding
LinkOut - more resources
Full Text Sources
Other Literature Sources
Miscellaneous
