

Variable expression quantitative trait loci analysis of breast cancer risk variants
- PMID: 33785833
- PMCID: PMC8009949
- DOI: 10.1038/s41598-021-86690-5
Variable expression quantitative trait loci analysis of breast cancer risk variants
Abstract
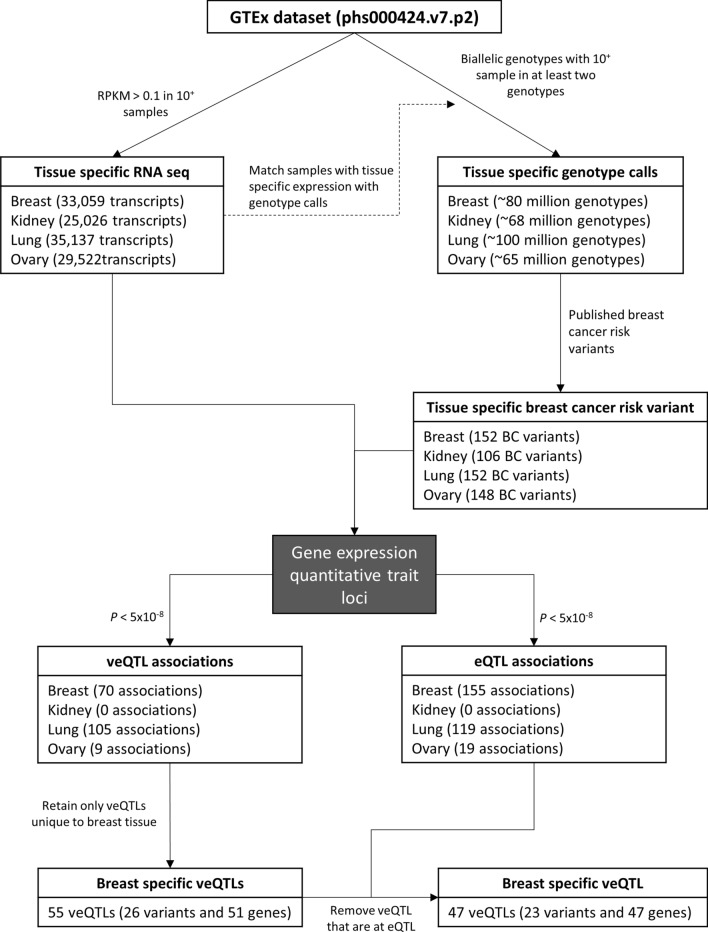
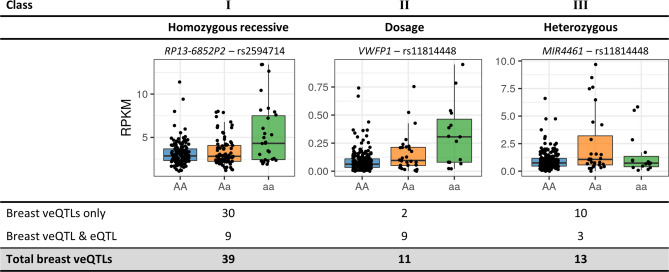
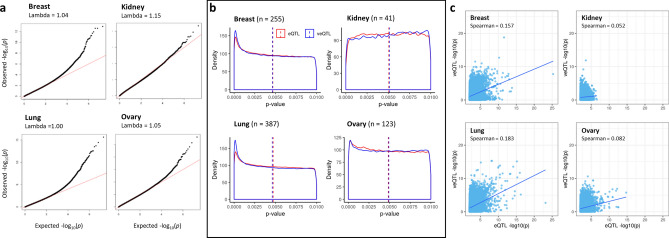
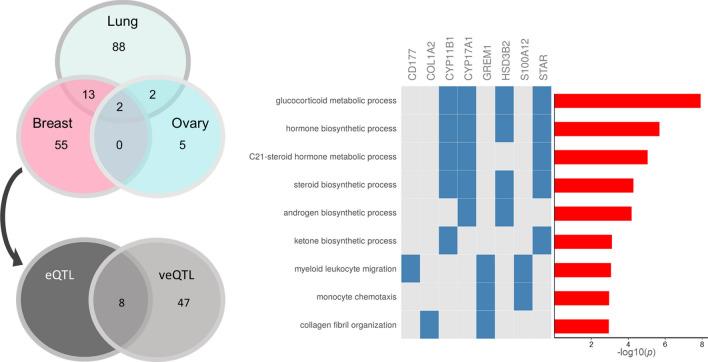
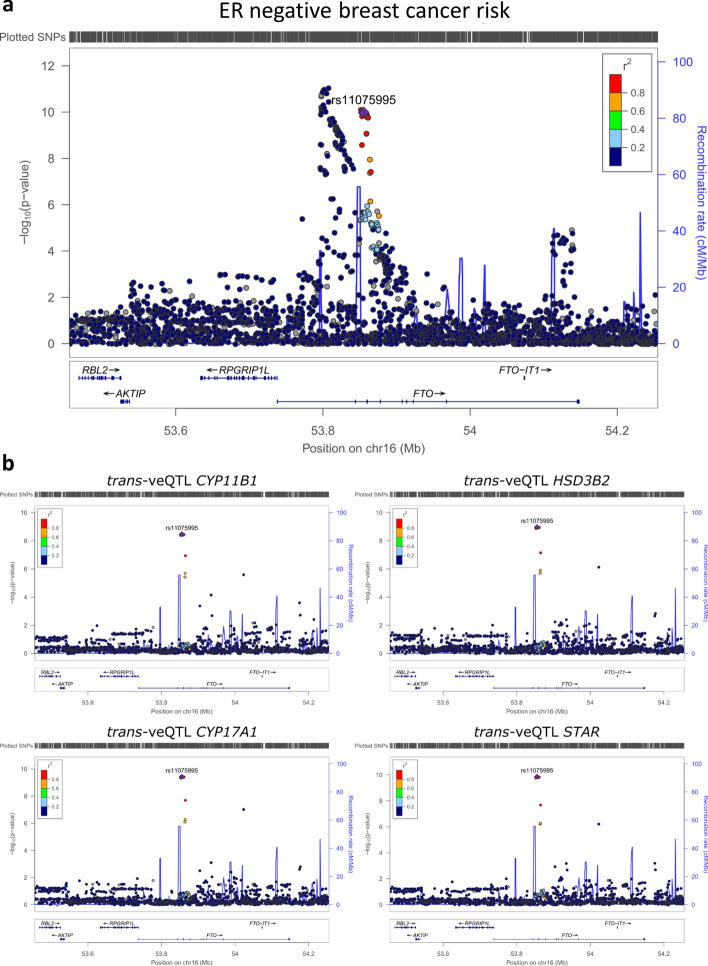
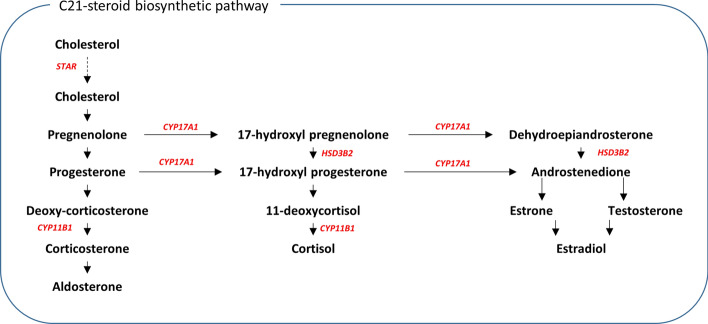
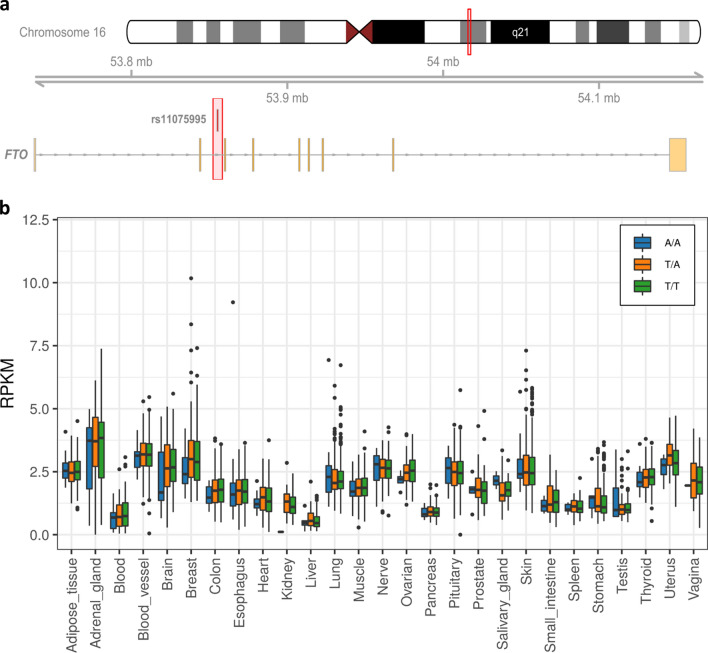
Genome wide association studies (GWAS) have identified more than 180 variants associated with breast cancer risk, however the underlying functional mechanisms and biological pathways which confer disease susceptibility remain largely unknown. As gene expression traits are under genetic regulation we hypothesise that differences in gene expression variability may identify causal breast cancer susceptibility genes. We performed variable expression quantitative trait loci (veQTL) analysis using tissue-specific expression data from the Genotype-Tissue Expression (GTEx) Common Fund Project. veQTL analysis identified 70 associations (p < 5 × 10⁻⁸) consisting of 60 genes and 27 breast cancer risk variants, including 55 veQTL that were observed in breast tissue only. Pathway analysis of genes associated with breast-specific veQTL revealed an enrichment of four genes (CYP11B1, CYP17A1 HSD3B2 and STAR) involved in the C21-steroidal biosynthesis pathway that converts cholesterol to breast-related hormones (e.g. oestrogen). Each of these four genes were significantly more variable in individuals homozygous for rs11075995 (A/A) breast cancer risk allele located in the FTO gene, which encodes an RNA demethylase. The A/A allele was also found associated with reduced expression of FTO, suggesting an epi-transcriptomic mechanism may underlie the dysregulation of genes involved in hormonal biosynthesis leading to an increased risk of breast cancer. These findings provide evidence that genetic variants govern high levels of expression variance in breast tissue, thus building a more comprehensive insight into the underlying biology of breast cancer risk loci.
Conflict of interest statement
The authors declare no competing interests.
Figures
Similar articles
-
A Comprehensive cis-eQTL Analysis Revealed Target Genes in Breast Cancer Susceptibility Loci Identified in Genome-wide Association Studies.Am J Hum Genet. 2018 May 3;102(5):890-903. doi: 10.1016/j.ajhg.2018.03.016. Am J Hum Genet. 2018. PMID: 29727689 Free PMC article.
-
Identification of candidate causal variants and target genes at 41 breast cancer risk loci through differential allelic expression analysis.Sci Rep. 2024 Sep 28;14(1):22526. doi: 10.1038/s41598-024-72163-y. Sci Rep. 2024. PMID: 39341862 Free PMC article.
-
eQTL Colocalization Analyses Identify NTN4 as a Candidate Breast Cancer Risk Gene.Am J Hum Genet. 2020 Oct 1;107(4):778-787. doi: 10.1016/j.ajhg.2020.08.006. Epub 2020 Aug 31. Am J Hum Genet. 2020. PMID: 32871102 Free PMC article.
-
Integrative eQTL-based analyses reveal the biology of breast cancer risk loci.Cell. 2013 Jan 31;152(3):633-41. doi: 10.1016/j.cell.2012.12.034. Cell. 2013. PMID: 23374354 Free PMC article. Review.
-
Inherited genetic susceptibility to breast cancer: the beginning of the end or the end of the beginning?Am J Pathol. 2013 Oct;183(4):1038-1051. doi: 10.1016/j.ajpath.2013.07.003. Epub 2013 Aug 23. Am J Pathol. 2013. PMID: 23973388 Review.
Cited by
-
Genetically predicted serum testosterone and risk of gynecological disorders: a Mendelian randomization study.Front Endocrinol (Lausanne). 2023 Nov 21;14:1161356. doi: 10.3389/fendo.2023.1161356. eCollection 2023. Front Endocrinol (Lausanne). 2023. PMID: 38075074 Free PMC article.
-
Imagine beyond: recent breakthroughs and next challenges in mammary gland biology and breast cancer research.J Mammary Gland Biol Neoplasia. 2023 Jul 14;28(1):17. doi: 10.1007/s10911-023-09544-y. J Mammary Gland Biol Neoplasia. 2023. PMID: 37450065 Free PMC article. Review.
-
The Effect of Caspase 8, 9 Gene Polymorphisms on Non-Hodgkin Lymphoma Susceptibility and Clinical/Pathological Features.Asian Pac J Cancer Prev. 2022 Dec 1;23(12):4339-4346. doi: 10.31557/APJCP.2022.23.12.4339. Asian Pac J Cancer Prev. 2022. PMID: 36580018 Free PMC article.
-
Accounting for nonlinear effects of gene expression identifies additional associated genes in transcriptome-wide association studies.Hum Mol Genet. 2022 Jul 21;31(14):2462-2470. doi: 10.1093/hmg/ddac015. Hum Mol Genet. 2022. PMID: 35043938 Free PMC article.
References
MeSH terms
LinkOut - more resources
Full Text Sources
Other Literature Sources
Medical
Research Materials
