. 2021 Mar;11(3):e360.
doi: 10.1002/ctm2.360.

Novel circular RNA circSOBP governs amoeboid migration through the regulation of the miR-141-3p/MYPT1/p-MLC2 axis in prostate cancer

Affiliations

Novel circular RNA circSOBP governs amoeboid migration through the regulation of the miR-141-3p/MYPT1/p-MLC2 axis in prostate cancer

Fan Chao et al. Clin Transl Med. 2021 Mar.

Abstract

Background: Metastatic prostate cancer is a fatal disease despite multiple new approvals in recent years. Recent studies revealed that circular RNAs (circRNAs) can be involved in cancer metastasis. Defining the role of circRNAs in prostate cancer metastasis and discovering therapeutic targets that block cancer metastasis is of great significance for the treatment of prostate cancer.

Methods: The circSOBP levels in prostate cancer (PCa) were determined by qRT-PCR. We evaluated the function of circSOBP using a transwell assay and nude mice lung metastasis models. Immunofluorescence assay and electron microscopic assay were applied to determine the phenotypes of prostate cancer cells' migration. We used fluorescence in situ hybridization assay to determine the localization of RNAs. Dual luciferase and rescue assays were applied to verify the interactions between circSOBP, miR-141-3p, MYPT1, and phosphomyosin light chain (p-MLC2).

Results: We observed that circSOBP level was significantly lower in PCa specimens compared with adjacent noncancerous prostate specimens, and was correlated with the grade group of PCa. Overexpression of circSOBP suppressed PCa migration and invasion in vitro and metastasis in vivo. CircSOBP depletion increased migration and invasion and induced amoeboid migration of PCa cells. Mechanistically, circSOBP bound miR-141-3p and regulated the MYPT1/p-MLC2 axis. Moreover, the depletion of MYPT1 reversed the inhibitory effect of circSOBP on the migration and invasion of PCa cells. Complementary intronic Alu elements induced but were not necessary for the formation of circSOBP. The nuclear export of circSOBP was mediated by URH49.

Conclusion: Our results suggest that circSOBP suppresses amoeboid migration of PCa cells and inhibits migration and invasion through sponging miR-141-3p and regulating the MYPT1/p-MLC2 axis.

Keywords: amoeboid migration; circRNA; circSOBP; metastasis; prostate cancer.


Conflict of interest statement

The authors declare that they have no conflict of interest.

Figures
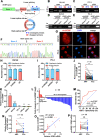
FIGURE 1
FIGURE 1
The characteristics of the circular RNA circSOBP. (A) Schematic illustration of the origin of circSOBP. Blue triangles indicate the convergent primers that amplify the linear sequence of circSOBP. Red triangles indicate the divergent primers that amplify the backsplice site of circSOBP. (B) and (C) Divergent and convergent primers were used to detect circSOBP by PCR in cDNA and gDNA of DU145 and PC‐3 cell lines. (D) and (E) CircSOBP and SOBP mRNA were detected using PCR in RNase R treated total RNAs of DU145 and PC‐3 cell lines. (F) Sanger sequencing of the backsplicing site of circSOBP. (G) The FISH assay was used to detect the subcellular localization of circSOBP (red), combined with nuclei staining using DAPI (blue). Scale bar, 30 μm. (H) and (I) Abundance of circSOBP in the nuclear and cytoplasmic fractions of DU145 and PC‐3 cells, analyzed using qRT‐PCR. GAPDH mRNA, and U6 acted as a positive control. The data are presented as the mean ± SD. (J) Expression of circSOBP in ANP and PCa tissues of 56 patients was analyzed by qRT‐PCR. **< .01, Wilcoxon matched‐pairs signed‐rank test, n = 56. (K) Expression of circSOBP in prostate epithelial and PCa cell lines was analyzed by qRT‐PCR. The data are presented as the mean ± SD. ***< .001 versus RWPE‐1 cells, one‐way ANOVA and Dunnett's multiple comparisons test, n = 3. (L) The percentage of upregulated or downregulated expression of circSOBP in 56 patients. (M) The ROC curve in distinguishing PCa and ANP tissues by the expression of circSOBP. (N) Expression of SOBP mRNA in ANP and PCa tissues of 14 patients was analyzed by qRT‐PCR. * P < .05, Wilcoxon matched‐pairs signed‐rank test, n = 14. (O) Scatter plot of the correlation between the expression of circSOBP and SOBP mRNA. Linear regression model, R 2 = 0.7618, P < .0001. (P) Ratio of the expression of circSOBP and SOBP mRNA in ANP and PCa tissues of 14 patients. Paired t‐test, n = 14. NS, not significant
FIGURE 2
FIGURE 2
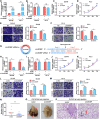
Effects of forced circSOBP expression on viability, migration, and invasion of PCa cells. (A) and (B) Expression of circSOBP and SOBP mRNA in circSOBP‐overexpressing DU145 and PC‐3 cells analyzed by qRT‐PCR. The data are presented as the mean ± SD. ***< .001, Student's t‐test, n = 3. (C) and (D) Effect of overexpression of circSOBP on cell viability of DU145 and PC‐3 cells. The data are presented as the mean ± SD. Student's t‐test, n = 3. (E) and (F) Effect of overexpression of circSOBP on migration and invasion of DU145 and PC‐3 cells. Scale bar, 100 μm. The data are presented as the mean ± SD. **< .01, Student's t‐test, n = 3. (G) Schematic illustration of the specific siRNA targeting the backsplicing site of circSOBP. (H) and (I) Expression of circSOBP and SOBP mRNA in circSOBP‐depleted DU145 and PC‐3 cells analyzed by qRT‐PCR. The data are presented as the mean ± SD. **< .01, Student's t‐test, n = 3. (J) and (K) Effect of circSOBP depletion on cell viability of DU145 and PC‐3 cells. The data are presented as the mean ± SD. Student's t‐test, n = 3. (L) and (M) Effect of circSOBP depletion on migration and invasion of DU145 and PC‐3 cells. Scale bar, 100 μm. The data are presented as the mean ± SD. *< .05, **< .01, ***< .001, Student's t‐test, n = 3. (N) Effect of circSOBP overexpression on the numbers of lung metastatic nodules of nude mice. Black lines in the middle of the dots depict the median. **< .01, Mann–Whitney test, n = 10. (O) Metastatic nodules in the mouse lungs. Red arrows indicate the metastatic nodules. (P) Hematoxylin‐eosin staining of the metastatic nodules. Scale bar, 50 μm. Red arrows indicate the metastatic nodules. NC, normal control. NS, not significant
FIGURE 3
FIGURE 3
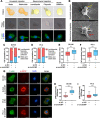
Depletion of circSOBP induces amoeboid features of PCa cells. (A) The morphology of cells undergoing mesenchymal migration or amoeboid migration on the Matrigel matrix. Scale bar, 20 μm. (B) Electron microscopic images of cells undergoing mesenchymal and amoeboid migration on the Matrigel matrix. The yellow arrow indicates a stable bleb. The red arrow indicates filopodia. Scale bar, 30 μm. (C) and (D) The percentage of circSOBP‐depleted DU145 and PC‐3 cells undergoing different phenotypes of migration on the Matrigel matrix compared with control cells. *< .05, ***< .001, Fisher's exact test. (E) and (F) Cell roundness of circSOBP‐depleted DU145 and PC‐3 cells. Boxplots depict median, 25th and 75th percentile, min‐max whiskers. ***< .001, Mann–Whitney test, n = 3. (G) The morphology of circSOBP‐depleted DU145 and PC‐3 cells analyzed using immunofluorescence assay, representative images. Scale bar, 20 μm. (H) and (I) Quantification of p‐MLC2 expression from immunofluorescence assay. Boxplots depict median, 25th and 75th percentile, min‐max whiskers. ***< .001, Mann–Whitney test, n = 3. NC, normal control
FIGURE 4
FIGURE 4
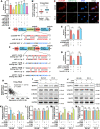
CircSOBP regulates the MYPT1/p‐MLC2 axis by sponging miR‐141‐3p. (A) Dual‐luciferase assay was used to identify the direct interaction between circSOBP and six predicted miRNAs. The data are presented as the mean ± SD. *< .05 versus miR‐NC, one‐way ANOVA and Dunnett's multiple comparisons test, n = 3. (B) Expression of miR‐141‐3p in PCa and normal tissues in TCGA database. Boxplot depicts median, 25th and 75th percentile, min‐max whiskers. ***< .001, Mann–Whitney test. (C) The FISH assay was used to identify the subcellular colocalization of circSOBP (red) and miR‐141‐3p (green), combined with nuclei staining using DAPI (blue). Scale bar, 30 μm. (D) Wild‐type and mutated binding site of miR‐141‐3p in circSOBP. (E) Dual‐luciferase assay was used to identify the direct interaction between circSOBP and miR‐141‐3p. The data are presented as the mean ± SD. **< .01, Student's t‐test, n = 3. (F) Binding sites of miR‐141‐3p and their mutants in 3’UTR of MYPT1 mRNA. (G) Dual‐luciferase assay was used to identify the direct interaction between the 3’‐UTR of MYPT1 mRNA and miR‐141‐3p. The data are presented as the mean ± SD. *< .05, Student's t‐test, n = 3. (H) Correlation between the expression of miR‐141‐3p and MYPT1 mRNA in the TCGA‐PRAD database. (I) Effect of circSOBP overexpression on the expression of related proteins of DU145 and PC‐3 cells. (J) Effect of circSOBP depletion on the expression of related proteins of DU145 and PC‐3 cells. (K)‐(N) Densimetric analysis of the blots in (I) and (J), n = 3 independent experiments, GAPDH was used as the loading control. The data are presented as the mean ± SD. *< .05, **< .01, Student's t‐test. MUT, mutant. NC, normal control. NS, not significant. WT, wild type
FIGURE 5
FIGURE 5
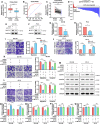
Depletion of MYPT1 reverses the inhibitory effect of circSOBP on PCa migration and invasion. (A) Expression of circSOBP in PCa and normal tissues from the TCGA database. Boxplot depicts median, 25th and 75th percentile, min‐max whiskers. ***< .001, Mann–Whitney test. (B) The ROC curve in distinguishing PCa and ANP tissues by the expression of MYPT1. (C) Differential expression of circSOBP in 52 paired PCa and normal tissues from the TCGA database. ***< .001, Wilcoxon matched‐pairs signed‐rank test. (D) The percentage of upregulated or downregulated expression of MYPT1 in 52 patients. (E) and (F) Efficacy of siRNA targeting MYPT1, analyzed using Western blot. (G) and (H) Densimetric analysis of the blots in (E) and (F), n = 3 independent experiments, GAPDH was used as a loading control. The data are presented as the mean ± SD. *< .05, Student's t‐test, n = 3. (I) and (J) Effect of MYPT1 depletion on migration and invasion of DU145 and PC‐3 cell lines. The data are presented as the mean ± SD. **< 0.01, ***< .001, Student's t‐test, n = 3. (K) and (L) Effect of upregulated circSOBP accompanied by suppressing MYPT1 on migration and invasion of DU145 and PC‐3 cell lines. Scale bar, 100 μm. The data are presented as the mean ± SD. **< .01, ***< .001, one‐way ANOVA and Tukey's multiple comparisons test, n = 3. (M) Effect of upregulated circSOBP accompanied by suppressing MYPT1 on the expression of related proteins of DU145 and PC‐3 cells. (N)‐(Q) Densimetric analysis of the blots in (M), n = 3 independent experiments, GAPDH was used as the loading control. The data are presented as the mean ± SD. *< .05, **< .01, Student's t‐test. NC, normal control. NS, not significant
FIGURE 6
FIGURE 6
The circularization and nuclear export of circSOBP. (A) Alignment of Alu Sz and Alu Sq which were located on the flanking introns of circSOBP. (B) Schematic illustration of the plasmid constructions which were used to investigate the circularization of circSOBP. (C) Effect of the deletions of Alu sequences and flanking introns on the circularization of circSOBP analyzed using divergent primers. The data are presented as the mean ± SD. ***< .001 comparing with vector, ###< .001 comparing with #1, one‐way ANOVA and Dunnett's multiple comparisons test, n = 3. (D) Effect of the deletions of Alu sequences and flanking introns on the expression of the linear sequence of circSOBP analyzed using convergent primers. The data are presented as the mean ± SD. ***< .001 comparing with vector, one‐way ANOVA, and Dunnett's multiple comparisons test, n = 3. (E) and (F) Efficacy of URH49 depletion using siRNA in DU145 and PC‐3 cell lines. The data are presented as the mean ± SD. *** < .001, Student's t‐test, n = 3. (G) and (H) Effect of URH49 depletion on the subcellular distribution of circSOBP in DU145 and PC‐3 cells, analyzed using circRNA FISH assay. (I) and (J) Effect of URH49 depletion on the subcellular distribution of circSOBP in DU145 and PC‐3 cells, analyzed using qRT‐PCR. The data are presented as the mean ± SD. ***< .001, Student's t‐test, n = 3. NC, normal control. NS, not significant
FIGURE 7
FIGURE 7
Schematic illustration of the mechanism of circSOBP regulating amoeboid migration of PCa cells. CircSOBP functioned as a sponge for miR‐141‐3p, and in turn upregulated the expression of MYPT1, which dephosphorylate p‐MLC2. This pathway governed the amoeboid migration of PCa cells

Similar articles

Cited by

References

    1. Siegel RL, Miller KD, Jemal A. Cancer statistics, 2020. CA Cancer J Clin. 2020;70(1):7‐30. - PubMed
    1. Sartor O, de Bono JS. Metastatic prostate cancer. N Engl J Med. 2018;378(7):645‐657. - PubMed
    1. Steeg PS. Targeting metastasis. Nat Rev Cancer. 2016;16(4):201‐218. - PMC - PubMed
    1. Hanahan D, Weinberg RA. Hallmarks of cancer: the next generation. Cell. 2011;144(5):646‐674. - PubMed
    1. Guan X. Cancer metastases: challenges and opportunities. Acta Pharm Sin B. 2015;5(5):402‐418. - PMC - PubMed

Publication types

MeSH terms

LinkOut - more resources