. 2021 Apr 6;118(14):e2021770118.
doi: 10.1073/pnas.2021770118.

miR- 218- 2 regulates cognitive functions in the hippocampus through complement component 3-dependent modulation of synaptic vesicle release

Affiliations

miR- 218- 2 regulates cognitive functions in the hippocampus through complement component 3-dependent modulation of synaptic vesicle release

Si-Yao Lu et al. Proc Natl Acad Sci U S A. .

Abstract

microRNA-218 (miR-218) has been linked to several cognition related neurodegenerative and neuropsychiatric disorders. However, whether miR-218 plays a direct role in cognitive functions remains unknown. Here, using the miR-218 knockout (KO) mouse model and the sponge/overexpression approaches, we showed that miR-218-2 but not miR-218-1 could bidirectionally regulate the contextual and spatial memory in the mice. Furthermore, miR-218-2 deficiency induced deficits in the morphology and presynaptic neurotransmitter release in the hippocampus to impair the long term potentiation. Combining the RNA sequencing analysis and luciferase reporter assay, we identified complement component 3 (C3) as a main target gene of miR-218 in the hippocampus to regulate the presynaptic functions. Finally, we showed that restoring the C3 activity in the miR-218-2 KO mice could rescue the synaptic and learning deficits. Therefore, miR-218-2 played an important role in the cognitive functions of mice through C3, which can be a mechanism for the defective cognition of miR-218 related neuronal disorders.

Keywords: C3; LTP; hippocampus; miR-218; synapse.


Conflict of interest statement

The authors declare no competing interest.

Figures
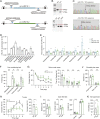
Fig. 1.
Fig. 1.
miR-218-2 KO mice show impaired learning and memory. (A) Illustration of sgRNA designed for miR-218-1 and miR-218-2 KO mice. The sgRNA-targeting sequences are underlined. (B, C) Genotyping (B) and Sanger-sequencing (C) analyses of miR-218-1 (Upper) and miR-218-2 (Lower) KO mice. For miR-218-1, expected fragment size is as follows: WT, 840 bp; KO, 479 bp. For miR-218-2, WT, 898 bp; KO, 612 bp. (D) qRT-PCR analysis of miR-218 expression in brain regions of WT mice. n = 3. (E) qRT-PCR analysis of miR-218 expression in brain regions of miR-218-1 KO and miR-218-2 KO mice. n = 6. (F) Percentage of freezing levels in the habituation, training context, novel context, and cued-tone FC test. WT, n = 14; KO, n = 13. (G) Analysis of MWM test. Average time spent to locate the submerged escape platform during the 7 d training session (Left). Average time spent in the four quadrant areas when the platform was absent (Right). T, target; L, left; R, right; O, opposite. n = 11. (H) Success rate of mice entering the right arm in the TM test. n = 8. (I) Total distance (Left), velocity (Middle), and time in the center/border zone (Right) in the OFT. WT, n = 17; KO, n = 14. (J) Total time spent in the closed arms and open arms of the EPM test. WT, n = 12; KO, n = 13. (K) Total immobile time in the TS test. n = 8. Student’s t test. *P < 0.05; **P < 0.001; error bars, SEM.
Fig. 2.
Fig. 2.
miR-218-2 KO mice show impaired excitatory synaptic transmission and LTP in the hippocampus. (A) Immunoblots (Left) and quantification (Right) of synaptic proteins in WT and miR-218-2 KO hippocampus neurons. n = 3. (B) mEPSCs in acutely dissected hippocampal slices from 4 wk old WT and miR-218-2 KO mice. Sample traces (Left); frequency (Middle); amplitude (Right). WT, n = 16; KO, n = 18. (C) Sample traces (Left) and ratio (Right) of EPSCAMPAR/EPSCNMDAR recorded in hippocampal slices. WT, n = 11; KO, n = 12. (D) Sample traces (Left) and quantitative analysis (Right) of PPF recordings at different intervals. WT, n = 15; KO, n = 12. (E) Sample traces (Left) and amplitude depression analysis (Right) of train-stimulation–evoked EPSCs. WT, n = 26; KO, n = 15. (F) RRP size of WT and KO hippocampal neurons. Cumulative charge transfer curve (Left). Dashed lines represent extrapolation of cumulative charge to the y-axis. RRP size represented by the intercept of the dashed line at the y-axis (Right), n = 21. (G) Representative traces of fEPSPs (Upper) and time course of the fEPSPs amplitude (Lower) before and after LTP induction by a TBS protocol. WT, n = 12; KO, n = 19. Student’s t test. *P < 0.05; **P < 0.001; error bars, SEM.
Fig. 3.
Fig. 3.
Overexpression of miR-218 in the hippocampus promotes learning and memory. (A and B) Investigation of miR-218 overexpression in the hippocampus. (A) Sample immunofluorescence images showing the expression of lentivirus-introduced EGFP. (Scale bar, 100 μm.) (B) qRT-PCR analysis of premiR-218 ×2 or control pLOX Syn-DsRed-Syn-GFP expression in the DG. n = 4. (C) Percentage of freezing levels in the habituation, training context, novel context, and cued-tone FC test. n = 8. (D) MWM test. Average time spent to locate the submerged escape platform during the 7 d training session (Left). Average time spent in the quadrant areas when the platform was absent (Right). T, target; L, left; R, right; O, opposite. Control, n = 9; premiR-218 ×2, n = 10. (E) Success rate of mice entering the right arm in the TM test. n = 9. (F) Sample traces (Left), frequency (Middle), and amplitude (Right) of mEPSCs recorded in cultured neurons. Control, n = 39, premiR-218 ×1, n = 25, premiR-218 ×2, n = 13. (G) Sample traces (Left) and ratio (Right) of EPSCAMPAR/EPSCNMDAR. Control, n = 10; ×1, n = 12; ×2, n = 12. (H) Sample traces (Left) and quantitative analysis (Right) of PPF recordings at different time intervals. Control, n = 9; ×1, n = 11; ×2, n = 13. (I) Train-evoked EPSCs. Sample traces (Left) and depression of EPSC amplitude (Right). Control, n = 34; ×1, n = 15; ×2, n = 30. (J) Analysis of RRP size. Control, n = 25; ×1, n = 27; ×2, n = 30. (K) Representative traces of fEPSPs (Upper) and time course of the fEPSPs amplitude (Lower) before and after LTP induction. Control, n = 20; ×2, n = 19. Student’s t test. *P < 0.05; **P < 0.001; error bars, SEM.
Fig. 4.
Fig. 4.
Morphological changes of neurons and synapses induced by miR-218-2 KO. (A) Representative Golgi-stained CA1 pyramidal neurons showing decreased total dendrite length and branch depth in miR-218-2 KO mice. (Scale bar, 30 μm.) (B, C) Average dendrite length (B) and dendritic complexity (C) per neuron. WT, n = 11; miR-218-2 KO, n = 10. (D) Representative images of dendritic branches from Golgi-stained CA1 pyramidal neurons. (Scale bar, 4 μm.) (E) Spine density of the dendrites of the pyramidal neurons in the hippocampal CA1 region. Apical: WT, n = 14; KO, n = 20. Basal: WT, n = 24; KO, n = 19. (F) Sample electron tomography images of presynaptic boutons. ET subvolumes of WT and miR-218-2 KO synapses (Upper). 3D models of synaptic profiles including orthogonal views of SV distribution (Lower). (Scale bar, 100 nm.) (GJ) Quantification of AZ area (G), SV number (H), SV diameter (I), and the number of SVs within 0 to 2 nm to the AZ (J). (K, L) Spatial distribution of SVs with 900 nm (K) and 100 nm (L) to the AZ. (GL) WT, n = 21; KO, n = 16. Student’s t test. *P < 0.05; **P < 0.001; error bars, SEM.
Fig. 5.
Fig. 5.
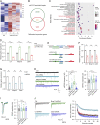
Identification of C3 as a target gene of miR-218 in hippocampal neurons. (AC) RNA-seq analysis of gene expression profiles in miR-218-2 KO hippocampal neurons. (A) Heat map of differentially expressed genes (false discovery rate no. 0.05, n = 2,275). (B) 872 genes are overlapped in the differentially expressed genes and the predicted miR-218 target genes. (C) KEGG analysis of the 872 genes. Red colored pathways were selected for further analysis. (D) qRT-PCR analysis of the expression of candidate genes in miR-218 overexpression and KO hippocampal neurons. n = 5. (E) Illustration of the reporter luciferase assay for the candidate target genes. (F) Relative luciferase activity by the candidate target genes. n = 5. (G) qRT-PCR analysis of the efficiency of C3, Mmp13, and Gdnf shRNAs. n = 3. (H) Sample traces (Left), frequency (Middle), and amplitude (Right) of mEPSCs recorded in cultured hippocampal neurons infected with lentivirus encoding the shRNAs for C3, Mmp13, or Gdnf. Control, n = 24; C3 shRNA, n = 24; Mmp13 shRNA, n = 20; Gdnf shRNA, n = 19. (I) Sample traces (Left) and amplitude of AP-evoked EPSCs. n = 20. (J) Sample traces (Left) and amplitude depression analysis (Right) of train-stimulation–evoked EPSCs. Control, n = 21; C3 shRNA, n = 19; Mmp13 shRNA, n = 17; Gdnf shRNA, n = 14. Student’s t test. *P < 0.05; **P < 0.001; error bars, SEM.
Fig. 6.
Fig. 6.
C3 is a target gene of miR-218 to regulate presynaptic functions and learning behaviors in mice. (A) Immunoblots (Left) and quantification (Right) of C3 in WT and miR-218-2 KO neurons. n = 3. (B) Sample traces (Left), frequency (Middle), and amplitude (Right) of mEPSCs recorded in hippocampal slices of WT mice treated with C3 peptide, or miR-218-2 KO slices treated with SB290157. WT, n = 23; WT + C3, n = 22; miR-218-2 KO, n = 19; KO + SB290157, n = 20. (C) Sample traces (Left) and ratio (Right) of EPSCAMPAR/EPSCNMDAR recorded in acute slices. WT, n = 11; WT + C3, n = 12; miR-218-2 KO, n = 11; KO + SB290157, n = 13. (D) Train-stimulation–evoked EPSCs. WT, n = 12; WT + C3, n = 15; miR-218-2 KO, n = 13; KO + SB290157, n = 14. (E) Sample traces of fEPSPs (Upper) and time course of the fEPSPs amplitude (Lower) before and after LTP induction. WT, n = 14; WT + C3, n = 24; miR-218-2 KO, n = 19; KO + SB290157, n = 31. (F) Percentage of freezing ratio in the FC test. WT, n = 12; C3, n = 12; miR-218-2 KO, n = 12; KO + SB290157, n = 11. (G) Analysis of MWM test. Average time spent to locate the submerged escape platform during the 7 d training session (Left); ANOVA. Average time spent in the four quadrant areas when the platform was absent (Right). WT, n = 9; C3, n = 7; miR-218-2 KO, n = 9; KO + SB290157, n = 9. Student’s t test. *P < 0.05; **P < 0.001; error bars, SEM.

Similar articles

Cited by

References

    1. Griggs E. M., Young E. J., Rumbaugh G., Miller C. A., MicroRNA-182 regulates amygdala-dependent memory formation. J. Neurosci. 33, 1734–1740 (2013). - PMC - PubMed
    1. Lin Q., et al. ., The brain-specific microRNA miR-128b regulates the formation of fear-extinction memory. Nat. Neurosci. 14, 1115–1117 (2011). - PubMed
    1. Vetere G., et al. ., Selective inhibition of miR-92 in hippocampal neurons alters contextual fear memory. Hippocampus 24, 1458–1465 (2014). - PubMed
    1. Zovoilis A., et al. ., microRNA-34c is a novel target to treat dementias. EMBO J. 30, 4299–4308 (2011). - PMC - PubMed
    1. Hansen K. F., Sakamoto K., Wayman G. A., Impey S., Obrietan K., Transgenic miR132 alters neuronal spine density and impairs novel object recognition memory. PLoS One 5, e15497 (2010). - PMC - PubMed

Publication types

LinkOut - more resources