

Identification of a Novel Four-Gene Signature Correlated With the Prognosis of Patients With Hepatocellular Carcinoma: A Comprehensive Analysis
- PMID: 33777771
- PMCID: PMC7994902
- DOI: 10.3389/fonc.2021.626654
Identification of a Novel Four-Gene Signature Correlated With the Prognosis of Patients With Hepatocellular Carcinoma: A Comprehensive Analysis
Abstract
Purpose: Hepatocellular carcinoma (HCC) is a common solid-tumor malignancy with high heterogeneity, and accurate prognostic prediction in HCC remains difficult. This analysis was performed to find a novel prognostic multigene signature.
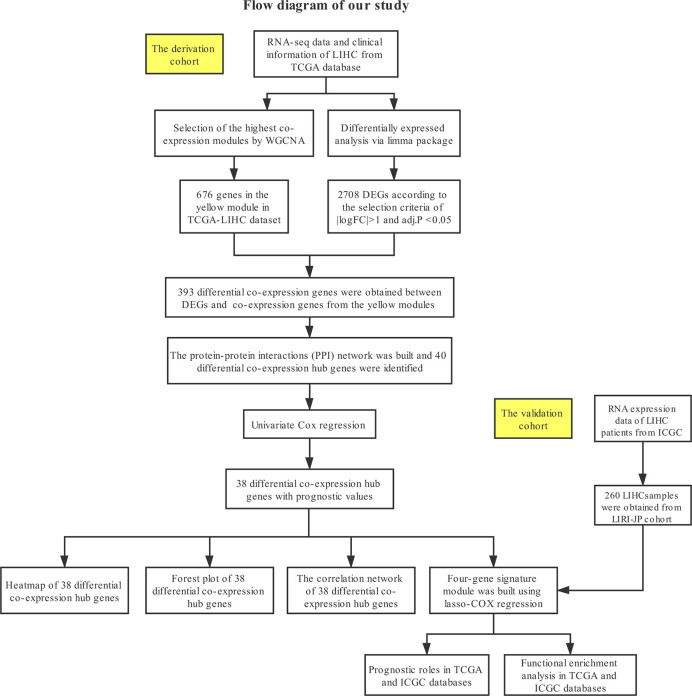
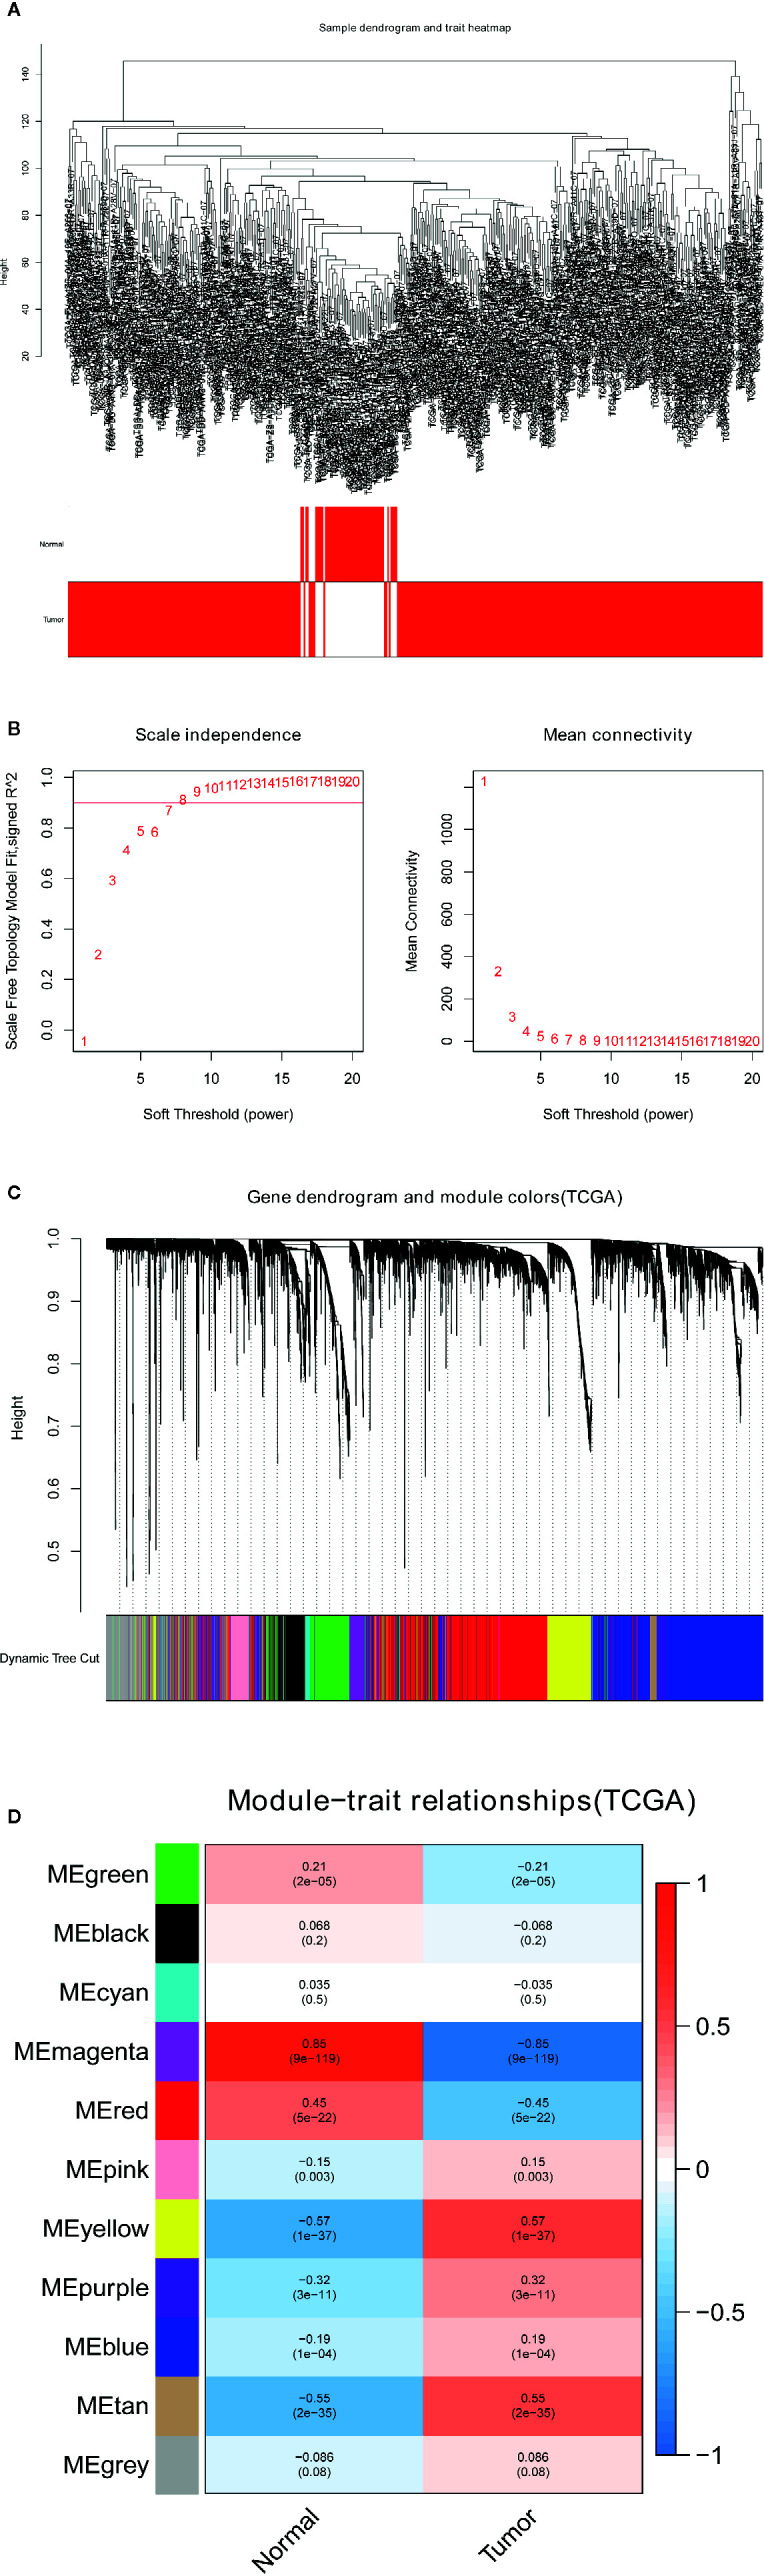
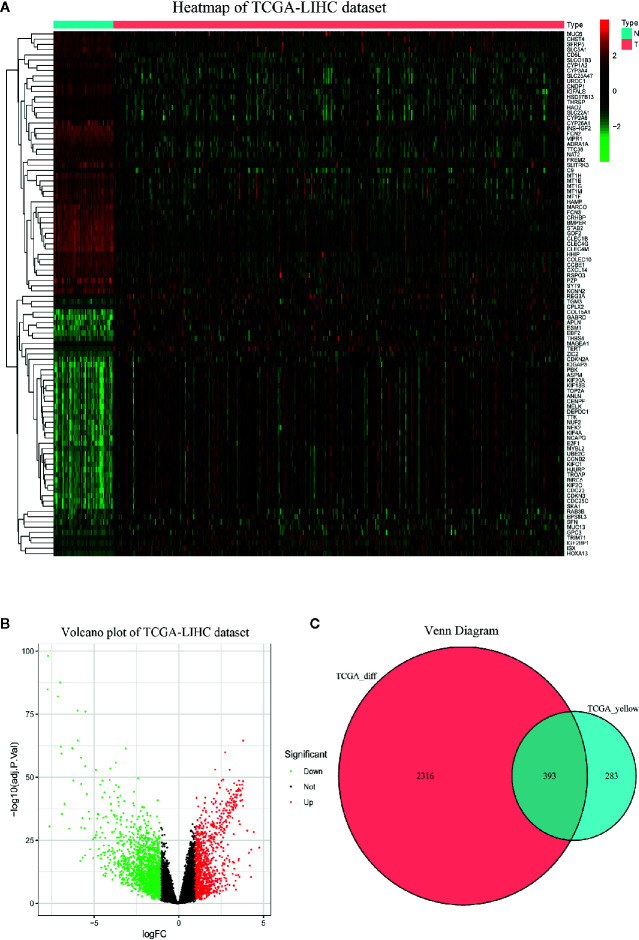
Methods: The TCGA-LIHC dataset was analyzed for differentially coexpressed genes through weighted gene coexpression network analysis (WGCNA) and differential gene expression analysis. A protein-protein interaction (PPI) network and univariate Cox regression analysis of overall survival (OS) were utilized to identify their prognostic value. Next, we used least absolute shrinkage and selection operator (LASSO) Cox regression to establish a prognostic module. Subsequently, the ICGC-LIRI-JP dataset was applied for further validation. Based on this module, HCC cases were stratified into high-risk and low-risk groups, and differentially expressed genes (DEGs) were identified. Functional enrichment analyses of these DEGs were conducted. Finally, single-sample gene set enrichment analysis (ssGSEA) was performed to explore the correlation between the prognostic signature and immune status.
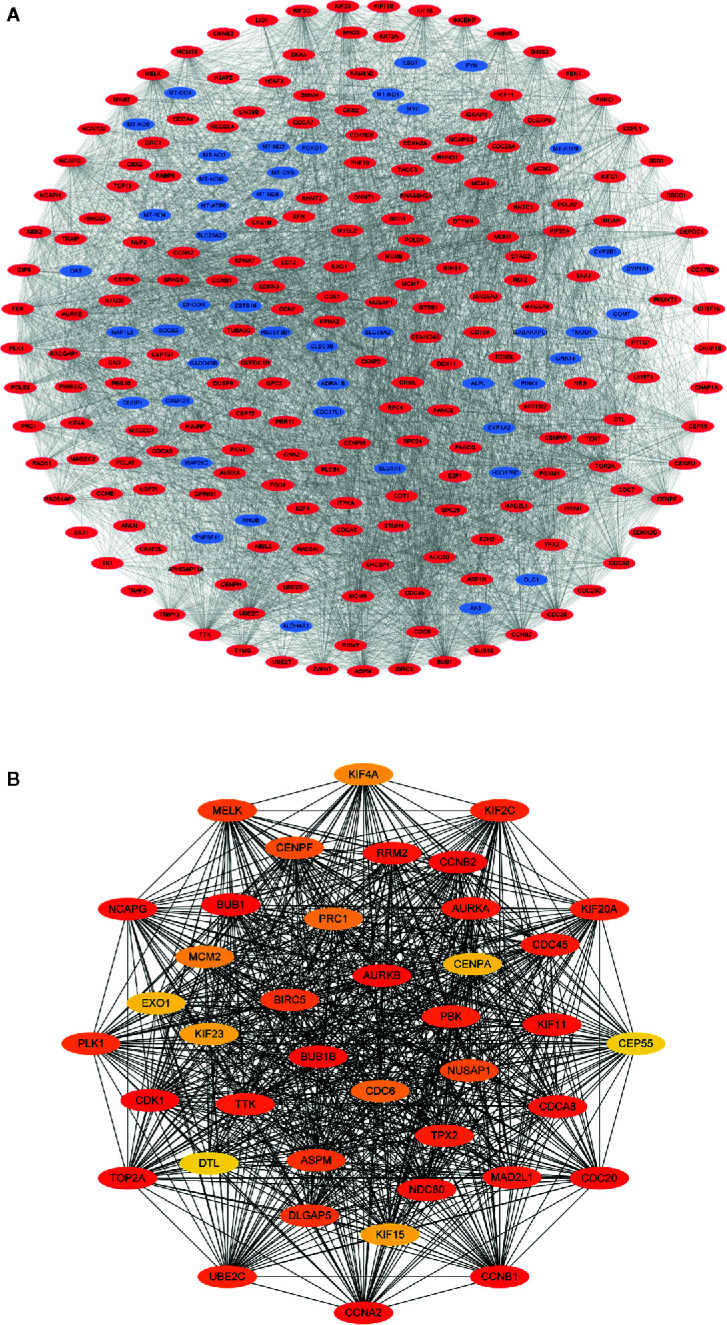
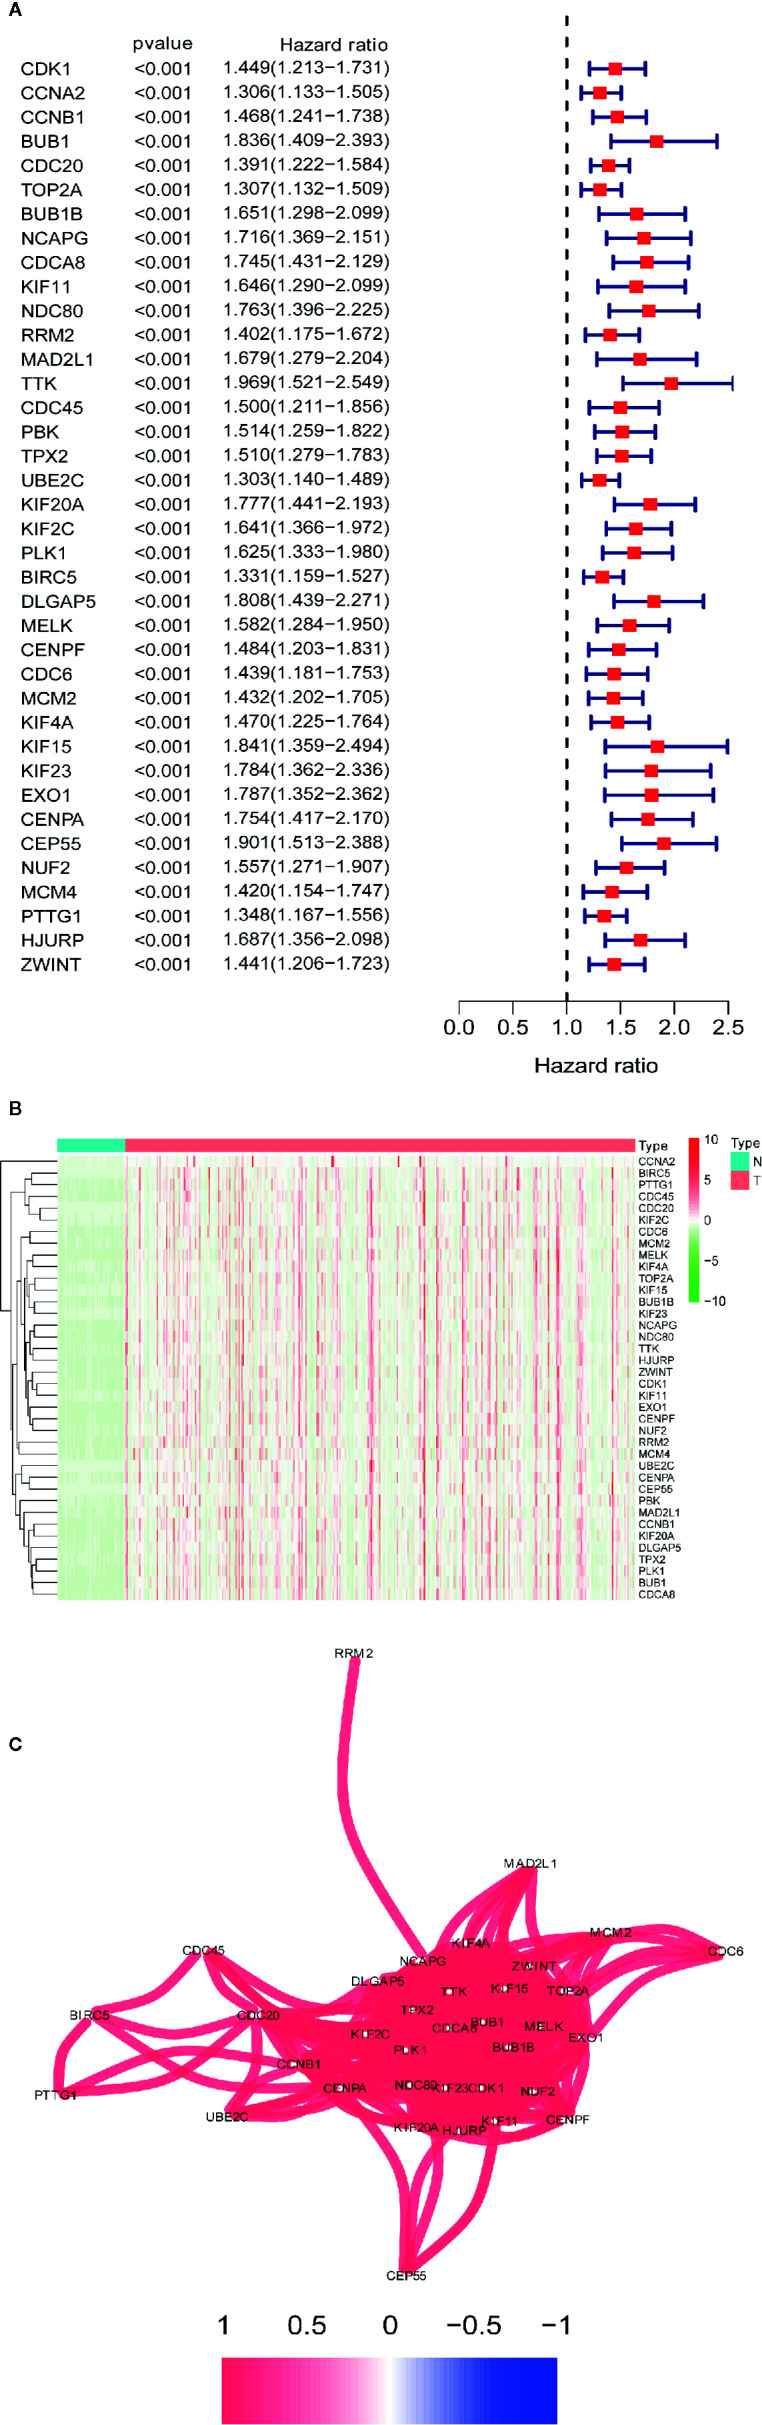
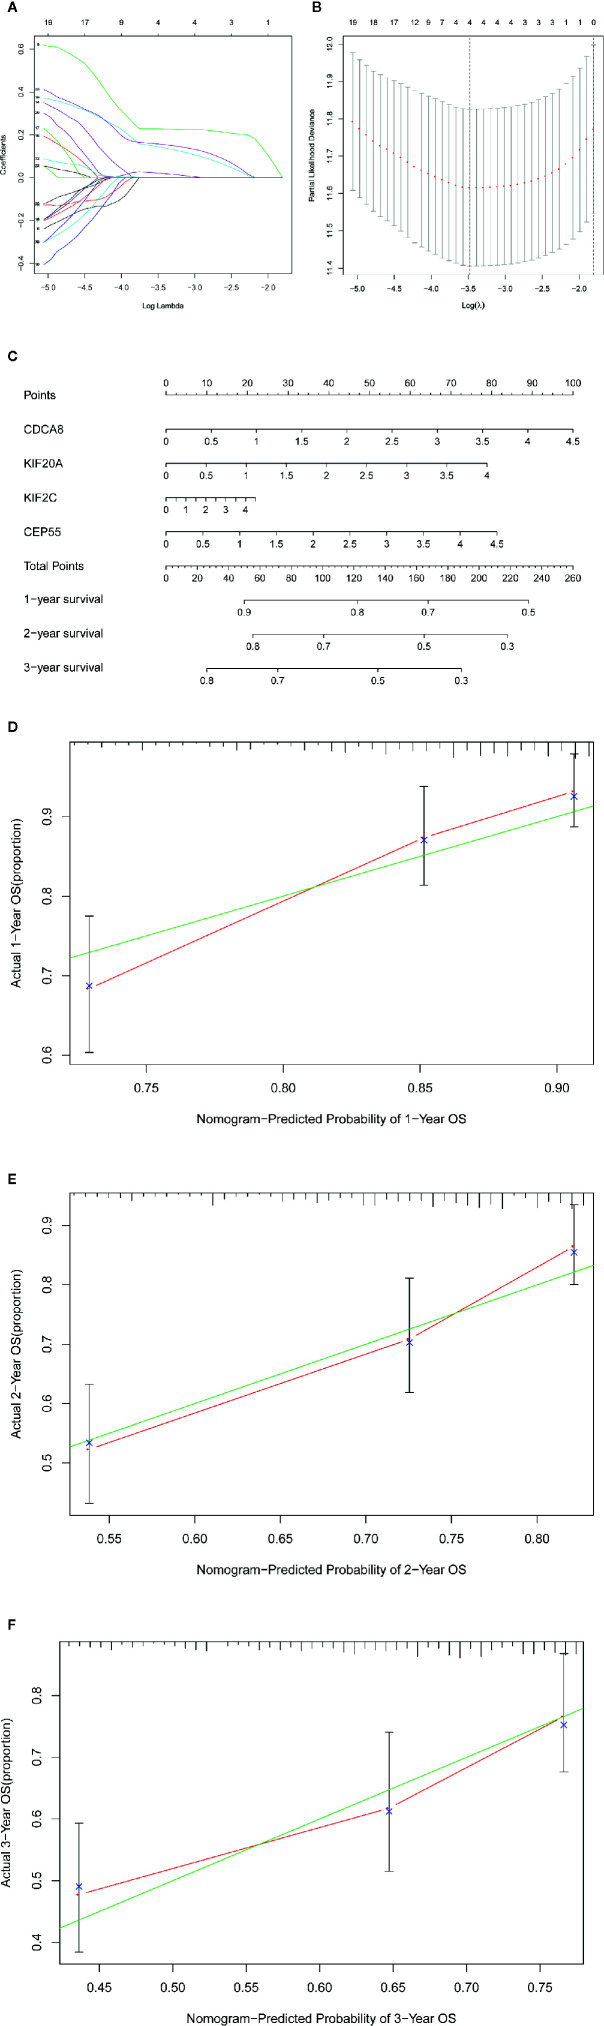
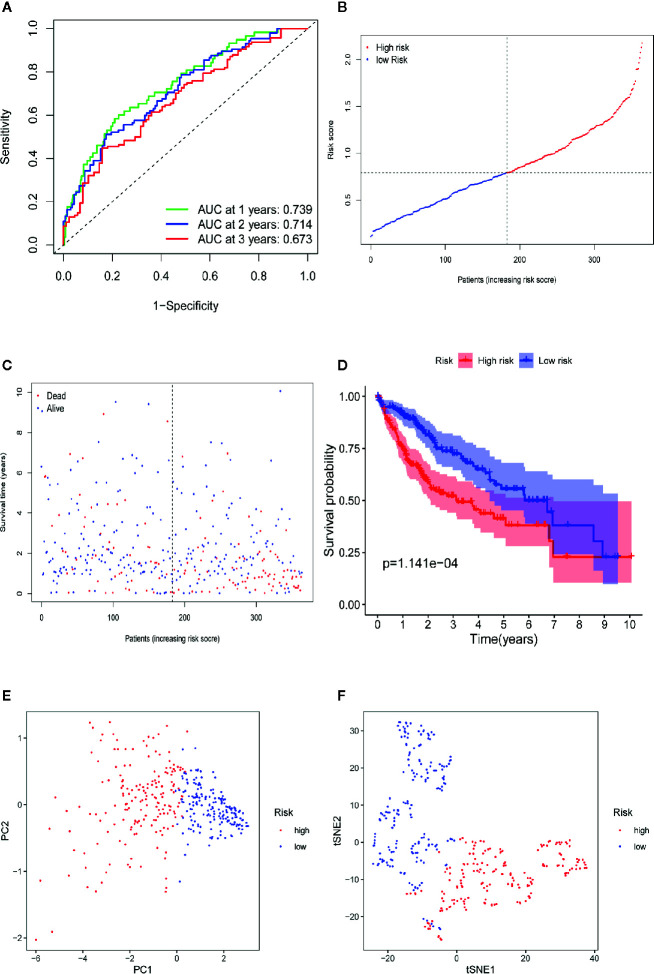
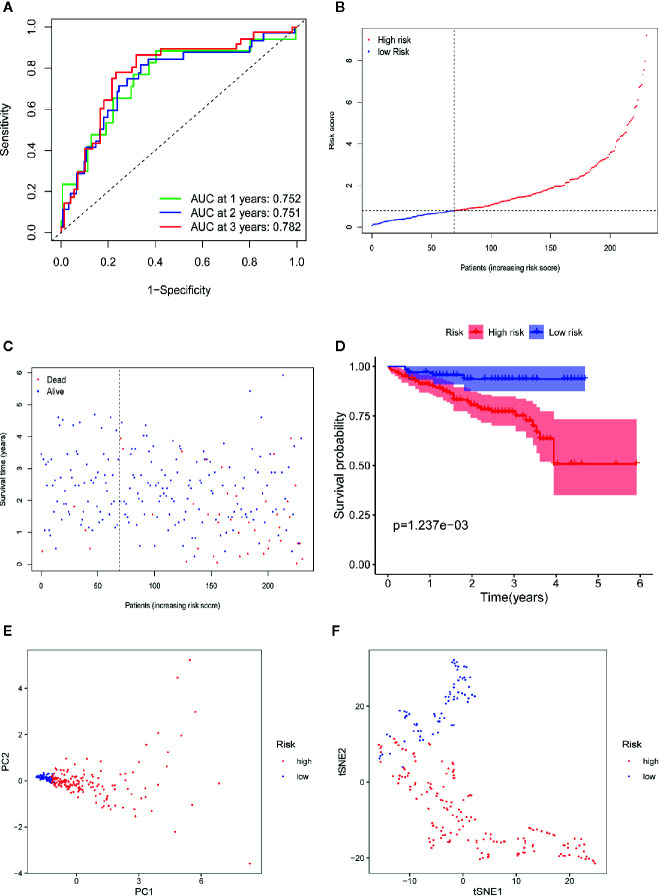
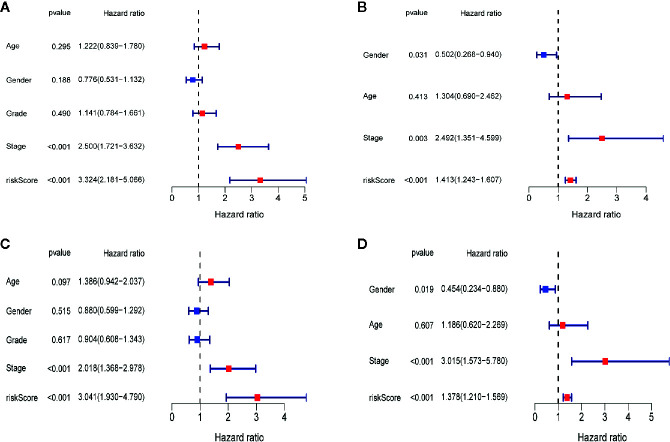
Results: A total of 393 differentially coexpressed genes were obtained. Forty differentially coexpressed hub genes were identified using the CytoHubba plugin, and 38 of them were closely correlated with OS. Afterward, we established the four-gene prognostic signature with an acceptable accuracy (area under the curve [AUC] of 1-year survival: 0.739). The ICGC-LIRI-JP dataset also supported the acceptable accuracy (AUC of 1-year survival:0.752). Compared with low-risk cohort, HCC cases in the high-risk cohort had shorter OS, higher tumor grades, and higher T stages. The risk scores of this signature still act as independent predictors of OS (P<0.001). Functional enrichment analyses suggest that it was mainly organelle fission and nuclear division that were enriched. Finally, ssGSEA revealed that this signature is strongly associated with the immune status of HCC patients.
Conclusions: The proposed prognostic signature of four differentially coexpressed hub genes has satisfactory prognostic ability, providing important insight into the prediction of HCC prognosis.
Keywords: hepatocellular carcinoma; immune status; least absolute shrinkage and selection operator Cox regression; prognostic signature; single-sample gene set enrichment analysis; weighted gene coexpression network analysis.
Copyright © 2021 Zhu, Ru and Ma.
Conflict of interest statement
The authors declare that the research was conducted in the absence of any commercial or financial relationships that could be construed as a potential conflict of interest.
Figures


Similar articles
-
A novel signature incorporating lipid metabolism- and immune-related genes to predict the prognosis and immune landscape in hepatocellular carcinoma.Front Oncol. 2023 Jun 6;13:1182434. doi: 10.3389/fonc.2023.1182434. eCollection 2023. Front Oncol. 2023. PMID: 37346073 Free PMC article.
-
An Inflammatory Response-Related Gene Signature Can Impact the Immune Status and Predict the Prognosis of Hepatocellular Carcinoma.Front Oncol. 2021 Mar 22;11:644416. doi: 10.3389/fonc.2021.644416. eCollection 2021. Front Oncol. 2021. PMID: 33828988 Free PMC article.
-
Mitochondrial-Related Transcriptome Feature Correlates with Prognosis, Vascular Invasion, Tumor Microenvironment, and Treatment Response in Hepatocellular Carcinoma.Oxid Med Cell Longev. 2022 Apr 30;2022:1592905. doi: 10.1155/2022/1592905. eCollection 2022. Oxid Med Cell Longev. 2022. PMID: 35535359 Free PMC article.
-
Identification of an Endoplasmic Reticulum Stress-Related Gene Signature to Evaluate the Immune Status and Predict the Prognosis of Hepatocellular Carcinoma.Front Genet. 2022 May 27;13:850200. doi: 10.3389/fgene.2022.850200. eCollection 2022. Front Genet. 2022. PMID: 35711939 Free PMC article.
-
Identification and Validation of Ubiquitin-Specific Proteases as a Novel Prognostic Signature for Hepatocellular Carcinoma.Front Oncol. 2021 Feb 25;11:629327. doi: 10.3389/fonc.2021.629327. eCollection 2021. Front Oncol. 2021. PMID: 33718205 Free PMC article.
Cited by
-
A transcriptomic intratumour heterogeneity-free signature overcomes sampling bias in prognostic risk classification for hepatocellular carcinoma.JHEP Rep. 2023 Apr 11;5(6):100754. doi: 10.1016/j.jhepr.2023.100754. eCollection 2023 Jun. JHEP Rep. 2023. PMID: 37234275 Free PMC article.
-
Identification and verification of novel immune-related ferroptosis signature with excellent prognostic predictive and clinical guidance value in hepatocellular carcinoma.Front Genet. 2023 Aug 21;14:1112744. doi: 10.3389/fgene.2023.1112744. eCollection 2023. Front Genet. 2023. PMID: 37671041 Free PMC article.
-
Evaluate the immune-related eRNA models and signature score to predict the response to immunotherapy in thyroid carcinoma.Cancer Cell Int. 2022 Oct 10;22(1):307. doi: 10.1186/s12935-022-02722-8. Cancer Cell Int. 2022. PMID: 36217201 Free PMC article.
References
LinkOut - more resources
Full Text Sources
Other Literature Sources