. 2021 May 10;95(11):e00453-21.
doi: 10.1128/JVI.00453-21. Epub 2021 Mar 24.

Thiopurines activate an antiviral unfolded protein response that blocks influenza A virus glycoprotein accumulation

Affiliations

Thiopurines activate an antiviral unfolded protein response that blocks influenza A virus glycoprotein accumulation

Patrick D Slaine et al. J Virol. .

Abstract

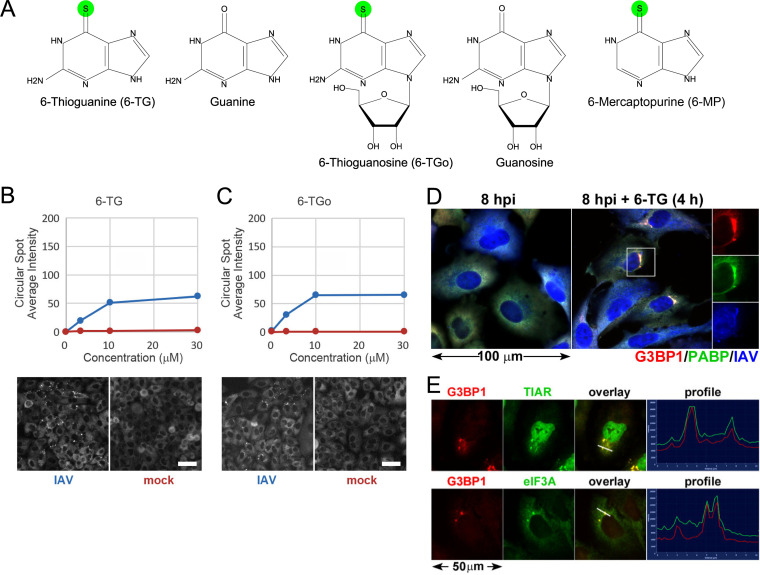
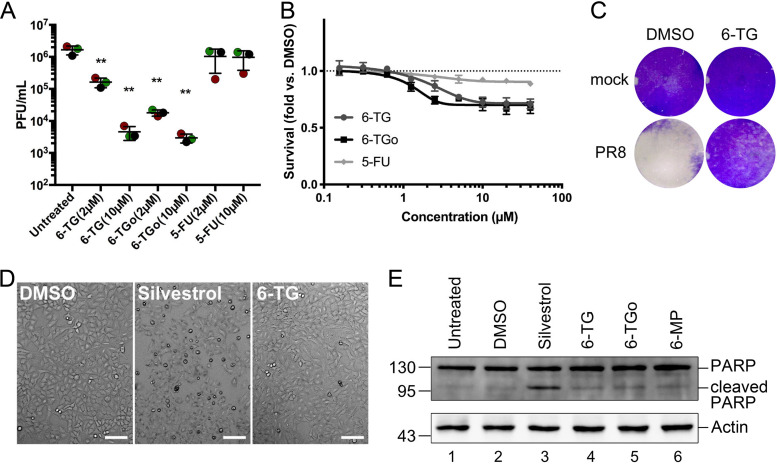
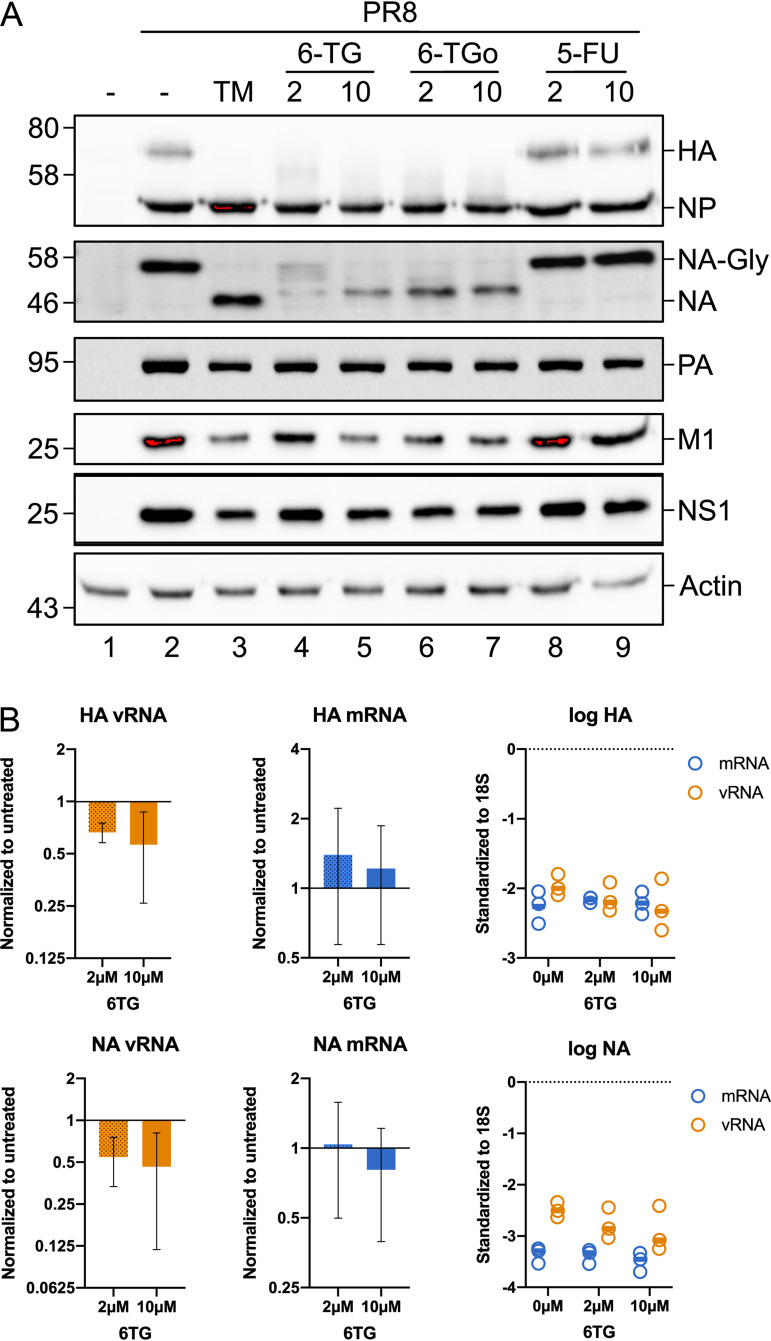
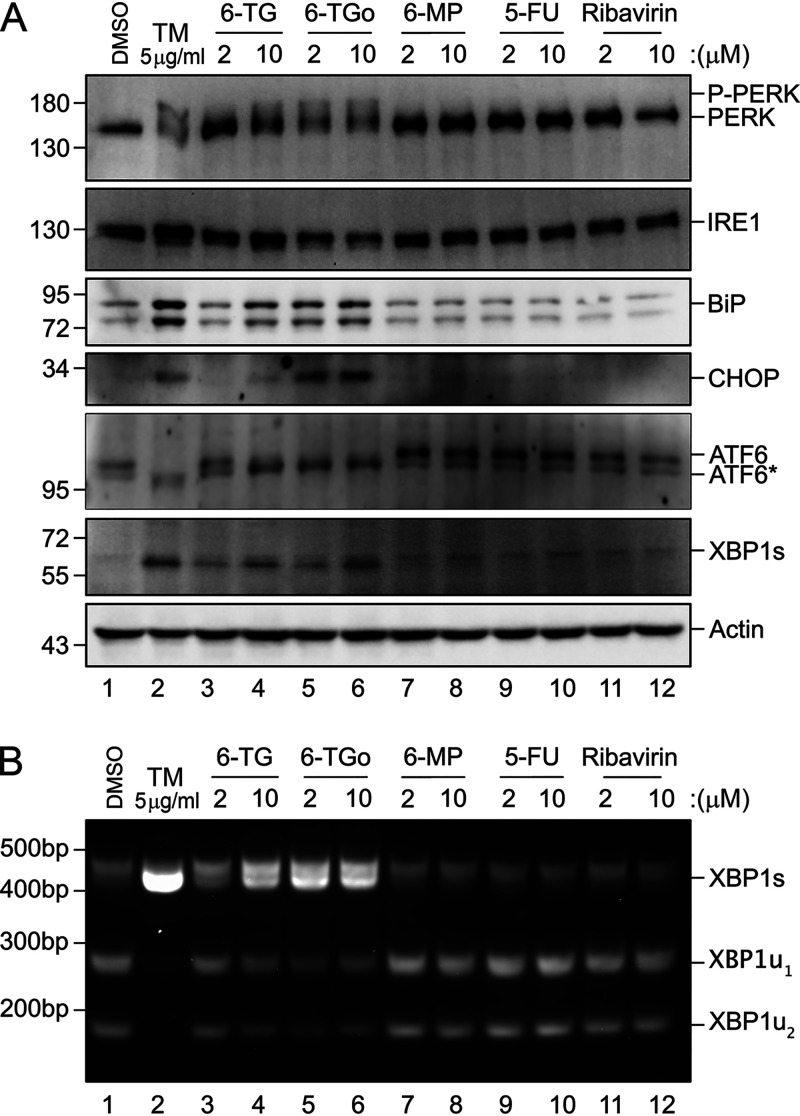
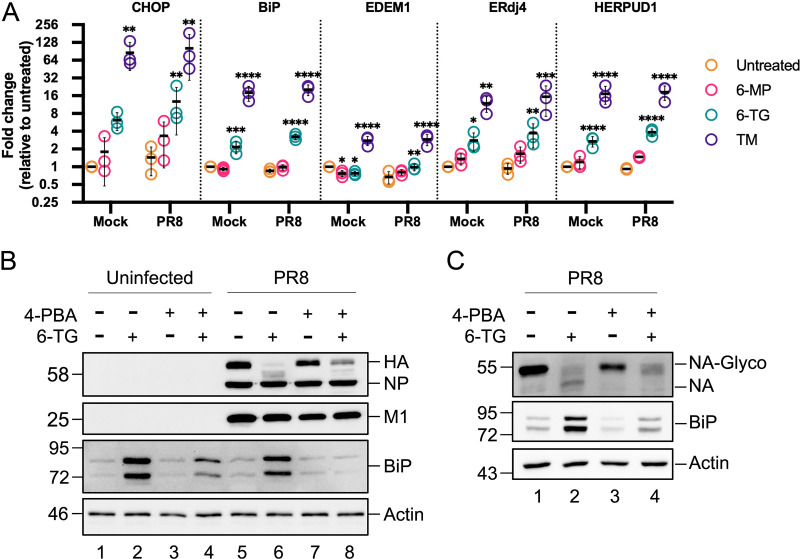
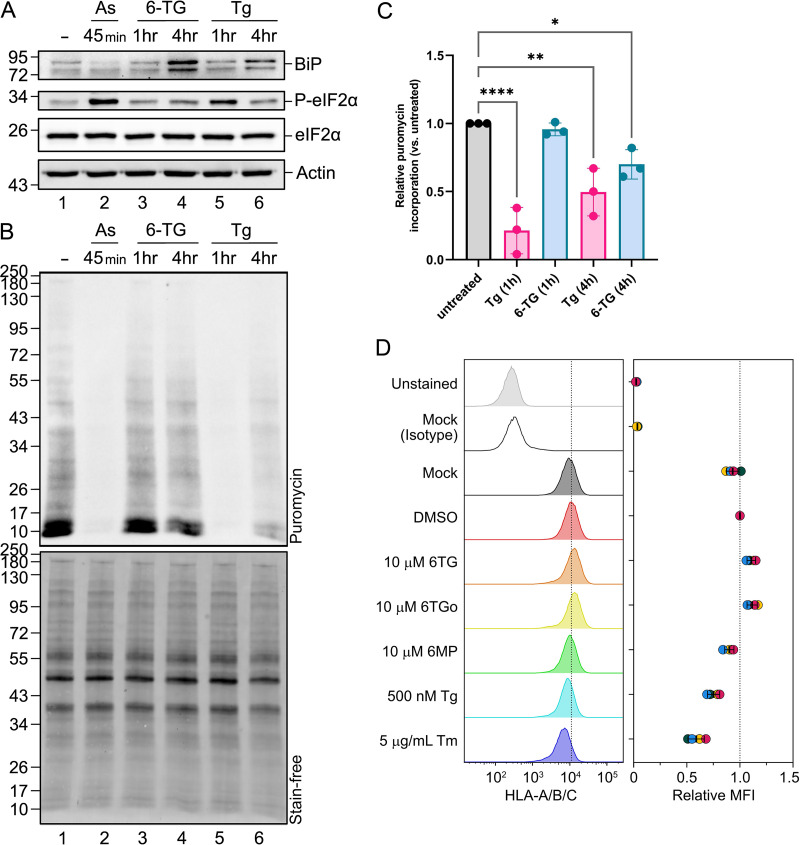
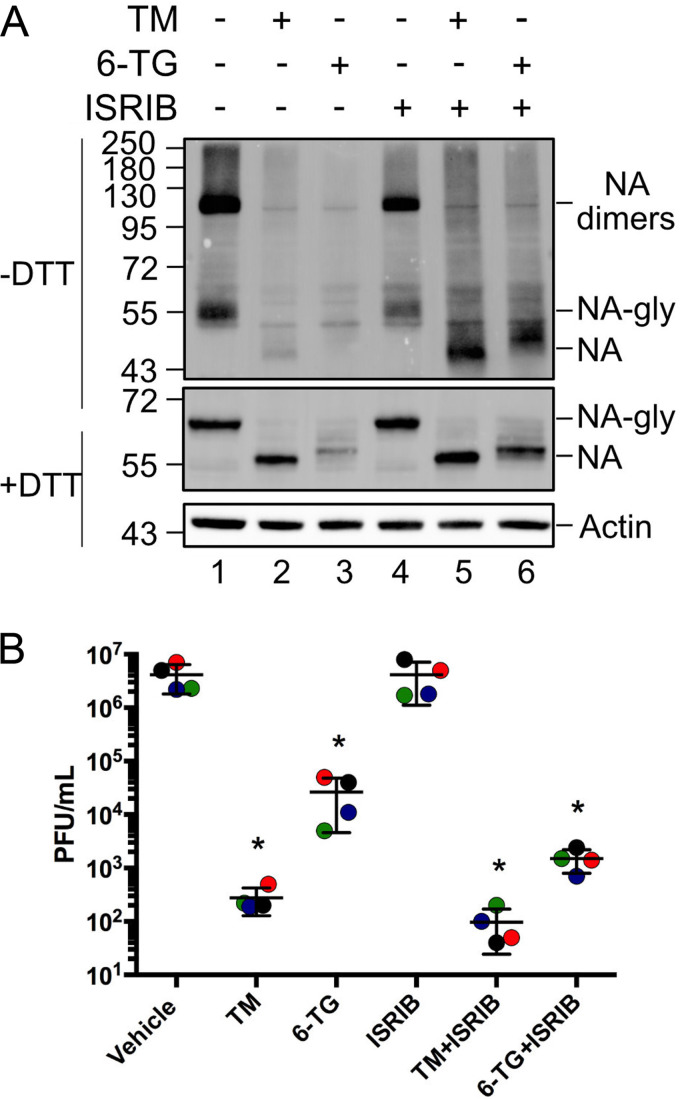
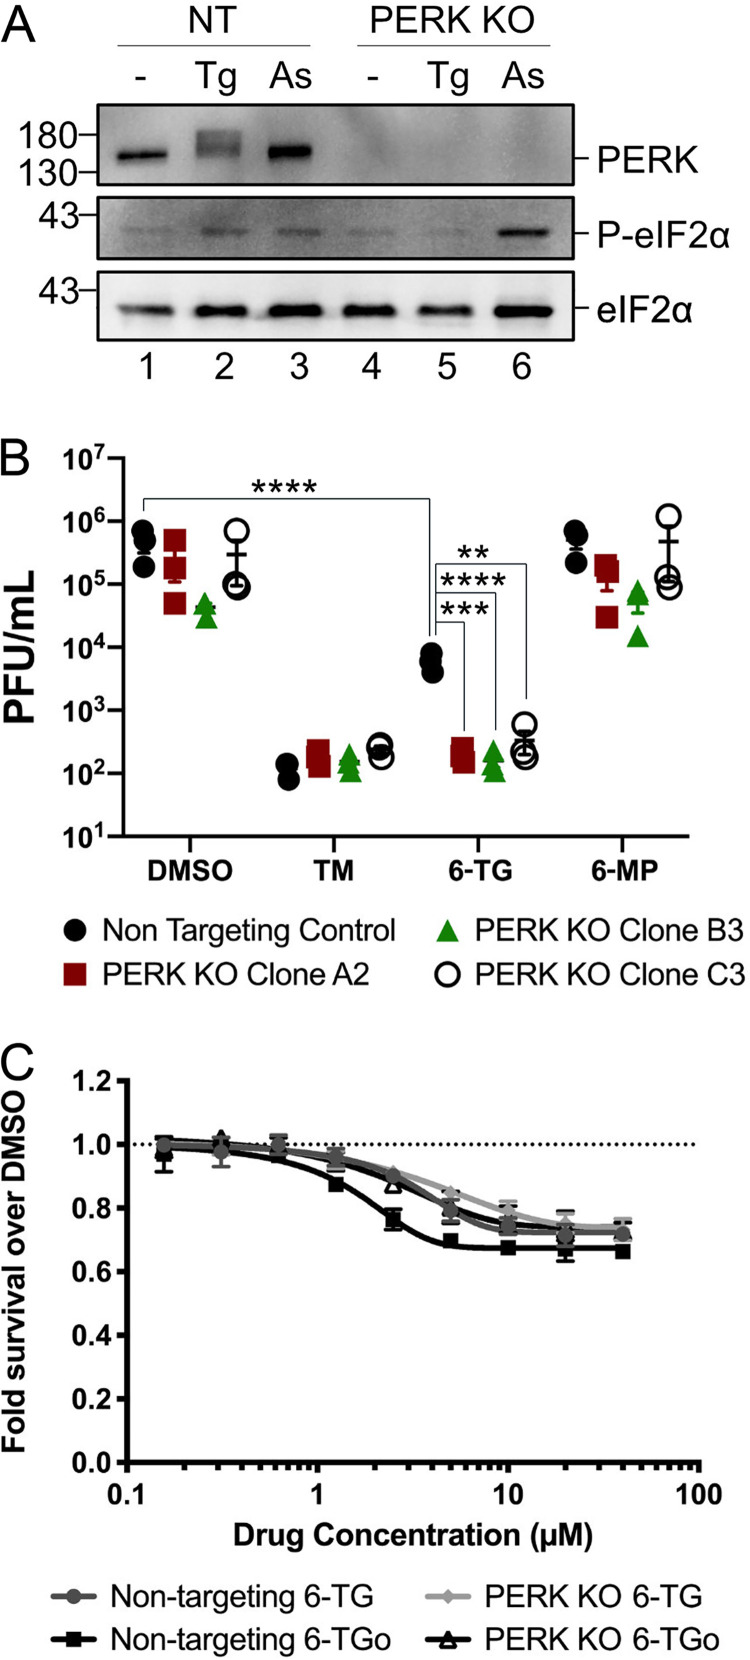
Influenza A viruses (IAVs) utilize host shutoff mechanisms to limit antiviral gene expression and redirect translation machinery to the synthesis of viral proteins. Previously, we showed that IAV replication is sensitive to protein synthesis inhibitors that block translation initiation and induce formation of cytoplasmic condensates of untranslated messenger ribonucleoprotein complexes called stress granules (SGs). In this study, using an image-based high-content screen, we identified two thiopurines, 6-thioguanine (6-TG) and 6-thioguanosine (6-TGo), that triggered SG formation in IAV-infected cells and blocked IAV replication in a dose-dependent manner without eliciting SG formation in uninfected cells. 6-TG and 6-TGo selectively disrupted the synthesis and maturation of IAV glycoproteins hemagglutinin (HA) and neuraminidase (NA) without affecting the levels of the viral RNAs that encode them. By contrast, these thiopurines had minimal effect on other IAV proteins or the global host protein synthesis. Disruption of IAV glycoprotein accumulation by 6-TG and 6-TGo correlated with activation of unfolded protein response (UPR) sensors activating transcription factor-6 (ATF6), inositol requiring enzyme-1 (IRE1) and PKR-like endoplasmic reticulum kinase (PERK), leading to downstream UPR gene expression. Treatment of infected cells with the chemical chaperone 4-phenylbutyric acid diminished thiopurine-induced UPR activation and partially restored the processing and accumulation of HA and NA. By contrast, chemical inhibition of the integrated stress response downstream of PERK restored accumulation of NA monomers but did not restore processing of viral glycoproteins. Genetic deletion of PERK enhanced the antiviral effect of 6-TG without causing overt cytotoxicity, suggesting that while UPR activation correlates with diminished viral glycoprotein accumulation, PERK could limit the antiviral effects of drug-induced ER stress. Taken together, these data indicate that 6-TG and 6-TGo are effective host-targeted antivirals that trigger the UPR and selectively disrupt accumulation of viral glycoproteins.IMPORTANCESecreted and transmembrane proteins are synthesized in the endoplasmic reticulum (ER), where they are folded and modified prior to transport. Many viruses rely on the ER for the synthesis and processing of viral glycoproteins that will ultimately be incorporated into viral envelopes. Viral burden on the ER can trigger the unfolded protein response (UPR). Much remains to be learned about how viruses co-opt the UPR to ensure efficient synthesis of viral glycoproteins. Here, we show that two FDA-approved thiopurine drugs, 6-TG and 6-TGo, induce the UPR, which represents a previously unrecognized effect of these drugs on cell physiology. This thiopurine-mediated UPR activation blocks influenza virus replication by impeding viral glycoprotein accumulation. Our findings suggest that 6-TG and 6-TGo may have broad antiviral effect against enveloped viruses that require precise tuning of the UPR to support viral glycoprotein synthesis.


Figures

FIG 1
FIG 1
Thiopurine analogs 6-TG and 6-TGo selectively induce stress granules in IAV-infected cells. (A) Structures of 6-TG and 6-TGo compared to structurally similar nucleobases and nucleosides. Sulfur atoms in 6-TG, 6-TGo, and 6-MP are highlighted in green. (B and C, top) Circular spot intensity quantification of EGFP-G3BP focus formation in cells infected with IAV-Udorn (blue) or mock-infected cells (red) treated with increasing doses of 6-TG (B) and 6-TGo (C). (Bottom) Representative Cellomics images of the EGFP channel of cells treated with 30 μM 6-TG (B) and 6-TGo (C). (D) Immunofluorescence staining of A549 cells infected with IAV-CA/07 and treated with 6-TG or mock treated for 4 h. The stress granule markers G3BP1 (red) and PABP (green) colocalize in cytoplasmic stress granules (separate channels are shown in the outset). Infected cells are stained with anti-IAV antibody (blue). (E) Immunofluorescence staining of A549 cells treated as described above for panel D for the stress granule markers G3BP1 (red), TIAR (green) (top), and eIF3A (green) (bottom). White lines correspond to pixel intensity profiles shown on the right, as captured using Zeiss ZEN software.
FIG 2
FIG 2
6-TG and 6-TGo inhibit IAV replication. (A) A549 cells were mock infected or infected with IAV-PR8 at an MOI of 0.1. After 1 h, cell monolayers were washed and overlaid with medium containing drugs at the indicated concentrations or the vehicle control. At 24 hpi, cell supernatants were collected, and infectious virions were enumerated by a plaque assay. Data from 3 independent experiments are graphed (n = 3), and error bars denote standard deviations. One-way ANOVA and Tukey’s post hoc multiple-comparison tests were done to determine statistical significance (**, P value of <0.01). (B) A549 cells were treated with increasing doses of 6-TG, 6-TGo, 5-FU, or the vehicle control (DMSO) for 23 h, and cell viability was measured using an alamarBlue assay. Relative fluorescence units were normalized to the value for the vehicle control. Error bars represent standard deviations (n = 3). (C) Vero cells were infected with IAV-PR8 and treated with 6-TG (10 μM) or the vehicle (DMSO). After 72 hpi, cells were fixed with 5% formaldehyde and stained with 1% crystal violet. (D) Representative phase-contrast images of A549 cell monolayers treated with silvestrol (320 nM), 6-TG (10 μM), or the vehicle (DMSO) control for 23 h. Bars, 100 μm. (E) Lysates of A549 cells treated with silvestrol (320 nM), the indicated thiopurines (10 μM), or the vehicle control (DMSO) were analyzed by Western blotting for total PARP (full length and cleaved). Actin was used as a loading control.
FIG 3
FIG 3
6-TG treatment inhibits HA and NA glycoprotein processing and accumulation without affecting transcript levels. (A) A549 cells were mock infected or infected with IAV-PR8 at an MOI of 0.1. After 1 h, cell monolayers were washed and overlaid with medium containing drugs at the indicated concentrations or the vehicle control (−). At 24 hpi, cell lysates were collected and analyzed by Western blotting using a polyclonal IAV antibody that detects HA, NP, and M1 as well as antibodies that detect IAV PA, NA, NS1, or cellular actin. A representative blot from 3 independent experiments is shown. (B) The levels of IAV HA and NA mRNAs, and HA and NA genomic vRNAs, were measured by RT-qPCR in A549 cells infected with IAV-PR8 and treated with 2 μM or 10 μM 6-TG or the vehicle control. Total RNA was isolated at 24 hpi. Changes in RNA levels were calculated by the ΔΔCT method and normalized to 18S rRNA. Error bars represent standard deviations (n = 3). Circles represent biological replicates, and lines represent mean values.
FIG 4
FIG 4
6-TG and 6-TGo activate the UPR. (A) A549 cells were treated with 6-thioguanine (6-TG), 6-thioguanosine (6-TGo), 6-mercaptopurine (6-MP), 5-fluorouracil (5-FU), or ribavirin at the indicated concentrations for 6 h prior to harvesting lysates for immunoblotting for the indicated cellular proteins. Tunicamycin (TM) at 5 μg/ml served as a positive control for UPR activation. ATF6* indicates a lower-molecular-weight species that is not cleaved to its active form. (B) cDNA was generated from total RNA that was isolated from treated cells. XBP1 mRNA splicing was determined by the semiquantitative RT-PCR splicing assay. XBP1u1 and XBP1u2 indicate the cleaved products from digesting the unspliced XBP1 cDNA with PstI.
FIG 5
FIG 5
6-TG treatment upregulates UPR genes, and chemical chaperones can limit the UPR and restore viral glycoprotein accumulation. (A) A549 cells were infected with IAV-PR8 at an MOI of 1, washed, and overlaid with medium containing 6-MP, 6-TG, or TM. Cell lysates were collected at 24 hpi, and RNA was isolated and processed for RT-qPCR. Changes in CHOP, BiP, EDEM1, ERdj4, and HERPUD1 mRNA levels were calculated by the ΔΔCT method, normalized using 18S rRNA as a reference gene, and standardized to mock. Error bars represent standard deviations (n = 3). Circles represent individual replicates, and lines represent mean values. Statistical significance was calculated via two-way ANOVA followed by a Dunnett multiple-comparison test. (B and C) A549 cells were mock infected or infected with IAV-PR8 at an MOI of 1. After 1 h, cells were washed and incubated with 20 μM 6-TG or the vehicle control, with or without 10 μM 4-PBA. At 20 hpi, cell lysates were harvested and probed using a polyclonal IAV antibody that detects IAV HA, NP, and M1 proteins (B); IAV NA (C); and antibodies to cellular BiP and actin. Representative data from 3 independent experiments are shown.
FIG 6
FIG 6
6-TG treatment does not block global translation or decrease surface expression of human leukocyte antigen A/B/C (HLA-A/B/C) glycoproteins. (A) A549 cells were treated with 10 μM 6-TG and 1 μM thapsigargin (Tg) for the indicated times or with 500 μM sodium arsenite (As) for 45 min prior to harvesting cell lysates and Western blotting for BiP, eIF2α, phosphorylated eIF2α, or actin. (B) Protein synthesis in cells treated as described above for panel A was analyzed using a puromycylation assay. (C) The puromycin signal (B, top) was quantified and normalized to total protein loading (B, bottom, Stain-free) from 3 independent replicates. Error bars indicate standard deviations. One-way ANOVA and Dunnett multiple-comparison tests were done to determine statistical significance (*, P value of <0.05; **, P value of <0.01; ***, P value of <0.001). (D) A549 cells were treated as indicated, and the surface expression of HLA-A/B/C was analyzed using flow cytometry. The histograms from one representative experiment are depicted on the left, where the vertical dotted line indicates the median fluorescence intensity (MFI) of HLA-A/B/C in the DMSO-treated sample. The histograms on the right display the MFI of HLA-A/B/C on the cell surface for each treatment shown, with the individual data points (colored circles) with black lines indicating the means ± standard deviations (n = 4, except for the isotype control [n = 2]). The vertical dotted line in the graph indicates the mean MFI from the DMSO-treated samples.
FIG 7
FIG 7
Integrated stress response inhibition restores NA synthesis in the presence of 6-TG, but NA processing and virion production remain impaired. A549 cells were infected with IAV-PR8 at an MOI of 1. After 1 h, cells were washed and treated with tunicamycin (TM) (5 μg/ml), 6-thioguanine (6-TG) (10 μM), and/or 500 ng/ml ISRIB. (A) At 24 hpi, cell lysates were collected and processed for native SDS-PAGE and immunoblotting using an anti-NA antibody. N-glycosylated forms of NA are indicated as NA-gly, whereas glycosylated NA dimers are indicated as dimers. Actin was used as a loading control. (B) At 24 hpi, cell supernatants were collected, and infectious IAV-PR8 virions were enumerated by a plaque assay. Error bars represent the standard deviations between biological replicates (n = 4). Circles represent biological replicates, and lines represent mean values.
FIG 8
FIG 8
Genetic deletion of PERK enhances the antiviral effect of 6-TG. (A) Western blotting of PERK KO cells (clone B3) and nontargeting control gRNA lentivirus-transduced cells (NT) treated with 1 μM thapsigargin (Tg) or 500 μM sodium arsenite (As). Lysates were collected at 1 h post-treatment and analyzed for PERK expression and activation and total and phosphorylated eIF2α. (B) A549 PERK KO cells (clones A2, B3, and C3) and the nontargeting control cell line were infected with PR8 at an MOI of 0.1 and treated with tunicamycin (TM) (5 μg/ml), 6-thioguanine (6-TG) (10 μM), and 6-mercaptopurine (6-MP) (10 μM) for 23 h. The supernatant was collected at 24 hpi, and viral progeny were quantified by plaque assay. Statistical significance was calculated via two-way ANOVA followed by a Dunnett multiple-comparison test (only a subset of statistically significant differences is highlighted with asterisks for clarity). (C) A549 PERK KO clone B3 and nontargeting control cells were treated with escalating doses of 6-TG, 6-TGo, or the vehicle control for 23 h, and cell viability was measured using an alamarBlue assay. Relative fluorescence units were normalized to the vehicle control. Error bars represent standard deviations (n = 3).

Similar articles

Cited by

References

    1. Walter P, Ron D. 2011. The unfolded protein response: from stress pathway to homeostatic regulation. Science 334:1081–1086. 10.1126/science.1209038. - DOI - PubMed
    1. Wu X, Rapoport TA. 2018. Mechanistic insights into ER-associated protein degradation. Curr Opin Cell Biol 53:22–28. 10.1016/j.ceb.2018.04.004. - DOI - PMC - PubMed
    1. Johnston BP, McCormick C. 2019. Herpesviruses and the unfolded protein response. Viruses 12:17. 10.3390/v12010017. - DOI - PMC - PubMed
    1. Marques M, Ramos B, Soares AR, Ribeiro D. 2019. Cellular proteostasis during influenza A virus infection—friend or foe? Cells 8:228. 10.3390/cells8030228. - DOI - PMC - PubMed
    1. Wilson IA, Skehel JJ, Wiley DC. 1981. Structure of the haemagglutinin membrane glycoprotein of influenza virus at 3 A resolution. Nature 289:366–373. 10.1038/289366a0. - DOI - PubMed